

| UPI Remitter Members - Top 50 Members (Aug'25) | |||||||
|---|---|---|---|---|---|---|---|
| Sr. No. | UPI Remitter Members (Aug-2025) | Total Volume (In Mn) | Approved % | BD % | TD% | Total Debit Reversal Count (In Mn) | Debit Reversal Success % |
| 1 | State Bank of India | 5,368.74 | 93.66% | 5.92% | 0.42% | 14.51 | 97.89% |
| 2 | HDFC Bank Ltd. | 1,581.09 | 95.37% | 4.63% | 0.01% | 3.51 | 98.73% |
| 3 | Bank of Baroda | 1,369.53 | 91.44% | 8.50% | 0.05% | 3.73 | 99.03% |
| 4 | Union Bank of India | 1,233.20 | 92.23% | 7.02% | 0.75% | 4.64 | 61.93% |
| 5 | Punjab National Bank | 1,131.31 | 91.20% | 8.61% | 0.19% | 3.52 | 97.66% |
| 6 | Kotak Mahindra Bank | 978.17 | 92.39% | 7.47% | 0.13% | 2.46 | 90.51% |
| 7 | Canara Bank | 970.63 | 92.73% | 6.92% | 0.36% | 2.54 | 89.02% |
| 8 | Axis Bank Ltd. | 902.87 | 94.96% | 5.03% | 0.02% | 1.77 | 99.76% |
| 9 | ICICI Bank Ltd. | 752.78 | 95.66% | 3.82% | 0.52% | 2.11 | 84.15% |
| 10 | India Post Payments Bank Limited | 674.59 | 87.92% | 11.15% | 0.93% | 3.26 | 74.86% |
| 11 | Indian Bank | 653.87 | 93.05% | 6.81% | 0.14% | 1.35 | 1.90% |
| 12 | Airtel Payments Bank Limited | 637.23 | 85.83% | 14.05% | 0.12% | 2.61 | 99.17% |
| 13 | Bank Of India | 605.10 | 88.96% | 6.72% | 4.32% | 5.14 | 57.77% |
| 14 | Indian Overseas Bank | 330.15 | 92.90% | 6.47% | 0.64% | 1.24 | 46.60% |
| 15 | Central Bank of India | 307.77 | 91.12% | 7.81% | 1.08% | 1.65 | 80.86% |
| 16 | UCO Bank | 283.93 | 91.70% | 7.93% | 0.37% | 0.94 | 85.11% |
| 17 | Federal Bank Ltd. | 266.43 | 93.11% | 6.30% | 0.59% | 0.77 | 84.27% |
| 18 | Fino Payments Bank Ltd. | 237.47 | 86.17% | 12.42% | 1.42% | 1.08 | 85.22% |
| 19 | Bank of Maharashtra | 218.97 | 93.57% | 6.37% | 0.06% | 0.55 | 92.61% |
| 20 | Indusind Bank Ltd. | 216.95 | 90.15% | 9.59% | 0.26% | 0.81 | 72.79% |
| 21 | IDBI Bank Ltd. | 206.69 | 92.78% | 6.38% | 0.83% | 0.67 | 83.82% |
| 22 | Yes Bank Ltd. | 177.66 | 91.49% | 8.37% | 0.15% | 0.30 | 84.27% |
| 23 | Karnataka Bank | 142.00 | 92.82% | 7.11% | 0.07% | 0.31 | 88.41% |
| 24 | Tri O Tech Solutions Private Limited | 134.92 | 100.00% | 0.00% | 0.00% | - | 0.00% |
| 25 | IDFC Bank Ltd. | 120.47 | 93.64% | 6.28% | 0.08% | 0.28 | 89.06% |
| 26 | The Jammu & Kashmir Bank Limited | 99.01 | 93.01% | 5.82% | 1.17% | 0.68 | 36.82% |
| 27 | Karur Vysya Bank | 95.13 | 92.90% | 6.51% | 0.59% | 0.25 | 83.08% |
| 28 | Bandhan Bank limited | 92.44 | 94.48% | 5.37% | 0.15% | 0.31 | 97.93% |
| 29 | AU Small Finance Bank | 79.26 | 88.14% | 9.53% | 2.33% | 0.67 | 52.38% |
| 30 | The South Indian Bank Limited | 76.06 | 95.03% | 4.73% | 0.24% | 0.13 | 98.14% |
| 31 | JIO Payments Bank Ltd | 61.01 | 84.15% | 12.30% | 3.55% | 0.54 | 87.22% |
| 32 | Punjab and Sind Bank | 59.04 | 90.64% | 8.50% | 0.86% | 0.31 | 83.01% |
| 33 | City Union Bank | 57.26 | 92.59% | 7.30% | 0.11% | 0.10 | 99.53% |
| 34 | Tamilnad Mercantile Bank Limited | 55.86 | 92.16% | 6.56% | 1.28% | 0.20 | 54.34% |
| 35 | Ujjivan Small Finance Bank Limited | 54.77 | 90.46% | 8.26% | 1.28% | 0.21 | 71.19% |
| 36 | Baroda U.P. Bank | 53.78 | 87.67% | 4.69% | 7.63% | 0.92 | 44.49% |
| 37 | NSDL Payments Bank Limited | 51.33 | 85.08% | 13.62% | 1.30% | 0.39 | 71.78% |
| 38 | Kerala Gramin Bank | 50.92 | 90.77% | 6.54% | 2.69% | 0.51 | 70.32% |
| 39 | Telangana Grameena Bank | 40.42 | 88.02% | 9.51% | 2.47% | 0.35 | 44.22% |
| 40 | Maharashtra Gramin Bank | 38.08 | 83.77% | 13.79% | 2.44% | 0.23 | 52.46% |
| 41 | ESAF Small Finance Bank Ltd | 34.96 | 95.92% | 4.01% | 0.08% | 0.08 | 98.84% |
| 42 | Karnataka Gramin Bank | 34.89 | 88.91% | 9.83% | 1.26% | 0.23 | 67.83% |
| 43 | Rajasthan Marudhara Gramin Bank | 32.73 | 85.57% | 11.74% | 2.69% | 0.40 | 31.73% |
| 44 | RBL Bank Ltd. | 32.15 | 92.71% | 6.73% | 0.56% | 0.09 | 76.46% |
| 45 | Andhra Pragathi Grameena Bank | 32.07 | 83.11% | 13.12% | 3.77% | 0.24 | 60.28% |
| 46 | DBS Bank India Limited | 31.37 | 92.08% | 6.44% | 1.48% | 0.11 | 60.18% |
| 47 | Saraswat Co-operative Bank | 30.02 | 94.06% | 4.57% | 1.37% | 0.09 | 71.34% |
| 48 | Equitas Small Finance Bank | 29.43 | 91.02% | 8.64% | 0.33% | 0.10 | 68.99% |
| 49 | Axis Bank Credit Card | 28.41 | 95.02% | 4.91% | 0.08% | 0.07 | 99.83% |
| 50 | Sarva Haryana Gramin Bank | 26.50 | 92.03% | 4.46% | 3.51% | 0.24 | 42.86% |
| UPI Beneficiary Members - Top 50 Members (Aug'25) | |||||||
|---|---|---|---|---|---|---|---|
| Sr.No. | UPI Beneficiary Members (Aug-2025) | Total Volume (In Mn) | Approved % | BD% | TD% | Deemed Approved % | |
| 1 | Yes Bank Ltd. | 8,090.56 | 99.95% | 0.00% | 0.04% | 0.00% | |
| 2 | State Bank of India | 2,060.53 | 99.53% | 0.16% | 0.31% | 0.11% | |
| 3 | Axis Bank Ltd. | 2,034.50 | 99.84% | 0.16% | 0.00% | 0.00% | |
| 4 | HDFC Bank Ltd. | 1,018.91 | 99.25% | 0.75% | 0.01% | 0.00% | |
| 5 | ICICI Bank Ltd. | 555.60 | 99.53% | 0.24% | 0.24% | 0.06% | |
| 6 | Bank of Baroda | 528.94 | 99.71% | 0.26% | 0.03% | 0.05% | |
| 7 | Airtel Payments Bank Limited | 489.64 | 98.09% | 1.86% | 0.05% | 0.04% | |
| 8 | Union Bank of India | 475.30 | 99.34% | 0.09% | 0.57% | 0.15% | |
| 9 | Canara Bank | 453.65 | 99.55% | 0.11% | 0.34% | 0.06% | |
| 10 | Punjab National Bank | 446.99 | 99.54% | 0.25% | 0.21% | 0.09% | |
| 11 | Kotak Mahindra Bank | 372.03 | 98.66% | 1.16% | 0.18% | 0.02% | |
| 12 | Federal Bank Ltd. | 368.44 | 99.36% | 0.20% | 0.44% | 0.02% | |
| 13 | India Post Payments Bank Limited | 295.38 | 97.82% | 1.24% | 0.94% | 0.35% | |
| 14 | Indian Bank | 291.64 | 99.74% | 0.14% | 0.12% | 0.02% | |
| 15 | Bank Of India | 259.40 | 95.20% | 0.73% | 4.07% | 0.59% | |
| 16 | Indusind Bank Ltd. | 202.41 | 99.61% | 0.28% | 0.11% | 0.04% | |
| 17 | Indian Overseas Bank | 152.37 | 98.98% | 0.34% | 0.68% | 0.21% | |
| 18 | Unity Small Finance Bank Limited | 140.77 | 99.93% | 0.00% | 0.06% | 0.02% | |
| 19 | Central Bank of India | 139.58 | 98.78% | 0.45% | 0.77% | 0.18% | |
| 20 | UCO Bank | 120.45 | 99.29% | 0.34% | 0.37% | 0.05% | |
| 21 | RBL Bank Ltd. | 96.09 | 99.64% | 0.05% | 0.31% | 0.12% | |
| 22 | Fino Payments Bank Ltd. | 90.11 | 97.28% | 1.44% | 1.28% | 0.04% | |
| 23 | IDBI Bank Ltd. | 85.28 | 99.24% | 0.34% | 0.42% | 0.06% | |
| 24 | Bank of Maharashtra | 84.48 | 99.72% | 0.23% | 0.04% | 0.01% | |
| 25 | Tri O Tech Solutions Private Limited | 61.83 | 98.81% | 1.19% | 0.01% | 0.00% | |
| 26 | Karnataka Bank | 61.63 | 99.60% | 0.24% | 0.16% | 0.03% | |
| 27 | NSDL Payments Bank Limited | 59.43 | 98.64% | 0.963% | 0.40% | 0.11% | |
| 28 | Suryoday Small Finance Bank Limited | 55.98 | 95.93% | 0.43% | 3.64% | 1.37% | |
| 29 | One Mobikwik Systems Limited | 55.53 | 99.85% | 0.00% | 0.15% | 0.00% | |
| 30 | The Jammu & Kashmir Bank Limited | 53.04 | 99.13% | 0.40% | 0.47% | 0.28% | |
| 31 | IDFC Bank Ltd. | 52.91 | 99.05% | 0.87% | 0.08% | 0.03% | |
| 32 | Bandhan Bank limited | 52.76 | 99.43% | 0.44% | 0.13% | 0.06% | |
| 33 | JIO Payments Bank Ltd | 52.59 | 97.18% | 0.99% | 1.83% | 0.21% | |
| 34 | The South Indian Bank Limited | 47.86 | 99.84% | 0.12% | 0.05% | 0.01% | |
| 35 | Karur Vysya Bank | 45.74 | 99.29% | 0.31% | 0.40% | 0.05% | |
| 36 | Tamilnad Mercantile Bank Limited | 37.31 | 98.56% | 0.18% | 1.26% | 0.15% | |
| 37 | AU Small Finance Bank | 35.14 | 97.79% | 0.48% | 1.73% | 0.44% | |
| 38 | City Union Bank | 31.86 | 99.39% | 0.42% | 0.19% | 0.00% | |
| 39 | Kerala Gramin Bank | 29.20 | 97.99% | 0.30% | 1.71% | 0.76% | |
| 40 | Citi Bank | 26.55 | 99.76% | 0.20% | 0.04% | 0.02% | |
| 41 | Ujjivan Small Finance Bank Limited | 26.46 | 98.48% | 0.21% | 1.31% | 0.20% | |
| 42 | Punjab and Sind Bank | 26.13 | 98.25% | 0.89% | 0.86% | 0.12% | |
| 43 | Baroda U.P. Bank | 25.04 | 94.27% | 0.23% | 5.50% | 1.05% | |
| 44 | Telangana Grameena Bank | 18.32 | 98.04% | 0.37% | 1.58% | 0.24% | |
| 45 | Karnataka Gramin Bank | 16.55 | 98.92% | 0.25% | 0.83% | 0.33% | |
| 46 | ESAF Small Finance Bank Ltd | 15.98 | 99.40% | 0.50% | 0.10% | 0.01% | |
| 47 | Maharashtra Gramin Bank | 15.93 | 96.71% | 0.18% | 3.11% | 0.20% | |
| 48 | Rajasthan Marudhara Gramin Bank | 14.83 | 84.53% | 1.67% | 13.80% | 0.32% | |
| 49 | Equitas Small Finance Bank | 14.82 | 97.67% | 1.98% | 0.35% | 0.11% | |
| 50 | Andhra Pragathi Grameena Bank | 14.55 | 95.89% | 1.01% | 3.10% | 0.16% | |
| UPI Apps (Aug'25) | |||||||||
|---|---|---|---|---|---|---|---|---|---|
| Sr.No. | Application Name | Customer Initiated Transactions | B2C Transactions | B2B Transactions | Total | ||||
| Volume (Mn) | Value (Cr) | Volume (Mn) | Value (Cr) | Volume (Mn) | Value (Cr) | Volume (Mn) | Value (Cr) | ||
| 1 | Phone Pe # | 9,152.54 | 11,99,457.73 | 0.00 | 0.00 | 0.00 | 0.00 | 9,152.54 | 11,99,457.73 |
| 2 | Google Pay # | 7,063.76 | 8,83,682.27 | 0.00 | 0.00 | 0.00 | 0.00 | 7,063.76 | 8,83,682.27 |
| 3 | Paytm # | 1,407.23 | 1,43,484.97 | 0.00 | 0.00 | 0.00 | 0.00 | 1,407.23 | 1,43,484.97 |
| 4 | Navi # | 504.45 | 25,396.91 | 0.00 | 0.00 | 0.00 | 0.00 | 504.45 | 25,396.91 |
| 5 | super.money # | 256.64 | 9,290.21 | 0.00 | 0.00 | 0.00 | 0.00 | 256.64 | 9,290.21 |
| 6 | Cred # | 150.00 | 55,756.24 | 0.00 | 0.00 | 0.00 | 0.00 | 150.00 | 55,756.24 |
| 7 | FamApp by Trio # | 135.65 | 1,708.85 | 0.00 | 0.00 | 0.00 | 0.00 | 135.65 | 1,708.85 |
| 8 | Axis Bank Apps | 30.37 | 5,482.37 | 104.76 | 4327.97 | 0.01 | 2.17 | 135.14 | 9,812.52 |
| 9 | BHIM # | 100.16 | 15,002.68 | 0.00 | 0.00 | 0.00 | 0.00 | 100.17 | 15,002.68 |
| 10 | Amazon Pay # | 98.98 | 10,830.80 | 0.00 | 0.00 | 0.00 | 0.00 | 98.98 | 10,830.80 |
| 11 | Whatsapp # | 78.21 | 5,583.34 | 0.00 | 0.00 | 0.00 | 0.00 | 78.21 | 5,583.34 |
| 12 | ICICI Bank Apps | 73.48 | 14,644.94 | 0.01 | 15.57 | 2.31 | 1929.25 | 75.80 | 16,589.76 |
| 13 | HDFC Bank Apps | 49.66 | 16,107.74 | 23.19 | 11.75 | 0.01 | 0.70 | 72.86 | 16,120.19 |
| 14 | Kotak Mahindra Bank Apps | 71.87 | 8,662.31 | 0.00 | 0.00 | 0.00 | 0.00 | 71.87 | 8,662.31 |
| 15 | Yes Bank Apps | 53.91 | 9,408.85 | 0.00 | 0.00 | 0.43 | 19.30 | 54.33 | 9,428.15 |
| 16 | Mobikwik # | 48.14 | 6,010.88 | 0.00 | 0.00 | 0.00 | 0.00 | 48.14 | 6,010.88 |
| 17 | Pop Club # | 44.53 | 1,694.22 | 0.00 | 0.00 | 0.00 | 0.00 | 44.53 | 1,694.22 |
| 18 | Airtel Payments Bank Apps | 21.40 | 1,650.42 | 0.00 | 0.00 | 0.00 | 0.00 | 21.40 | 1,650.42 |
| 19 | Slice Small Finance Bank Apps | 20.75 | 2,716.14 | 0.00 | 0.00 | 0.00 | 0.01 | 20.75 | 2,716.15 |
| 20 | India Post Payments Bank Apps | 19.58 | 1,892.61 | 0.00 | 0.00 | 0.00 | 0.00 | 19.58 | 1,892.61 |
| 21 | IDFC Bank Apps | 17.44 | 2,728.15 | 0.00 | 0.03 | 0.04 | 0.19 | 17.48 | 2,728.37 |
| 22 | Groww # | 13.01 | 9,001.87 | 0.00 | 0.00 | 0.00 | 0.00 | 13.01 | 9,001.87 |
| 23 | State Bank of India Apps | 12.99 | 3,668.47 | 0.00 | 0.00 | 0.00 | 0.00 | 12.99 | 3,668.47 |
| 24 | Bajaj Finserv | 11.63 | 2,456.88 | 0.00 | 0.00 | 0.00 | 0.00 | 11.63 | 2,456.88 |
| 25 | Samsung Pay # | 9.90 | 682.42 | 0.00 | 0.00 | 0.00 | 0.00 | 9.90 | 682.42 |
| 26 | RBL Bank Apps | 9.15 | 1,423.59 | 0.00 | 0.00 | 0.14 | 33.26 | 9.29 | 1,456.85 |
| 27 | Federal Bank Apps | 6.55 | 1,295.01 | 0.00 | 0.00 | 0.00 | 0.00 | 6.55 | 1,295.01 |
| 28 | Jupiter Money # | 6.49 | 998.01 | 0.00 | 0.00 | 0.00 | 0.00 | 6.49 | 998.01 |
| 29 | Bharat Pe # | 4.69 | 233.82 | 0.00 | 0.00 | 0.00 | 0.00 | 4.69 | 233.82 |
| 30 | Jio Payments Bank Apps | 4.65 | 319.72 | 0.00 | 0.00 | 0.00 | 0.00 | 4.65 | 319.72 |
| 31 | Canara Bank Apps | 4.27 | 1,028.07 | 0.00 | 0.00 | 0.00 | 0.00 | 4.27 | 1,028.07 |
| 32 | Deutsche Bank Apps | 4.23 | 774.07 | 0.00 | 0.00 | 0.00 | 0.13 | 4.24 | 774.19 |
| 33 | Punjab National Bank Apps | 3.79 | 964.86 | 0.00 | 0.00 | 0.00 | 0.00 | 3.79 | 964.86 |
| 34 | NSDL Payments Bank Apps | 3.46 | 191.44 | 0.00 | 0.00 | 0.13 | 7.30 | 3.59 | 198.74 |
| 35 | Flipkart UPI # | 3.46 | 194.88 | 0.00 | 0.00 | 0.00 | 0.00 | 3.46 | 194.88 |
| 36 | Timepay # | 2.98 | 43.77 | 0.00 | 0.00 | 0.00 | 0.00 | 2.98 | 43.77 |
| 37 | Fi Money # | 2.77 | 391.19 | 0.00 | 0.00 | 0.00 | 0.00 | 2.77 | 391.19 |
| 38 | Kiwi # | 2.69 | 305.39 | 0.00 | 0.00 | 0.00 | 0.00 | 2.69 | 305.39 |
| 39 | Shri Ram One | 2.61 | 159.27 | 0.00 | 0.00 | 0.00 | 0.00 | 2.61 | 159.27 |
| 40 | Jammu and Kashmir Bank Apps | 2.47 | 334.59 | 0.00 | 0.00 | 0.00 | 0.00 | 2.47 | 334.59 |
| 41 | Bank of Baroda Apps | 2.39 | 508.85 | 0.00 | 0.00 | 0.00 | 0.00 | 2.39 | 508.85 |
| 42 | Ind Money # | 2.15 | 758.73 | 0.00 | 0.00 | 0.00 | 0.00 | 2.15 | 758.73 |
| 43 | IndusInd Bank Apps | 1.91 | 238.35 | 0.00 | 0.00 | 0.00 | 0.00 | 1.91 | 238.35 |
| 44 | Omni Card | 1.82 | 113.40 | 0.00 | 0.00 | 0.00 | 0.00 | 1.82 | 113.40 |
| 45 | Suryoday Bank Apps | 1.46 | 111.08 | 0.00 | 0.00 | 0.01 | 0.86 | 1.46 | 111.94 |
| 46 | Indian Bank Apps | 1.26 | 281.53 | 0.00 | 0.00 | 0.00 | 0.00 | 1.26 | 281.53 |
| 47 | HSBC Bank Apps | 1.20 | 150.84 | 0.01 | 0.31 | 0.00 | 0.41 | 1.21 | 151.55 |
| 48 | Digikhata | 1.10 | 365.04 | 0.00 | 0.00 | 0.00 | 0.00 | 1.10 | 365.04 |
| 49 | Money View # | 1.03 | 74.94 | 0.00 | 0.00 | 0.00 | 0.00 | 1.03 | 74.94 |
| 50 | South Indian Bank Apps | 0.90 | 248.87 | 0.00 | 0.00 | 0.00 | 0.00 | 0.90 | 248.87 |
| 51 | Union Bank Apps | 0.84 | 259.85 | 0.00 | 0.00 | 0.00 | 0.00 | 0.84 | 259.85 |
| 52 | One Card | 0.76 | 884.64 | 0.00 | 0.00 | 0.00 | 0.00 | 0.76 | 884.64 |
| 53 | DBS Digibank Apps | 0.75 | 252.09 | 0.00 | 0.00 | 0.00 | 0.20 | 0.75 | 252.29 |
| 54 | Kredit Pe # | 0.71 | 60.21 | 0.00 | 0.00 | 0.00 | 0.00 | 0.71 | 60.21 |
| 55 | Central Bank of India Apps | 0.71 | 161.42 | 0.00 | 0.00 | 0.00 | 0.00 | 0.71 | 161.42 |
| 56 | Fino Payments Bank Apps | 0.69 | 68.05 | 0.00 | 0.00 | 0.00 | 0.00 | 0.69 | 68.05 |
| 57 | AU Small Finance Bank Apps | 0.68 | 208.06 | 0.00 | 0.00 | 0.00 | 0.00 | 0.68 | 208.06 |
| 58 | ESAF Small Finance Bank Apps | 0.59 | 63.66 | 0.00 | 0.00 | 0.00 | 0.00 | 0.59 | 63.66 |
| 59 | UCO Bank Apps | 0.53 | 130.16 | 0.00 | 0.00 | 0.00 | 0.00 | 0.53 | 130.16 |
| 60 | Salary Se # | 0.53 | 24.31 | 0.00 | 0.00 | 0.00 | 0.00 | 0.53 | 24.31 |
| 61 | Tata Pay # | 0.52 | 155.47 | 0.00 | 0.00 | 0.00 | 0.00 | 0.52 | 155.47 |
| 62 | Aditya Birla Capital Digital | 0.42 | 28.13 | 0.00 | 0.00 | 0.00 | 0.00 | 0.42 | 28.13 |
| 63 | Bank of India Apps | 0.30 | 93.60 | 0.00 | 0.00 | 0.00 | 0.00 | 0.30 | 93.60 |
| 64 | Spice Money | 0.30 | 26.10 | 0.00 | 0.00 | 0.00 | 0.00 | 0.30 | 26.10 |
| 65 | Karnataka Bank Apps | 0.27 | 60.70 | 0.00 | 0.00 | 0.00 | 0.01 | 0.27 | 60.71 |
| 66 | Indian Overseas Bank Apps | 0.26 | 64.38 | 0.00 | 0.00 | 0.00 | 0.00 | 0.26 | 64.38 |
| 67 | Standard Chartered Bank Apps | 0.26 | 123.17 | 0.00 | 0.00 | 0.00 | 0.16 | 0.26 | 123.33 |
| 68 | Rapipay | 0.24 | 25.00 | 0.00 | 0.00 | 0.00 | 0.00 | 0.24 | 25.00 |
| 69 | Dhani | 0.22 | 9.85 | 0.00 | 0.00 | 0.00 | 0.00 | 0.22 | 9.85 |
| 70 | IDBI Bank Apps | 0.17 | 67.08 | 0.00 | 0.00 | 0.00 | 0.00 | 0.17 | 67.08 |
| 71 | True Balance | 0.15 | 4.90 | 0.00 | 0.00 | 0.00 | 0.00 | 0.15 | 4.90 |
| 72 | OBOPAY | 0.11 | 16.77 | 0.00 | 0.00 | 0.00 | 0.00 | 0.11 | 16.77 |
| 73 | Karur Vysya Bank Apps | 0.11 | 38.33 | 0.00 | 0.00 | 0.00 | 0.00 | 0.11 | 38.33 |
| 74 | Ultracash # | 0.10 | 7.48 | 0.00 | 0.00 | 0.00 | 0.00 | 0.10 | 7.48 |
| 75 | Tamilnad Mercantile Bank Apps | 0.10 | 33.36 | 0.00 | 0.00 | 0.00 | 0.00 | 0.10 | 33.36 |
| 76 | Niyo Global # | 0.09 | 22.11 | 0.00 | 0.00 | 0.00 | 0.00 | 0.09 | 22.11 |
| 77 | City Union Bank Apps | 0.07 | 28.22 | 0.00 | 0.00 | 0.00 | 0.00 | 0.07 | 28.22 |
| 78 | Unity Small Finance Bank Apps | 0.07 | 19.76 | 0.00 | 0.00 | 0.00 | 0.00 | 0.07 | 19.76 |
| 79 | Payworld | 0.04 | 4.00 | 0.00 | 0.00 | 0.00 | 0.00 | 0.04 | 4.00 |
| 80 | JAR # | 0.04 | 1.14 | 0.00 | 0.00 | 0.00 | 0.00 | 0.04 | 1.14 |
| 81 | Freo # | 0.04 | 2.43 | 0.00 | 0.00 | 0.00 | 0.00 | 0.04 | 2.43 |
| 82 | Utkarsh Small Finance Bank Apps | 0.03 | 4.18 | 0.00 | 0.00 | 0.00 | 0.00 | 0.03 | 4.18 |
| 83 | Punjab Sind Bank Apps | 0.02 | 6.63 | 0.00 | 0.00 | 0.00 | 0.00 | 0.02 | 6.63 |
| 84 | Others | 2.24 | 266.66 | 0.00 | 0.00 | 0.16 | 6.35 | 2.41 | 273.01 |
Note:-
| UPI P2P and P2M Transactions | ||||||
|---|---|---|---|---|---|---|
| Month | Total | P2P | P2M | |||
| Volume (Mn) | Value (Cr) | Volume (Mn) | Value (Cr) | Volume (Mn) | Value (Cr) | |
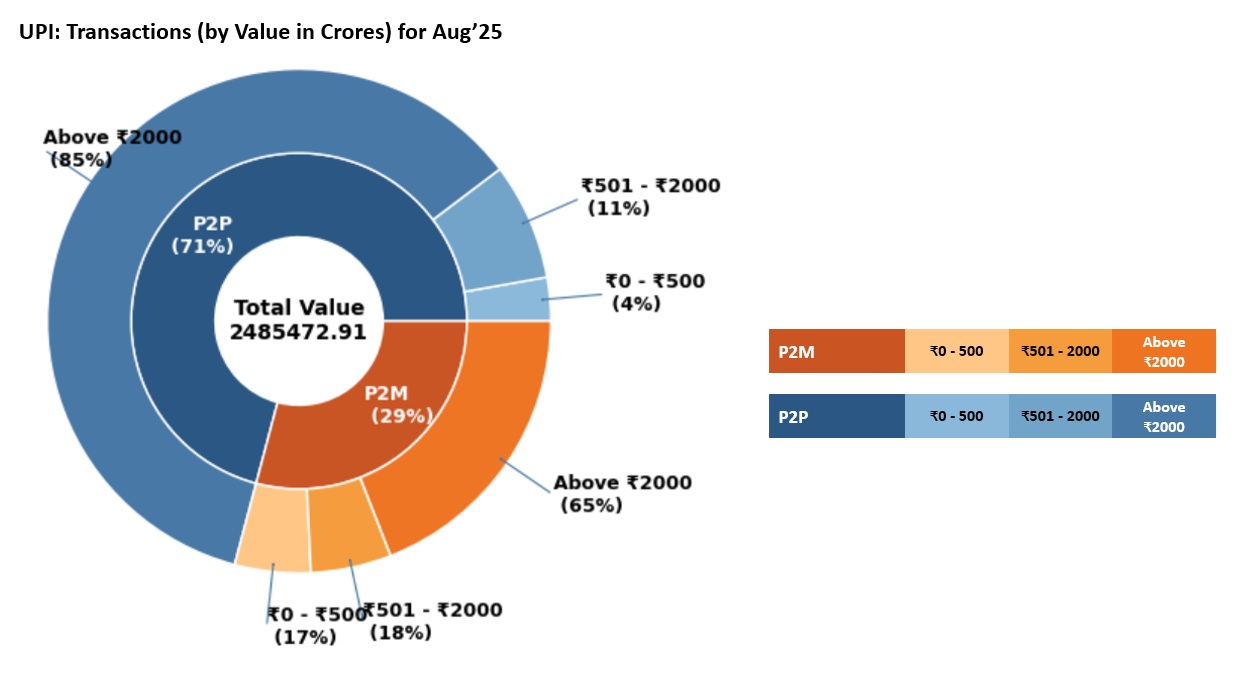
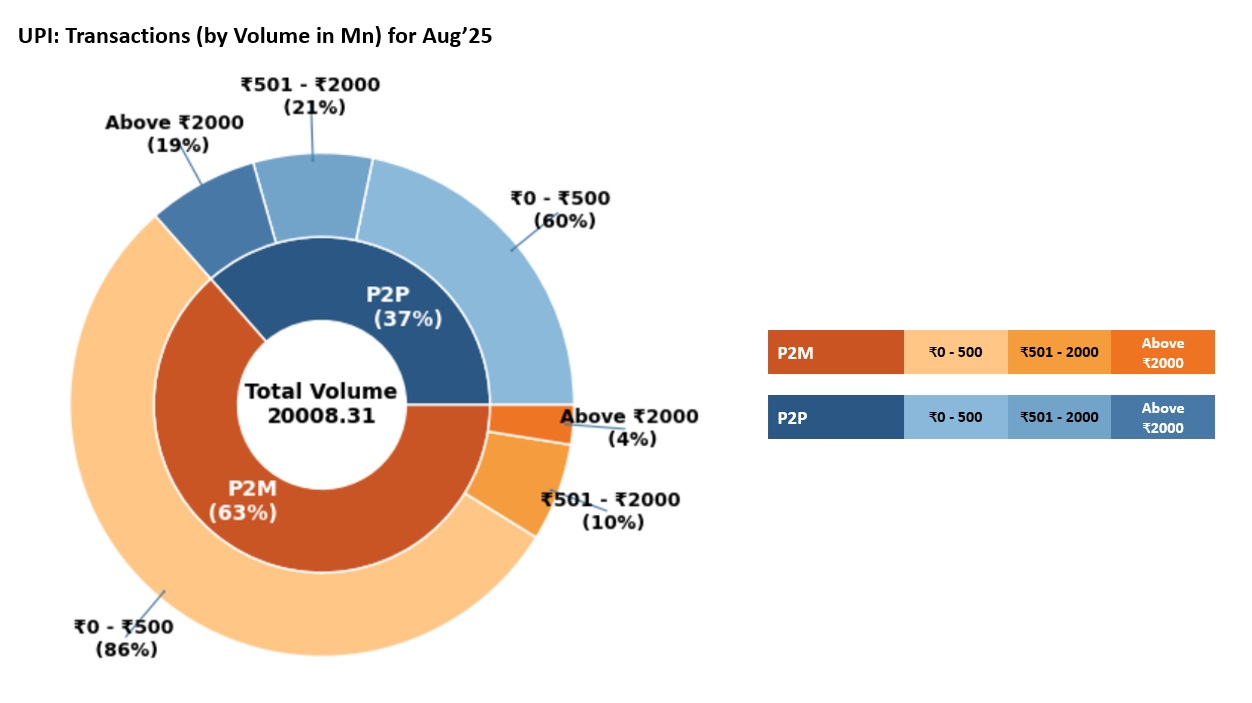
| Aug-25 | 20,008.31 | 24,85,472.91 | 7,303.15 | 17,61,675.49 | 12,705.16 | 7,23,797.42 |
| UPI Payer PSP Performance (Aug'25) | |||||
|---|---|---|---|---|---|
| Sr. No. | Payer PSP | Total Volume (In Mn) | Approved % | BD % | TD % |
| 1 | Axis Bank Ltd. | 7,903.10 | 93.60% | 6.27% | 0.13% |
| 2 | Yes Bank Ltd. | 5,841.35 | 90.97% | 8.94% | 0.10% |
| 3 | ICICI Bank Ltd. | 3,880.13 | 92.61% | 7.27% | 0.12% |
| 4 | HDFC Bank Ltd. | 1,957.30 | 94.28% | 5.64% | 0.08% |
| 5 | State Bank of India | 1,433.43 | 94.47% | 5.36% | 0.16% |
| 6 | Tri O Tech Solutions Private Limited | 134.92 | 100.00% | 0.00% | 0.00% |
| 7 | BHIM | 113.93 | 95.28% | 4.54% | 0.18% |
| 8 | Kotak Mahindra Bank | 72.36 | 100.00% | 0.00% | 0.00% |
| 9 | Airtel Payments Bank Limited | 22.27 | 96.30% | 3.62% | 0.07% |
| 10 | North East Small Finance Bank Ltd | 21.53 | 96.80% | 3.14% | 0.06% |
| 11 | India Post Payments Bank Limited | 19.58 | 100.00% | 0.00% | 0.00% |
| 12 | One Mobikwik Systems Limited | 18.65 | 100.00% | 0.00% | 0.00% |
| 13 | IDFC Bank Ltd. | 18.71 | 99.81% | 0.19% | 0.00% |
| 14 | RBL Bank Ltd. | 17.71 | 98.02% | 1.91% | 0.07% |
| 15 | Federal Bank Ltd. | 9.54 | 99.02% | 0.96% | 0.02% |
| UPI Payee PSP Performance (Aug'25) | |||||
|---|---|---|---|---|---|
| Sr. No. | Payee PSP | Total Volume (In Mn) | Approved % | BD % | TD % |
| 1 | Yes Bank Ltd. | 10,751.55 | 91.47% | 8.41% | 0.12% |
| 2 | Axis Bank Ltd. | 3,903.49 | 94.33% | 5.56% | 0.12% |
| 3 | ICICI Bank Ltd. | 1,864.54 | 93.74% | 6.13% | 0.13% |
| 4 | State Bank of India | 1,467.24 | 95.02% | 4.87% | 0.12% |
| 5 | HDFC Bank Ltd. | 1,408.32 | 94.06% | 5.84% | 0.11% |
| 6 | Federal Bank Ltd. | 288.22 | 96.95% | 2.94% | 0.11% |
| 7 | Airtel Payments Bank Limited | 230.49 | 94.28% | 5.61% | 0.11% |
| 8 | Unity Small Finance Bank Limited | 145.32 | 97.01% | 2.88% | 0.11% |
| 9 | Indusind Bank Ltd. | 139.32 | 93.52% | 6.37% | 0.12% |
| 10 | RBL Bank Ltd. | 98.99 | 91.99% | 7.86% | 0.14% |
| 11 | Canara Bank | 98.14 | 97.03% | 2.88% | 0.10% |
| 12 | Kotak Mahindra Bank | 80.84 | 95.00% | 4.89% | 0.11% |
| 13 | Tri O Tech Solutions Private Limited | 64.78 | 93.98% | 5.90% | 0.12% |
| 14 | One Mobikwik Systems Limited | 57.36 | 96.58% | 3.32% | 0.10% |
| 15 | Suryoday Small Finance Bank Limited | 54.93 | 91.56% | 8.31% | 0.13% |
| UPI Merchant Category-wise Classification - August'25 (Arranged by Volume) | ||||
|---|---|---|---|---|
| Type | MCC | Description | Volume (in Mn) | Value (in Cr.) |
| High Transacting Categories | 5411 | Groceries And Supermarkets | 3,129.40 | 68,115.89 |
| 5814 | Fast Food Restaurants | 1,263.07 | 14,542.00 | |
| 5812 | Eating Places And Restaurants | 1,182.83 | 19,432.25 | |
| 4814 | Telecommunication Services, Including Local And Long Distance Calls, Credit Card Calls,Callsthrough Use Of Magnetic Stripe Reading Telephones And Faxes | 865.65 | 21,218.15 | |
| 5541 | Service Stations (With Or Without Ancillary Services) | 626.95 | 34,546.82 | |
| 5993 | Cigar Shops And Stands | 330.07 | 1,946.50 | |
| 5912 | Drug Stores And Pharmacies | 322.46 | 12,580.60 | |
| 5462 | Bakeries | 271.22 | 4,092.27 | |
| 5816 | Digital Goods: Games | 270.70 | 7,441.14 | |
| 5451 | Dairies | 179.10 | 4,532.91 | |
| Medium Transacting Categories | 4900 | Utilities Electric, Gas, Water And Sanitary | 170.91 | 22,368.15 |
| 7322 | Debt Collection Agencies | 151.49 | 77,007.05 | |
| 5921 | Package Shops Beer, Wine And Liquor | 149.20 | 6,116.17 | |
| 5262 | Online Marketplaces | 122.60 | 7,821.54 | |
| 5441 | Candy, Nut And Confectionery Shops | 115.11 | 2,227.20 | |
| 9399 | Government Services Not Elsewhere Classified | 107.75 | 10,589.67 | |
| 5422 | Freezer And Locker Meat Provisioners | 102.15 | 3,207.17 | |
| 5691 | Mens And Womens Clothing Shops | 101.85 | 11,811.01 | |
| 5412 | Purchase Of Digital Gold | 99.77 | 1,183.73 | |
| 5732 | Electronics Shops | 93.34 | 10,208.97 | |
| All Other Categories | 5813 | Drinking Places (Alcoholic Beverages) Bars, Taverns, Night-Clubs, Cocktail Lounges And Discothques | 88.17 | 3,413.72 |
| 7230 | Beauty And Barber Shops | 81.72 | 2,316.82 | |
| 4112 | Passenger Railways | 80.93 | 4,142.51 | |
| 7622 | Electronics Repair Shops | 78.02 | 2,202.89 | |
| 5137 | Mens, Womens And Childrens Uniforms And Commercial Clothing | 75.87 | 7,087.98 | |
| 5311 | Department Stores | 69.99 | 4,143.22 | |
| 4121 | Taxi-Cabs And Limousines | 69.96 | 1,204.41 | |
| 5331 | Variety Stores | 67.18 | 3,392.94 | |
| 6211 | Securities Brokers And Dealers | 57.81 | 45,687.06 | |
| Others | 2,379.89 | 3,09,216.68 | ||
| Total | 12,705.16 | 7,23,797.42 | ||
| State-wise UPI Product Statistics* (August'25) | |||||
|---|---|---|---|---|---|
| Sr. No. | State / Union Territory | Volume (in Mn ) | Volume Contribution (%) | Value (in Cr.) | Value Contribution (%) |
| 1 | MAHARASHTRA | 1,985.58 | 9.92% | 2,32,558.18 | 9.36% |
| 2 | KARNATAKA | 1,077.76 | 5.39% | 1,42,488.77 | 5.73% |
| 3 | UTTAR PRADESH | 1,059.40 | 5.29% | 1,31,586.50 | 5.29% |
| 4 | TELANGANA | 803.98 | 4.02% | 1,22,333.79 | 4.92% |
| 5 | TAMIL NADU | 799.24 | 3.99% | 1,18,149.83 | 4.75% |
| 6 | ANDHRA PRADESH | 551.48 | 2.76% | 92,181.84 | 3.71% |
| 7 | RAJASTHAN | 541.39 | 2.71% | 74,949.80 | 3.02% |
| 8 | GUJARAT | 515.15 | 2.57% | 73,518.28 | 2.96% |
| 9 | DELHI | 487.28 | 2.44% | 59,774.16 | 2.40% |
| 10 | WEST BENGAL | 436.15 | 2.18% | 62,202.65 | 2.50% |
| 11 | MADHYA PRADESH | 436.10 | 2.18% | 55,552.05 | 2.24% |
| 12 | HARYANA | 401.30 | 2.01% | 53,984.25 | 2.17% |
| 13 | KERALA | 399.48 | 2.00% | 56,071.45 | 2.26% |
| 14 | BIHAR | 399.25 | 2.00% | 55,622.06 | 2.24% |
| 15 | ODISHA | 277.85 | 1.39% | 34,040.30 | 1.37% |
| 16 | PUNJAB | 211.76 | 1.06% | 33,563.64 | 1.35% |
| 17 | ASSAM | 203.78 | 1.02% | 21,464.88 | 0.86% |
| 18 | JHARKHAND | 171.24 | 0.86% | 21,569.36 | 0.87% |
| 19 | CHHATTISGARH | 134.57 | 0.67% | 16,358.88 | 0.66% |
| 20 | UTTARAKHAND | 108.74 | 0.54% | 12,976.53 | 0.52% |
| 21 | JAMMU AND KASHMIR | 81.02 | 0.40% | 10,254.43 | 0.41% |
| 22 | HIMACHAL PRADESH | 54.88 | 0.27% | 6,738.67 | 0.27% |
| 23 | GOA | 32.27 | 0.16% | 4,537.72 | 0.18% |
| 24 | CHANDIGARH | 26.58 | 0.13% | 3,188.55 | 0.13% |
| 25 | ARUNACHAL PRADESH | 21.40 | 0.11% | 2,707.20 | 0.11% |
| 26 | PUDUCHERRY | 18.83 | 0.09% | 2,548.23 | 0.10% |
| 27 | MEGHALAYA | 15.91 | 0.08% | 2,008.23 | 0.08% |
| 28 | MANIPUR | 14.85 | 0.07% | 2,861.63 | 0.12% |
| 29 | TRIPURA | 14.59 | 0.07% | 1,874.19 | 0.08% |
| 30 | NAGALAND | 12.24 | 0.06% | 1,752.82 | 0.07% |
| 31 | MIZORAM | 11.86 | 0.06% | 1,704.97 | 0.07% |
| 32 | DADRA & NAGAR HAVELI & DAMAN & DIU | 10.82 | 0.05% | 1,112.70 | 0.04% |
| 33 | SIKKIM | 8.11 | 0.04% | 988.11 | 0.04% |
| 34 | LADAKH | 4.48 | 0.02% | 781.31 | 0.03% |
| 35 | ANDAMAN & NICOBAR | 3.77 | 0.02% | 551.26 | 0.02% |
| 36 | LAKSHADWEEP | 0.56 | 0.00% | 55.68 | 0.00% |
| 37 | Unclassified# | 8,674.66 | 43.36% | 9,70,860.01 | 39.06% |
| UPI Remitter Members - Top 50 Members (Jul'25) | |||||||
|---|---|---|---|---|---|---|---|
| Sr. No. | UPI Remitter Members (Jul-2025) | Total Volume (In Mn) | Approved % | BD % | TD% | Total Debit Reversal Count (In Mn) | Debit Reversal Success % |
| 1 | State Bank of India | 5,214.74 | 93.22% | 6.17% | 0.61% | 17.16 | 63.71% |
| 2 | HDFC Bank Ltd. | 1,543.98 | 95.16% | 4.76% | 0.08% | 0.44 | 99.92% |
| 3 | Bank of Baroda | 1,328.01 | 90.70% | 9.08% | 0.22% | 3.73 | 97.68% |
| 4 | Union Bank of India | 1,200.25 | 92.81% | 6.98% | 0.20% | 3.44 | 85.93% |
| 5 | Punjab National Bank | 1,106.80 | 91.41% | 8.39% | 0.19% | 3.55 | 98.66% |
| 6 | Kotak Mahindra Bank | 960.38 | 92.29% | 7.69% | 0.02% | 2.18 | 97.86% |
| 7 | Canara Bank | 942.67 | 92.65% | 7.11% | 0.24% | 2.84 | 82.15% |
| 8 | Axis Bank Ltd. | 875.50 | 94.64% | 5.33% | 0.04% | 1.80 | 97.82% |
| 9 | ICICI Bank Ltd. | 735.99 | 96.08% | 3.89% | 0.02% | 1.33 | 97.72% |
| 10 | India Post Payments Bank Limited | 637.61 | 88.72% | 11.16% | 0.12% | 2.33 | 99.38% |
| 11 | Indian Bank | 631.57 | 92.54% | 7.21% | 0.25% | 1.67 | 87.13% |
| 12 | Airtel Payments Bank Limited | 615.75 | 85.84% | 14.06% | 0.11% | 2.35 | 98.21% |
| 13 | Bank Of India | 606.19 | 91.22% | 6.34% | 2.44% | 3.87 | 54.97% |
| 14 | Indian Overseas Bank | 322.83 | 91.31% | 7.92% | 0.76% | 1.96 | 58.10% |
| 15 | Central Bank of India | 292.20 | 91.16% | 8.03% | 0.81% | 1.41 | 78.47% |
| 16 | UCO Bank | 273.67 | 91.41% | 8.42% | 0.18% | 0.91 | 88.54% |
| 17 | Federal Bank Ltd. | 257.37 | 93.18% | 6.71% | 0.11% | 0.55 | 97.09% |
| 18 | Fino Payments Bank Ltd. | 223.00 | 86.83% | 12.53% | 0.64% | 0.93 | 90.45% |
| 19 | Bank of Maharashtra | 213.67 | 93.27% | 6.60% | 0.13% | 0.56 | 92.76% |
| 20 | Indusind Bank Ltd. | 211.20 | 89.96% | 9.93% | 0.10% | 0.72 | 80.64% |
| 21 | IDBI Bank Ltd. | 204.29 | 93.45% | 6.33% | 0.22% | 0.67 | 88.00% |
| 22 | Yes Bank Ltd. | 203.24 | 92.22% | 7.68% | 0.11% | 0.29 | 86.92% |
| 23 | Karnataka Bank | 140.62 | 92.18% | 7.41% | 0.41% | 0.40 | 75.69% |
| 24 | Tri O Tech Solutions Private Limited | 124.55 | 100.00% | 0.00% | 0.00% | - | 0.00% |
| 25 | IDFC Bank Ltd. | 118.94 | 93.26% | 6.55% | 0.18% | 0.32 | 83.18% |
| 26 | The Jammu & Kashmir Bank Limited | 106.40 | 88.64% | 5.56% | 5.79% | 2.28 | 11.94% |
| 27 | Karur Vysya Bank | 95.01 | 92.55% | 6.64% | 0.81% | 0.39 | 65.16% |
| 28 | Bandhan Bank limited | 90.18 | 93.92% | 5.41% | 0.67% | 0.39 | 82.42% |
| 29 | AU Small Finance Bank | 77.71 | 89.21% | 10.11% | 0.68% | 0.34 | 70.50% |
| 30 | The South Indian Bank Limited | 72.87 | 94.68% | 5.08% | 0.24% | 0.15 | 99.26% |
| 31 | JIO Payments Bank Ltd | 58.03 | 86.07% | 12.54% | 1.39% | 0.53 | 84.05% |
| 32 | Punjab and Sind Bank | 57.19 | 90.96% | 8.17% | 0.87% | 0.33 | 76.20% |
| 33 | City Union Bank | 56.65 | 92.30% | 7.56% | 0.14% | 0.13 | 99.87% |
| 34 | Tamilnad Mercantile Bank Limited | 55.91 | 91.44% | 7.29% | 1.27% | 0.24 | 67.84% |
| 35 | Ujjivan Small Finance Bank Limited | 54.99 | 89.92% | 8.92% | 1.16% | 0.19 | 80.13% |
| 36 | Baroda U.P. Bank | 48.24 | 92.71% | 5.61% | 1.68% | 0.32 | 56.53% |
| 37 | Kerala Gramin Bank | 46.93 | 91.33% | 7.04% | 1.64% | 0.42 | 85.31% |
| 38 | NSDL Payments Bank Limited | 45.70 | 84.88% | 14.23% | 0.89% | 0.30 | 74.60% |
| 39 | Telangana Grameena Bank | 40.36 | 88.11% | 10.35% | 1.54% | 0.38 | 56.78% |
| 40 | Maharashtra Gramin Bank | 37.37 | 84.63% | 13.82% | 1.56% | 0.20 | 62.99% |
| 41 | Rajasthan Marudhara Gramin Bank | 36.15 | 85.28% | 12.34% | 2.38% | 0.32 | 40.95% |
| 42 | Karnataka Gramin Bank | 34.96 | 89.09% | 10.03% | 0.88% | 0.19 | 91.19% |
| 43 | ESAF Small Finance Bank Ltd | 33.38 | 95.70% | 4.26% | 0.04% | 0.09 | 97.84% |
| 44 | Andhra Pragathi Grameena Bank | 31.91 | 82.27% | 13.96% | 3.78% | 0.28 | 32.42% |
| 45 | DBS Bank India Limited | 31.81 | 93.09% | 6.76% | 0.15% | 0.08 | 95.78% |
| 46 | RBL Bank Ltd. | 31.22 | 92.43% | 7.09% | 0.48% | 0.10 | 79.93% |
| 47 | Equitas Small Finance Bank | 30.07 | 91.14% | 8.86% | 0.01% | 0.08 | 99.28% |
| 48 | Saraswat Co-operative Bank | 29.63 | 94.75% | 5.11% | 0.15% | 0.06 | 96.44% |
| 49 | Sarva Haryana Gramin Bank | 26.28 | 94.29% | 4.70% | 1.01% | 0.18 | 57.32% |
| 50 | Standard Chartered Bank | 23.69 | 95.49% | 4.22% | 0.30% | 0.06 | 69.11% |
| UPI Beneficiary Members - Top 50 Members (Jul'25) | |||||||
|---|---|---|---|---|---|---|---|
| Sr.No. | UPI Beneficiary Members (Jul-2025) | Total Volume (In Mn) | Approved % | BD% | TD% | Deemed Approved % | |
| 1 | Yes Bank Ltd. | 7,934.54 | 99.99% | 0.01% | 0.00% | 0.00% | |
| 2 | State Bank of India | 1,965.84 | 99.51% | 0.10% | 0.39% | 0.10% | |
| 3 | Axis Bank Ltd. | 1,946.32 | 99.74% | 0.25% | 0.02% | 0.01% | |
| 4 | HDFC Bank Ltd. | 992.01 | 99.48% | 0.45% | 0.07% | 0.02% | |
| 5 | ICICI Bank Ltd. | 610.63 | 99.65% | 0.29% | 0.06% | 0.02% | |
| 6 | Bank of Baroda | 508.22 | 99.43% | 0.29% | 0.28% | 0.10% | |
| 7 | Union Bank of India | 459.07 | 99.76% | 0.10% | 0.14% | 0.07% | |
| 8 | Airtel Payments Bank Limited | 457.82 | 98.80% | 1.02% | 0.18% | 0.03% | |
| 9 | Canara Bank | 438.17 | 99.58% | 0.12% | 0.30% | 0.10% | |
| 10 | Punjab National Bank | 436.07 | 99.12% | 0.71% | 0.16% | 0.18% | |
| 11 | Federal Bank Ltd. | 369.84 | 99.75% | 0.22% | 0.02% | 0.00% | |
| 12 | Kotak Mahindra Bank | 361.38 | 98.87% | 1.07% | 0.06% | 0.04% | |
| 13 | Indian Bank | 284.60 | 99.33% | 0.24% | 0.43% | 0.04% | |
| 14 | India Post Payments Bank Limited | 282.13 | 98.74% | 1.13% | 0.13% | 0.06% | |
| 15 | Bank Of India | 258.79 | 97.07% | 0.79% | 2.15% | 0.37% | |
| 16 | Indusind Bank Ltd. | 179.93 | 99.55% | 0.34% | 0.11% | 0.05% | |
| 17 | Indian Overseas Bank | 144.42 | 98.24% | 1.03% | 0.73% | 0.43% | |
| 18 | Central Bank of India | 132.56 | 98.84% | 0.64% | 0.52% | 0.19% | |
| 19 | UCO Bank | 115.41 | 99.48% | 0.34% | 0.18% | 0.03% | |
| 20 | Unity Small Finance Bank Limited | 113.19 | 99.97% | 0.00% | 0.03% | 0.01% | |
| 21 | Fino Payments Bank Ltd. | 101.01 | 98.25% | 1.27% | 0.48% | 0.02% | |
| 22 | RBL Bank Ltd. | 91.97 | 99.73% | 0.07% | 0.21% | 0.09% | |
| 23 | IDBI Bank Ltd. | 87.99 | 99.50% | 0.34% | 0.16% | 0.08% | |
| 24 | Bank of Maharashtra | 82.78 | 99.58% | 0.23% | 0.19% | 0.04% | |
| 25 | Karnataka Bank | 62.40 | 98.95% | 0.27% | 0.79% | 0.10% | |
| 26 | Tri O Tech Solutions Private Limited | 57.30 | 98.57% | 1.05% | 0.38% | 0.19% | |
| 27 | The Jammu & Kashmir Bank Limited | 56.50 | 97.55% | 0.42% | 2.03% | 1.41% | |
| 28 | NSDL Payments Bank Limited | 55.10 | 99.00% | 0.75% | 0.25% | 0.07% | |
| 29 | One Mobikwik Systems Limited | 53.86 | 99.92% | 0.00% | 0.08% | 0.00% | |
| 30 | IDFC Bank Ltd. | 52.03 | 99.01% | 0.80% | 0.19% | 0.05% | |
| 31 | Bandhan Bank limited | 51.16 | 98.54% | 0.38% | 1.08% | 0.12% | |
| 32 | Karur Vysya Bank | 45.38 | 99.06% | 0.26% | 0.68% | 0.14% | |
| 33 | JIO Payments Bank Ltd | 45.16 | 98.36% | 0.98% | 0.66% | 0.27% | |
| 34 | The South Indian Bank Limited | 44.96 | 99.79% | 0.12% | 0.10% | 0.01% | |
| 35 | Tamilnad Mercantile Bank Limited | 37.23 | 98.19% | 0.63% | 1.18% | 0.13% | |
| 36 | Suryoday Small Finance Bank Limited | 34.90 | 98.70% | 0.72% | 0.58% | 0.24% | |
| 37 | AU Small Finance Bank | 34.22 | 98.93% | 0.47% | 0.59% | 0.09% | |
| 38 | City Union Bank | 31.46 | 99.45% | 0.39% | 0.16% | 0.01% | |
| 39 | Kerala Gramin Bank | 28.55 | 98.75% | 0.40% | 0.85% | 0.64% | |
| 40 | Ujjivan Small Finance Bank Limited | 26.06 | 98.89% | 0.29% | 0.81% | 0.25% | |
| 41 | Punjab and Sind Bank | 25.51 | 97.97% | 1.12% | 0.91% | 0.18% | |
| 42 | Baroda U.P. Bank | 22.44 | 98.60% | 0.24% | 1.16% | 0.27% | |
| 43 | Citi Bank | 21.97 | 99.75% | 0.21% | 0.03% | 0.03% | |
| 44 | Telangana Grameena Bank | 17.85 | 99.09% | 0.33% | 0.58% | 0.13% | |
| 45 | Karnataka Gramin Bank | 16.21 | 99.15% | 0.36% | 0.49% | 0.28% | |
| 46 | Maharashtra Gramin Bank | 15.56 | 97.51% | 0.26% | 2.23% | 0.09% | |
| 47 | ESAF Small Finance Bank Ltd | 15.19 | 99.60% | 0.32% | 0.08% | 0.02% | |
| 48 | Equitas Small Finance Bank | 14.56 | 97.92% | 2.02% | 0.07% | 0.00% | |
| 49 | Andhra Pragathi Grameena Bank | 14.20 | 96.32% | 1.12% | 2.55% | 0.32% | |
| 50 | Rajasthan Marudhara Gramin Bank | 14.07 | 96.48% | 1.48% | 2.04% | 0.25% | |
| UPI Apps (Jul'25) | |||||||||
|---|---|---|---|---|---|---|---|---|---|
| Sr.No. | Application Name | Customer Initiated Transactions | B2C Transactions | B2B Transactions | Total | ||||
| Volume (Mn) | Value (Cr) | Volume (Mn) | Value (Cr) | Volume (Mn) | Value (Cr) | Volume (Mn) | Value (Cr) | ||
| 1 | Phone Pe # | 8,931.24 | 12,20,140.68 | 0.00 | 0.00 | 0.00 | 0.00 | 8,931.24 | 12,20,140.68 |
| 2 | Google Pay # | 6,922.92 | 8,91,297.38 | 0.00 | 0.00 | 0.00 | 0.00 | 6,922.92 | 8,91,297.38 |
| 3 | Paytm # | 1,366.05 | 1,43,650.62 | 0.00 | 0.00 | 0.00 | 0.00 | 1,366.05 | 1,43,650.62 |
| 4 | Navi # | 444.06 | 23,562.51 | 0.00 | 0.00 | 0.00 | 0.00 | 444.06 | 23,562.51 |
| 5 | super.money # | 252.85 | 9,018.71 | 0.00 | 0.00 | 0.00 | 0.00 | 252.85 | 9,018.71 |
| 6 | Cred # | 144.38 | 55,259.90 | 0.00 | 0.00 | 0.00 | 0.00 | 144.38 | 55,259.90 |
| 7 | FamApp by Trio # | 125.00 | 1,563.58 | 0.00 | 0.00 | 0.00 | 0.00 | 125.00 | 1,563.58 |
| 8 | Axis Bank Apps | 27.79 | 5,483.32 | 95.63 | 4,287.26 | 0.01 | 2.81 | 123.44 | 9,773.39 |
| 9 | Amazon Pay # | 100.53 | 10,813.98 | 0.00 | 0.00 | 0.00 | 0.00 | 100.53 | 10,813.98 |
| 10 | BHIM # | 87.13 | 14,522.39 | 0.00 | 0.00 | 0.00 | 0.00 | 87.13 | 14,522.39 |
| 11 | Whatsapp # | 74.60 | 5,412.58 | 0.00 | 0.00 | 0.00 | 0.00 | 74.60 | 5,412.58 |
| 12 | ICICI Bank Apps | 68.94 | 15,112.05 | 0.01 | 14.78 | 2.37 | 1,975.53 | 71.33 | 17,102.36 |
| 13 | Kotak Mahindra Bank Apps | 66.63 | 8,497.73 | 0.00 | 0.00 | 0.00 | 0.00 | 66.63 | 8,497.73 |
| 14 | HDFC Bank Apps | 49.83 | 15,420.10 | 15.13 | 9.63 | 0.01 | 0.87 | 64.97 | 15,430.59 |
| 15 | POPclub # | 63.63 | 1,539.48 | 0.00 | 0.00 | 0.00 | 0.00 | 63.63 | 1,539.48 |
| 16 | Yes Bank Apps | 55.20 | 9,470.16 | 0.00 | 0.00 | 0.40 | 21.45 | 55.60 | 9,491.62 |
| 17 | Mobikwik # | 43.17 | 5,578.43 | 0.00 | 0.00 | 0.00 | 0.00 | 43.17 | 5,578.43 |
| 18 | Airtel Payments Bank Apps | 21.34 | 1,509.17 | 0.00 | 0.01 | 0.00 | 0.00 | 21.34 | 1,509.17 |
| 19 | Slice Small Finance Bank Apps | 19.83 | 2,586.21 | 0.00 | 0.00 | 0.00 | 0.01 | 19.83 | 2,586.22 |
| 20 | India Post Payments Bank Apps | 18.16 | 1,759.02 | 0.00 | 0.00 | 0.00 | 0.00 | 18.16 | 1,759.02 |
| 21 | IDFC Bank Apps | 18.04 | 2,707.76 | 0.00 | 0.03 | 0.04 | 0.14 | 18.08 | 2,707.93 |
| 22 | Groww # | 14.06 | 11,012.81 | 0.00 | 0.00 | 0.00 | 0.00 | 14.06 | 11,012.81 |
| 23 | State Bank of India Apps | 12.26 | 3,633.07 | 0.00 | 0.00 | 0.00 | 0.00 | 12.26 | 3,633.07 |
| 24 | Bajaj Finserv | 10.87 | 2,516.08 | 0.00 | 0.00 | 0.00 | 0.00 | 10.87 | 2,516.08 |
| 25 | Samsung Pay # | 9.34 | 669.72 | 0.00 | 0.00 | 0.00 | 0.00 | 9.34 | 669.72 |
| 26 | RBL Bank Apps | 8.41 | 1,358.41 | 0.00 | 0.01 | 0.12 | 30.29 | 8.54 | 1,388.70 |
| 27 | Jupiter Money # | 6.30 | 981.50 | 0.00 | 0.00 | 0.00 | 0.00 | 6.30 | 981.50 |
| 28 | Federal Bank Apps | 5.86 | 1,163.18 | 0.00 | 0.00 | 0.00 | 0.00 | 5.86 | 1,163.18 |
| 29 | Jio Payments Bank Apps | 4.47 | 306.58 | 0.00 | 0.00 | 0.00 | 0.00 | 4.47 | 306.58 |
| 30 | Deutsche Bank Apps | 4.43 | 770.49 | 0.00 | 0.00 | 0.00 | 0.14 | 4.43 | 770.63 |
| 31 | Canara Bank Apps | 4.05 | 1,018.59 | 0.00 | 0.00 | 0.00 | 0.00 | 4.05 | 1,018.59 |
| 32 | Punjab National Bank Apps | 3.67 | 980.66 | 0.00 | 0.00 | 0.00 | 0.00 | 3.67 | 980.66 |
| 33 | Timepay # | 3.14 | 47.40 | 0.00 | 0.00 | 0.00 | 0.00 | 3.14 | 47.40 |
| 34 | Kiwi # | 2.85 | 323.87 | 0.00 | 0.00 | 0.00 | 0.00 | 2.85 | 323.87 |
| 35 | Fi Money # | 2.84 | 400.92 | 0.00 | 0.00 | 0.00 | 0.00 | 2.84 | 400.92 |
| 36 | NSDL Payments Bank Apps | 2.72 | 107.11 | 0.00 | 0.00 | 0.06 | 3.14 | 2.78 | 110.25 |
| 37 | Flipkart UPI # | 2.70 | 155.64 | 0.00 | 0.00 | 0.00 | 0.00 | 2.70 | 155.64 |
| 38 | Jammu and Kashmir Bank Apps | 2.62 | 343.24 | 0.00 | 0.00 | 0.00 | 0.00 | 2.62 | 343.24 |
| 39 | Shri Ram One | 2.38 | 155.72 | 0.00 | 0.00 | 0.00 | 0.00 | 2.38 | 155.72 |
| 40 | Bank of Baroda Apps | 2.01 | 529.28 | 0.00 | 0.00 | 0.00 | 0.01 | 2.01 | 529.28 |
| 41 | Ind Money # | 1.86 | 730.24 | 0.00 | 0.00 | 0.00 | 0.00 | 1.86 | 730.24 |
| 42 | Omni Card | 1.73 | 98.15 | 0.00 | 0.00 | 0.00 | 0.00 | 1.73 | 98.15 |
| 43 | IndusInd Bank Apps | 1.26 | 178.71 | 0.00 | 0.00 | 0.00 | 0.00 | 1.26 | 178.71 |
| 44 | Indian Bank Apps | 1.11 | 255.91 | 0.00 | 0.00 | 0.00 | 0.00 | 1.11 | 255.91 |
| 45 | HSBC Bank Apps | 1.08 | 134.67 | 0.01 | 0.41 | 0.00 | 0.44 | 1.09 | 135.52 |
| 46 | Suryoday Bank Apps | 1.05 | 150.41 | 0.00 | 0.00 | 0.01 | 1.42 | 1.06 | 151.82 |
| 47 | Digikhata | 1.01 | 320.50 | 0.00 | 0.00 | 0.00 | 0.00 | 1.01 | 320.50 |
| 48 | Standard Chartered Bank Apps | 0.91 | 147.75 | 0.00 | 0.00 | 0.08 | 3.06 | 0.99 | 150.81 |
| 49 | Bharat Pe # | 0.92 | 62.45 | 0.00 | 0.00 | 0.00 | 0.00 | 0.92 | 62.45 |
| 50 | DBS Digibank Apps | 0.88 | 221.94 | 0.00 | 0.00 | 0.00 | 0.54 | 0.88 | 222.49 |
| 51 | Central Bank of India Apps | 0.86 | 186.24 | 0.00 | 0.00 | 0.00 | 0.00 | 0.86 | 186.24 |
| 52 | South Indian Bank Apps | 0.83 | 240.25 | 0.00 | 0.00 | 0.00 | 0.00 | 0.83 | 240.25 |
| 53 | Union Bank Apps | 0.79 | 259.13 | 0.00 | 0.00 | 0.00 | 0.00 | 0.79 | 259.13 |
| 54 | One Card # | 0.78 | 918.16 | 0.00 | 0.00 | 0.00 | 0.00 | 0.78 | 918.16 |
| 55 | Money View # | 0.71 | 64.31 | 0.00 | 0.00 | 0.00 | 0.00 | 0.71 | 64.31 |
| 56 | AU Small Finance Bank Apps | 0.65 | 201.78 | 0.00 | 0.00 | 0.00 | 0.00 | 0.65 | 201.78 |
| 57 | Kredit Pe # | 0.60 | 54.67 | 0.00 | 0.00 | 0.00 | 0.00 | 0.60 | 54.67 |
| 58 | ESAF Small Finance Bank Apps | 0.59 | 64.58 | 0.00 | 0.00 | 0.00 | 0.00 | 0.59 | 64.58 |
| 59 | UCO Bank Apps | 0.57 | 140.44 | 0.00 | 0.00 | 0.00 | 0.00 | 0.57 | 140.44 |
| 60 | Fino Payments Bank Apps | 0.55 | 55.18 | 0.00 | 0.00 | 0.00 | 0.00 | 0.55 | 55.18 |
| 61 | Salary Se # | 0.50 | 22.32 | 0.00 | 0.00 | 0.00 | 0.00 | 0.50 | 22.32 |
| 62 | Tata Pay # | 0.49 | 144.20 | 0.00 | 0.00 | 0.00 | 0.00 | 0.49 | 144.20 |
| 63 | Aditya Birla Capital Digital | 0.39 | 23.14 | 0.00 | 0.00 | 0.00 | 0.00 | 0.39 | 23.14 |
| 64 | Bank of India Apps | 0.31 | 95.70 | 0.00 | 0.00 | 0.00 | 0.00 | 0.31 | 95.70 |
| 65 | Indian Overseas Bank Apps | 0.29 | 69.35 | 0.00 | 0.00 | 0.00 | 0.00 | 0.29 | 69.35 |
| 66 | Karnataka Bank Apps | 0.26 | 61.44 | 0.00 | 0.00 | 0.00 | 0.00 | 0.26 | 61.44 |
| 67 | Spice Money | 0.26 | 21.44 | 0.00 | 0.00 | 0.00 | 0.00 | 0.26 | 21.44 |
| 68 | Rapipay | 0.22 | 23.19 | 0.00 | 0.00 | 0.00 | 0.00 | 0.22 | 23.19 |
| 69 | Dhani | 0.20 | 8.73 | 0.00 | 0.00 | 0.00 | 0.00 | 0.20 | 8.73 |
| 70 | IDBI Bank Apps | 0.16 | 60.93 | 0.00 | 0.00 | 0.00 | 0.00 | 0.16 | 60.93 |
| 71 | True Balance | 0.13 | 4.22 | 0.00 | 0.00 | 0.00 | 0.00 | 0.13 | 4.22 |
| 72 | Ultracash # | 0.11 | 7.70 | 0.00 | 0.00 | 0.00 | 0.00 | 0.11 | 7.70 |
| 73 | Karur Vysya Bank Apps | 0.11 | 38.44 | 0.00 | 0.00 | 0.00 | 0.00 | 0.11 | 38.44 |
| 74 | Obopay | 0.11 | 15.31 | 0.00 | 0.00 | 0.00 | 0.00 | 0.11 | 15.31 |
| 75 | Tamilnad Mercantile Bank Apps | 0.10 | 33.72 | 0.00 | 0.00 | 0.00 | 0.00 | 0.10 | 33.72 |
| 76 | Niyo Global # | 0.08 | 20.06 | 0.00 | 0.00 | 0.00 | 0.00 | 0.08 | 20.06 |
| 77 | City Union Bank Apps | 0.07 | 27.83 | 0.00 | 0.00 | 0.00 | 0.00 | 0.07 | 27.83 |
| 78 | Unity Small Finance Bank Apps | 0.07 | 16.97 | 0.00 | 0.00 | 0.00 | 0.00 | 0.07 | 16.97 |
| 79 | Freo # | 0.04 | 2.57 | 0.00 | 0.00 | 0.00 | 0.00 | 0.04 | 2.57 |
| 80 | Payworld | 0.04 | 3.27 | 0.00 | 0.00 | 0.00 | 0.00 | 0.04 | 3.27 |
| 81 | Utkarsh Small Finance Bank Apps | 0.02 | 3.19 | 0.00 | 0.00 | 0.00 | 0.00 | 0.02 | 3.19 |
| 82 | Bank of Maharashtra Apps | 0.02 | 8.09 | 0.00 | 0.00 | 0.00 | 0.00 | 0.02 | 8.09 |
| 83 | Jar # | 0.02 | 0.50 | 0.00 | 0.00 | 0.00 | 0.00 | 0.02 | 0.50 |
| 84 | Punjab Sind Bank Apps | 0.02 | 7.28 | 0.00 | 0.00 | 0.00 | 0.00 | 0.02 | 7.28 |
| 85 | Others | 2.15 | 238.00 | 0.00 | 0.00 | 0.16 | 6.14 | 2.31 | 244.14 |
Note:-
| UPI P2P and P2M Transactions | ||||||
|---|---|---|---|---|---|---|
| Month | Total | P2P | P2M | |||
| Volume (Mn) | Value (Cr) | Volume (Mn) | Value (Cr) | Volume (Mn) | Value (Cr) | |
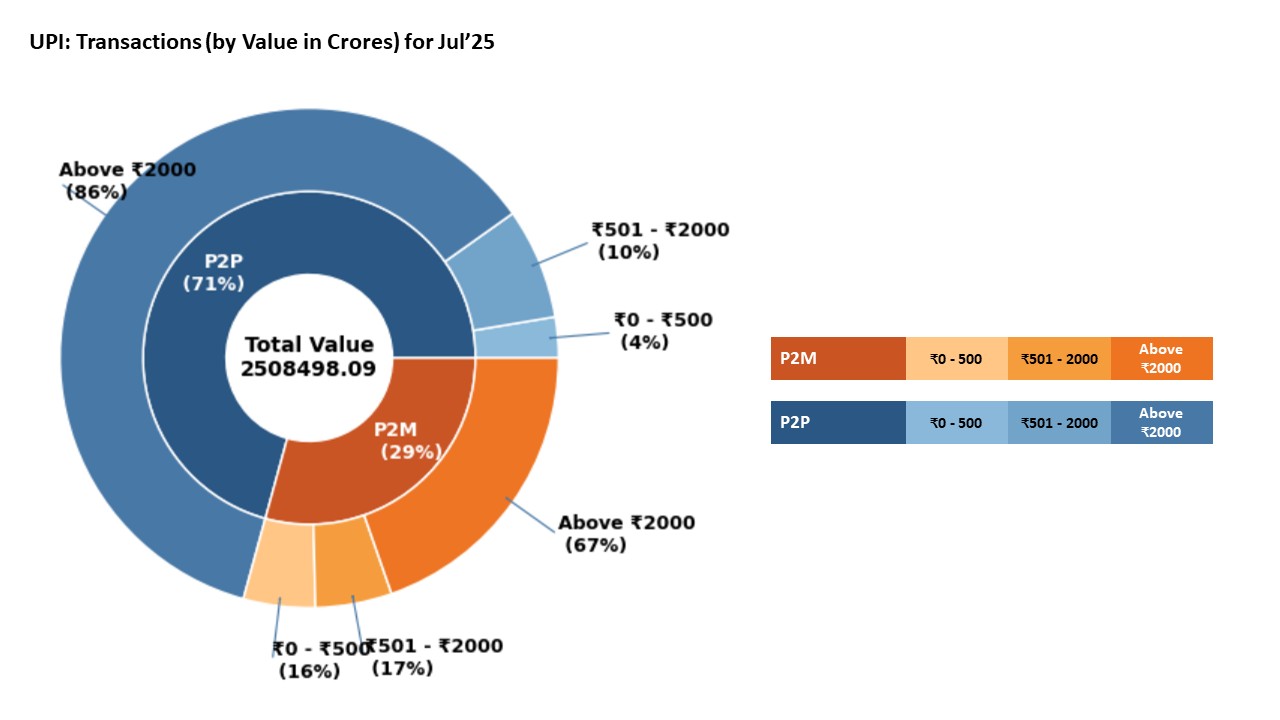
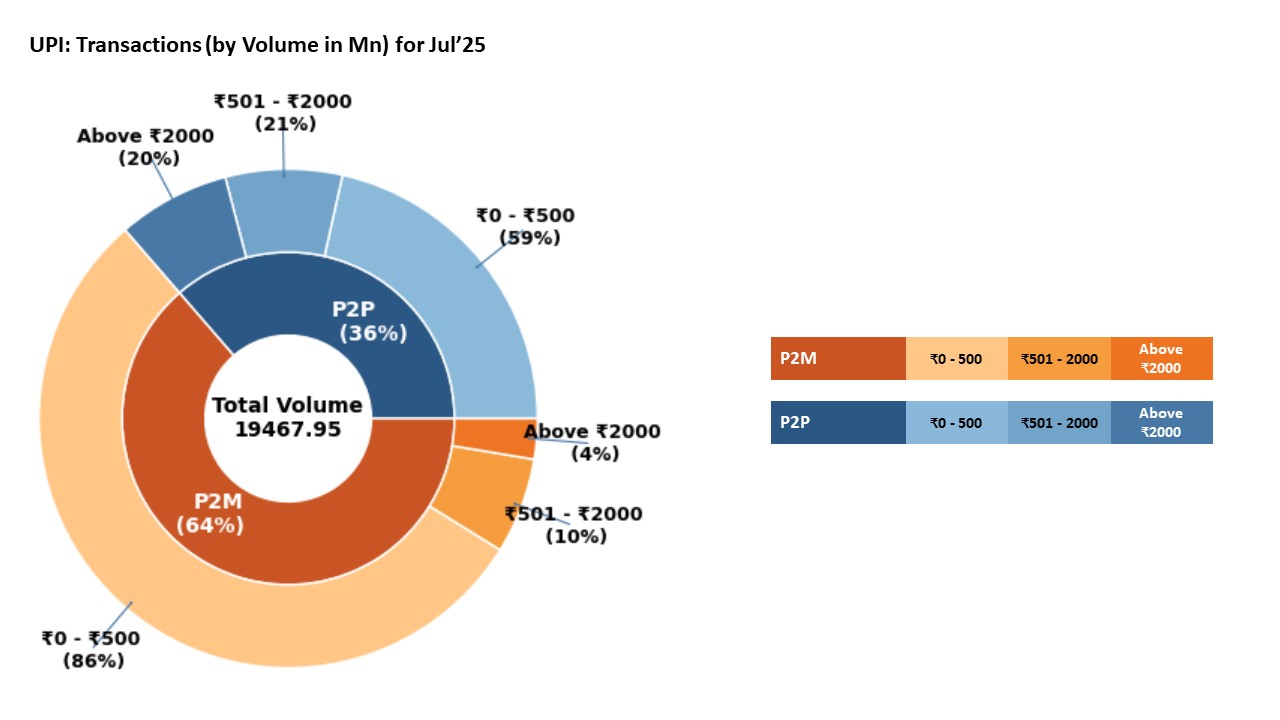
| Jul-25 | 19,467.95 | 25,08,498.09 | 7,079.843 | 17,74,485.73 | 12,388.11 | 7,34,012.36 |
| UPI Payer PSP Performance (Jul'25) | |||||
|---|---|---|---|---|---|
| Sr. No. | Payer PSP | Total Volume (In Mn) | Approved % | BD % | TD % |
| 1 | Axis Bank Ltd. | 7,234.98 | 93.26% | 6.61% | 0.13% |
| 2 | Yes Bank Ltd. | 5,894.24 | 90.91% | 8.98% | 0.11% |
| 3 | ICICI Bank Ltd. | 3,697.64 | 92.29% | 7.59% | 0.12% |
| 4 | HDFC Bank Ltd. | 2,038.72 | 94.18% | 5.76% | 0.07% |
| 5 | State Bank of India | 1,652.32 | 94.75% | 5.05% | 0.20% |
| 6 | Tri O Tech Solutions Private Limited | 124.54 | 100.00% | 0.00% | 0.00% |
| 7 | BHIM | 99.55 | 95.10% | 4.64% | 0.26% |
| 8 | Kotak Mahindra Bank | 67.13 | 100.00% | 0.00% | 0.00% |
| 9 | Airtel Payments Bank Limited | 22.17 | 96.29% | 3.63% | 0.08% |
| 10 | North East Small Finance Bank Ltd | 20.49 | 97.06% | 2.86% | 0.08% |
| 11 | IDFC Bank Ltd. | 19.28 | 99.79% | 0.21% | 0.00% |
| 12 | India Post Payments Bank Limited | 18.16 | 100.00% | 0.00% | 0.00% |
| 13 | RBL Bank Ltd. | 17.25 | 97.83% | 2.09% | 0.08% |
| 14 | One Mobikwik Systems Limited | 16.68 | 100.00% | 0.00% | 0.00% |
| 15 | Federal Bank Ltd. | 8.94 | 98.87% | 1.10% | 0.03% |
| UPI Payee PSP Performance (Jul'25) | |||||
|---|---|---|---|---|---|
| Sr. No. | Payee PSP | Total Volume (In Mn) | Approved % | BD % | TD % |
| 1 | Yes Bank Ltd. | 10,547.67 | 91.22% | 8.66% | 0.12% |
| 2 | Axis Bank Ltd. | 3,700.44 | 94.14% | 5.74% | 0.12% |
| 3 | ICICI Bank Ltd. | 1,863.07 | 93.66% | 6.21% | 0.14% |
| 4 | HDFC Bank Ltd. | 1,434.68 | 93.95% | 5.93% | 0.12% |
| 5 | State Bank of India | 1,434.09 | 94.89% | 4.98% | 0.13% |
| 6 | Federal Bank Ltd. | 294.38 | 96.86% | 3.02% | 0.12% |
| 7 | Airtel Payments Bank Limited | 211.01 | 93.30% | 6.58% | 0.12% |
| 8 | Indusind Bank Ltd. | 118.80 | 93.01% | 6.86% | 0.12% |
| 9 | Unity Small Finance Bank Limited | 116.81 | 96.99% | 2.90% | 0.11% |
| 10 | Canara Bank | 96.68 | 96.92% | 2.97% | 0.11% |
| 11 | RBL Bank Ltd. | 92.99 | 93.64% | 6.22% | 0.15% |
| 12 | Kotak Mahindra Bank | 74.50 | 95.01% | 4.75% | 0.25% |
| 13 | Tri O Tech Solutions Private Limited | 59.98 | 93.82% | 6.06% | 0.12% |
| 14 | One Mobikwik Systems Limited | 55.68 | 96.58% | 3.33% | 0.10% |
| 15 | NSDL Payments Bank Limited | 43.15 | 91.98% | 7.89% | 0.13% |
| UPI Merchant Category-wise Classification - July'25 (Arranged by Volume) | ||||
|---|---|---|---|---|
| Type | MCC | Description | Volume (in Mn) | Value (in Cr.) |
| High Transacting Categories | 5411 | Groceries And Supermarkets | 3,032.59 | 64,881.98 |
| 5814 | Fast Food Restaurants | 1,221.46 | 13,794.22 | |
| 5812 | Eating Places And Restaurants | 1,153.40 | 18,212.77 | |
| 4814 | Telecommunication Services, Including Local And Long Distance Calls, Credit Card Calls,Callsthrough Use Of Magnetic Stripe Reading Telephones And Faxes | 871.88 | 21,628.80 | |
| 5541 | Service Stations (With Or Without Ancillary Services) | 612.49 | 35,188.88 | |
| 5816 | Digital Goods: Games | 351.24 | 10,076.56 | |
| 5993 | Cigar Shops And Stands | 321.84 | 1,900.46 | |
| 5912 | Drug Stores And Pharmacies | 297.41 | 11,824.93 | |
| 5462 | Bakeries | 261.93 | 3,778.91 | |
| 5451 | Dairies | 178.32 | 4,372.84 | |
| Medium Transacting Categories | 4900 | Utilities Electric, Gas, Water And Sanitary | 174.72 | 23,497.63 |
| 7322 | Debt Collection Agencies | 161.36 | 93,857.47 | |
| 5921 | Package Shops Beer, Wine And Liquor | 145.64 | 5,920.43 | |
| 5262 | Online Marketplaces | 122.01 | 8,053.72 | |
| 9399 | Government Services Not Elsewhere Classified | 109.96 | 11,298.32 | |
| 5441 | Candy, Nut And Confectionery Shops | 107.37 | 1,945.81 | |
| 5422 | Freezer And Locker Meat Provisioners | 98.64 | 3,140.46 | |
| 5412 | Purchase Of Digital Gold | 95.72 | 1,020.24 | |
| 5691 | Mens And Womens Clothing Shops | 92.54 | 10,874.31 | |
| 5732 | Electronics Shops | 92.13 | 10,067.66 | |
| All Other Categories | 5813 | Drinking Places (Alcoholic Beverages) Bars, Taverns, Night-Clubs, Cocktail Lounges And Discothques | 86.44 | 3,314.04 |
| 7622 | Electronics Repair Shops | 77.30 | 2,202.87 | |
| 4112 | Passenger Railways | 73.85 | 3,657.91 | |
| 7230 | Beauty And Barber Shops | 73.66 | 2,061.03 | |
| 4121 | Taxi-Cabs And Limousines | 67.65 | 1,186.07 | |
| 5311 | Department Stores | 65.88 | 4,095.40 | |
| 6211 | Securities Brokers And Dealers | 65.71 | 61,080.49 | |
| 5137 | Mens, Womens And Childrens Uniforms And Commercial Clothing | 65.64 | 5,968.52 | |
| 5331 | Variety Stores | 60.23 | 3,146.05 | |
| Others | 2,249.10 | 2,91,963.58 | ||
| Total | 12,388.11 | 7,34,012.36 | ||
| State-wise UPI Product Statistics* (July'25) | |||||
|---|---|---|---|---|---|
| Sr. No. | State / Union Territory | Volume (in Mn ) | Volume Contribution (%) | Value (in Cr.) | Value Contribution (%) |
| 1 | MAHARASHTRA | 1,905.45 | 9.79% | 2,30,572.42 | 9.19% |
| 2 | KARNATAKA | 1,067.74 | 5.48% | 1,44,605.61 | 5.76% |
| 3 | UTTAR PRADESH | 1,031.94 | 5.30% | 1,31,885.79 | 5.26% |
| 4 | TELANGANA | 791.46 | 4.07% | 1,26,739.73 | 5.05% |
| 5 | TAMIL NADU | 778.83 | 4.00% | 1,17,090.44 | 4.67% |
| 6 | ANDHRA PRADESH | 535.33 | 2.75% | 93,508.25 | 3.73% |
| 7 | RAJASTHAN | 527.21 | 2.71% | 76,044.26 | 3.03% |
| 8 | GUJARAT | 501.34 | 2.58% | 74,010.90 | 2.95% |
| 9 | DELHI | 468.19 | 2.40% | 58,845.62 | 2.35% |
| 10 | WEST BENGAL | 425.54 | 2.19% | 62,144.42 | 2.48% |
| 11 | MADHYA PRADESH | 420.83 | 2.16% | 55,546.05 | 2.21% |
| 12 | BIHAR | 405.54 | 2.08% | 58,775.41 | 2.34% |
| 13 | HARYANA | 397.29 | 2.04% | 54,916.93 | 2.19% |
| 14 | KERALA | 369.33 | 1.90% | 51,875.51 | 2.07% |
| 15 | ODISHA | 263.74 | 1.35% | 33,890.22 | 1.35% |
| 16 | PUNJAB | 210.05 | 1.08% | 34,831.65 | 1.39% |
| 17 | ASSAM | 197.75 | 1.02% | 21,802.15 | 0.87% |
| 18 | JHARKHAND | 167.61 | 0.86% | 21,496.22 | 0.86% |
| 19 | CHHATTISGARH | 129.34 | 0.66% | 16,474.90 | 0.66% |
| 20 | UTTARAKHAND | 111.48 | 0.57% | 13,515.41 | 0.54% |
| 21 | JAMMU AND KASHMIR | 85.58 | 0.44% | 10,998.69 | 0.44% |
| 22 | HIMACHAL PRADESH | 56.85 | 0.29% | 7,153.07 | 0.29% |
| 23 | GOA | 30.59 | 0.16% | 4,347.72 | 0.17% |
| 24 | CHANDIGARH | 26.05 | 0.13% | 3,244.66 | 0.13% |
| 25 | ARUNACHAL PRADESH | 21.14 | 0.11% | 2,771.17 | 0.11% |
| 26 | PUDUCHERRY | 18.45 | 0.09% | 2,521.15 | 0.10% |
| 27 | MEGHALAYA | 15.50 | 0.08% | 2,093.59 | 0.08% |
| 28 | MANIPUR | 14.39 | 0.07% | 2,877.94 | 0.11% |
| 29 | TRIPURA | 14.24 | 0.07% | 1,891.80 | 0.08% |
| 30 | NAGALAND | 11.80 | 0.06% | 1,754.04 | 0.07% |
| 31 | MIZORAM | 11.46 | 0.06% | 1,702.60 | 0.07% |
| 32 | DADRA & NAGAR HAVELI & DAMAN & DIU | 10.43 | 0.05% | 1,115.18 | 0.04% |
| 33 | SIKKIM | 8.19 | 0.04% | 1,044.52 | 0.04% |
| 34 | LADAKH | 4.68 | 0.02% | 821.56 | 0.03% |
| 35 | ANDAMAN & NICOBAR | 3.69 | 0.02% | 551.63 | 0.02% |
| 36 | LAKSHADWEEP | 0.54 | 0.00% | 53.09 | 0.00% |
| 37 | Unclassified# | 8,428.39 | 43.29% | 9,84,983.82 | 39.27% |
| UPI Remitter Members - Top 50 Members (Jun'25) | |||||||
|---|---|---|---|---|---|---|---|
| Sr. No. | UPI Remitter Members (Jun-2025) | Total Volume (In Mn) | Approved % | BD % | TD% | Total Debit Reversal Count (In Mn) | Debit Reversal Success % |
| 1 | State Bank of India | 4,917.29 | 93.64% | 5.82% | 0.54% | 12.90 | 98.27% |
| 2 | HDFC Bank Ltd. | 1,472.04 | 95.30% | 4.62% | 0.08% | 1.80 | 99.45% |
| 3 | Bank of Baroda | 1,239.11 | 91.09% | 8.88% | 0.03% | 3.01 | 98.54% |
| 4 | Union Bank of India | 1,144.76 | 92.95% | 6.94% | 0.11% | 2.71 | 88.94% |
| 5 | Punjab National Bank | 1,053.00 | 92.38% | 7.59% | 0.02% | 2.67 | 99.01% |
| 6 | Kotak Mahindra Bank | 906.50 | 92.48% | 7.49% | 0.04% | 1.92 | 97.08% |
| 7 | Canara Bank | 889.37 | 92.85% | 6.83% | 0.32% | 2.61 | 67.38% |
| 8 | Axis Bank Ltd. | 834.65 | 94.52% | 5.12% | 0.36% | 2.15 | 69.54% |
| 9 | ICICI Bank Ltd. | 696.88 | 96.24% | 3.74% | 0.03% | 1.15 | 96.02% |
| 10 | Indian Bank | 586.64 | 93.23% | 6.69% | 0.08% | 1.15 | 97.62% |
| 11 | India Post Payments Bank Limited | 580.38 | 88.95% | 10.65% | 0.41% | 2.15 | 84.83% |
| 12 | Bank Of India | 570.58 | 92.87% | 5.83% | 1.30% | 3.53 | 45.85% |
| 13 | Airtel Payments Bank Limited | 569.33 | 87.08% | 12.52% | 0.40% | 2.02 | 94.49% |
| 14 | Indian Overseas Bank | 298.47 | 92.76% | 6.78% | 0.45% | 0.72 | 97.39% |
| 15 | Central Bank of India | 265.57 | 91.64% | 7.94% | 0.42% | 0.97 | 87.00% |
| 16 | UCO Bank | 254.42 | 91.81% | 7.78% | 0.41% | 0.95 | 84.51% |
| 17 | Federal Bank Ltd. | 242.10 | 93.38% | 6.60% | 0.02% | 0.42 | 95.94% |
| 18 | Fino Payments Bank Ltd. | 209.27 | 87.38% | 11.74% | 0.88% | 0.90 | 77.08% |
| 19 | Bank of Maharashtra | 200.61 | 93.59% | 6.38% | 0.03% | 0.46 | 96.05% |
| 20 | Indusind Bank Ltd. | 196.57 | 89.94% | 9.41% | 0.64% | 0.93 | 51.63% |
| 21 | IDBI Bank Ltd. | 193.91 | 93.65% | 6.08% | 0.27% | 0.53 | 84.41% |
| 22 | Yes Bank Ltd. | 180.35 | 92.55% | 7.37% | 0.08% | 0.25 | 85.72% |
| 23 | Karnataka Bank | 138.50 | 92.41% | 7.34% | 0.25% | 0.35 | 77.32% |
| 24 | Tri O Tech Solutions Private Limited | 112.44 | 100.00% | 0.00% | 0.00% | - | 0.00% |
| 25 | IDFC Bank Ltd. | 112.34 | 93.54% | 6.32% | 0.14% | 0.25 | 83.80% |
| 26 | The Jammu & Kashmir Bank Limited | 97.27 | 93.34% | 5.92% | 0.73% | 0.64 | 41.11% |
| 27 | Karur Vysya Bank | 89.99 | 93.12% | 6.59% | 0.29% | 0.18 | 92.26% |
| 28 | Bandhan Bank limited | 84.89 | 94.23% | 5.28% | 0.49% | 0.29 | 93.99% |
| 29 | AU Small Finance Bank | 72.91 | 90.35% | 9.61% | 0.04% | 0.21 | 92.05% |
| 30 | The South Indian Bank Limited | 68.49 | 94.67% | 5.13% | 0.19% | 0.10 | 98.73% |
| 31 | Punjab and Sind Bank | 55.07 | 91.18% | 7.76% | 1.06% | 0.35 | 71.82% |
| 32 | City Union Bank | 52.89 | 92.20% | 7.59% | 0.20% | 0.08 | 99.33% |
| 33 | Ujjivan Small Finance Bank Limited | 52.39 | 91.45% | 8.25% | 0.30% | 0.14 | 87.38% |
| 34 | Tamilnad Mercantile Bank Limited | 52.32 | 93.04% | 6.81% | 0.15% | 0.08 | 72.68% |
| 35 | JIO Payments Bank Ltd | 52.13 | 85.91% | 13.08% | 1.01% | 0.38 | 92.66% |
| 36 | Baroda U.P. Bank | 44.19 | 93.21% | 5.56% | 1.23% | 0.28 | 53.69% |
| 37 | Kerala Gramin Bank | 43.30 | 91.63% | 6.78% | 1.58% | 0.34 | 73.04% |
| 38 | Telangana Grameena Bank | 41.11 | 87.07% | 10.14% | 2.79% | 0.28 | 65.85% |
| 39 | NSDL Payments Bank Limited | 38.69 | 85.05% | 14.21% | 0.74% | 0.22 | 77.12% |
| 40 | Karnataka Gramin Bank | 34.24 | 88.11% | 9.33% | 2.56% | 0.29 | 64.60% |
| 41 | Maharashtra Gramin Bank | 34.01 | 86.29% | 12.86% | 0.85% | 0.14 | 57.19% |
| 42 | Rajasthan Marudhara Gramin Bank | 33.30 | 86.73% | 11.81% | 1.47% | 0.17 | 73.69% |
| 43 | RBL Bank Ltd. | 32.16 | 93.89% | 5.88% | 0.23% | 0.07 | 61.68% |
| 44 | ESAF Small Finance Bank Ltd | 31.54 | 95.88% | 4.02% | 0.10% | 0.07 | 94.00% |
| 45 | DBS Bank India Limited | 30.55 | 93.29% | 6.52% | 0.19% | 0.07 | 87.06% |
| 46 | Andhra Pragathi Grameena Bank | 29.66 | 83.04% | 12.70% | 4.26% | 0.23 | 63.90% |
| 47 | Equitas Small Finance Bank | 28.87 | 91.34% | 8.66% | 0.00% | 0.07 | 99.13% |
| 48 | Saraswat Co-operative Bank | 28.21 | 94.61% | 5.30% | 0.08% | 0.06 | 89.18% |
| 49 | Sarva Haryana Gramin Bank | 24.99 | 94.60% | 4.55% | 0.84% | 0.14 | 64.95% |
| 50 | Standard Chartered Bank | 24.78 | 95.78% | 3.88% | 0.33% | 0.05 | 74.66% |
| UPI Beneficiary Members - Top 50 Members (Jun'25) | |||||||
|---|---|---|---|---|---|---|---|
| Sr.No. | UPI Beneficiary Members (Jun-2025) | Total Volume (In Mn) | Approved % | BD% | TD% | Deemed Approved % | |
| 1 | Yes Bank Ltd. | 7,527.12 | 99.99% | 0.01% | 0.00% | 0.00% | |
| 2 | Axis Bank Ltd. | 1,842.48 | 99.47% | 0.10% | 0.43% | 0.14% | |
| 3 | State Bank of India | 1,829.69 | 99.71% | 0.09% | 0.20% | 0.15% | |
| 4 | HDFC Bank Ltd. | 925.31 | 99.36% | 0.52% | 0.12% | 0.02% | |
| 5 | ICICI Bank Ltd. | 587.60 | 99.62% | 0.35% | 0.03% | 0.01% | |
| 6 | Bank of Baroda | 476.64 | 99.52% | 0.45% | 0.03% | 0.03% | |
| 7 | Union Bank of India | 440.68 | 99.85% | 0.10% | 0.05% | 0.05% | |
| 8 | Airtel Payments Bank Limited | 437.39 | 98.89% | 0.90% | 0.21% | 0.05% | |
| 9 | Punjab National Bank | 419.47 | 99.68% | 0.29% | 0.03% | 0.25% | |
| 10 | Canara Bank | 413.06 | 99.60% | 0.13% | 0.28% | 0.11% | |
| 11 | Federal Bank Ltd. | 369.76 | 99.76% | 0.21% | 0.03% | 0.01% | |
| 12 | Kotak Mahindra Bank | 338.36 | 98.86% | 1.11% | 0.04% | 0.02% | |
| 13 | Indian Bank | 269.49 | 99.66% | 0.20% | 0.14% | 0.05% | |
| 14 | India Post Payments Bank Limited | 259.53 | 98.65% | 1.08% | 0.27% | 0.06% | |
| 15 | Bank Of India | 245.22 | 97.79% | 0.95% | 1.27% | 0.48% | |
| 16 | Indusind Bank Ltd. | 164.60 | 98.94% | 0.35% | 0.71% | 0.32% | |
| 17 | Indian Overseas Bank | 145.41 | 99.21% | 0.54% | 0.25% | 0.18% | |
| 18 | Central Bank of India | 122.50 | 99.11% | 0.69% | 0.19% | 0.14% | |
| 19 | UCO Bank | 108.71 | 98.99% | 0.38% | 0.63% | 0.09% | |
| 20 | Fino Payments Bank Ltd. | 95.00 | 97.97% | 1.43% | 0.60% | 0.06% | |
| 21 | IDBI Bank Ltd. | 92.12 | 99.52% | 0.26% | 0.22% | 0.06% | |
| 22 | Unity Small Finance Bank Limited | 90.73 | 99.99% | 0.00% | 0.00% | 0.00% | |
| 23 | Bank of Maharashtra | 79.48 | 99.72% | 0.24% | 0.05% | 0.01% | |
| 24 | RBL Bank Ltd. | 76.22 | 99.83% | 0.06% | 0.11% | 0.09% | |
| 25 | Karnataka Bank | 70.21 | 99.31% | 0.35% | 0.34% | 0.05% | |
| 26 | The Jammu & Kashmir Bank Limited | 57.68 | 99.16% | 0.65% | 0.19% | 0.28% | |
| 27 | Tri O Tech Solutions Private Limited | 52.11 | 98.51% | 0.91% | 0.58% | 0.27% | |
| 28 | One Mobikwik Systems Limited | 50.43 | 99.82% | 0.00% | 0.18% | 0.01% | |
| 29 | NSDL Payments Bank Limited | 49.27 | 99.04% | 0.83% | 0.13% | 0.06% | |
| 30 | Bandhan Bank limited | 48.61 | 99.09% | 0.38% | 0.53% | 0.06% | |
| 31 | IDFC Bank Ltd. | 46.99 | 98.97% | 0.87% | 0.16% | 0.04% | |
| 32 | Karur Vysya Bank | 43.07 | 99.69% | 0.22% | 0.09% | 0.01% | |
| 33 | The South Indian Bank Limited | 42.13 | 99.79% | 0.12% | 0.09% | 0.02% | |
| 34 | Tamilnad Mercantile Bank Limited | 35.79 | 99.45% | 0.41% | 0.14% | 0.01% | |
| 35 | JIO Payments Bank Ltd | 35.29 | 98.70% | 0.82% | 0.48% | 0.13% | |
| 36 | AU Small Finance Bank | 32.26 | 99.41% | 0.57% | 0.02% | 0.03% | |
| 37 | City Union Bank | 29.81 | 99.35% | 0.37% | 0.27% | 0.01% | |
| 38 | Kerala Gramin Bank | 25.46 | 98.92% | 0.30% | 0.78% | 0.63% | |
| 39 | Ujjivan Small Finance Bank Limited | 25.02 | 99.54% | 0.22% | 0.24% | 0.16% | |
| 40 | Punjab and Sind Bank | 24.81 | 97.11% | 1.91% | 0.98% | 0.18% | |
| 41 | Suryoday Small Finance Bank Limited | 23.83 | 98.81% | 1.03% | 0.16% | 0.10% | |
| 42 | Baroda U.P. Bank | 21.16 | 99.00% | 0.23% | 0.77% | 0.23% | |
| 43 | Citi Bank | 20.77 | 99.63% | 0.35% | 0.02% | 0.04% | |
| 44 | Telangana Grameena Bank | 17.75 | 99.04% | 0.50% | 0.46% | 0.14% | |
| 45 | Karnataka Gramin Bank | 15.53 | 97.80% | 0.54% | 1.66% | 0.63% | |
| 46 | Maharashtra Gramin Bank | 14.58 | 97.04% | 0.12% | 2.84% | 0.09% | |
| 47 | ESAF Small Finance Bank Ltd | 14.24 | 99.63% | 0.27% | 0.10% | 0.02% | |
| 48 | Andhra Pragathi Grameena Bank | 13.91 | 92.43% | 1.11% | 6.46% | 0.15% | |
| 49 | Equitas Small Finance Bank | 13.46 | 98.00% | 1.87% | 0.12% | 0.00% | |
| 50 | Rajasthan Marudhara Gramin Bank | 13.03 | 98.16% | 1.53% | 0.31% | 0.08% | |
| UPI Apps (Jun'25) | |||||||||
|---|---|---|---|---|---|---|---|---|---|
| Sr.No. | Application Name | Customer Initiated Transactions | B2C Transactions | B2B Transactions | Total | ||||
| Volume (Mn) | Value (Cr) | Volume (Mn) | Value (Cr) | Volume (Mn) | Value (Cr) | Volume (Mn) | Value (Cr) | ||
| 1 | Phone Pe # | 8,547.04 | 11,98,690.03 | 0.00 | 0.00 | 0.00 | 0.00 | 8,547.04 | 11,98,690.03 |
| 2 | Google Pay # | 6,540.92 | 8,40,931.06 | 0.00 | 0.00 | 0.00 | 0.00 | 6,540.92 | 8,40,931.06 |
| 3 | Paytm # | 1,269.16 | 1,34,171.16 | 0.00 | 0.00 | 0.00 | 0.00 | 1,269.16 | 1,34,171.16 |
| 4 | Navi # | 406.01 | 21,814.51 | 0.00 | 0.00 | 0.00 | 0.00 | 406.01 | 21,814.51 |
| 5 | super.money # | 218.96 | 7,716.48 | 0.00 | 0.00 | 0.00 | 0.00 | 218.96 | 7,716.48 |
| 6 | Cred # | 138.32 | 51,384.11 | 0.00 | 0.00 | 0.00 | 0.00 | 138.32 | 51,384.11 |
| 7 | Axis Bank Apps | 24.05 | 5,230.63 | 102.21 | 4,155.09 | 0.01 | 2.78 | 126.27 | 9,388.51 |
| 8 | FamApp by Trio # | 112.75 | 1,439.64 | 0.00 | 0.00 | 0.00 | 0.00 | 112.75 | 1,439.64 |
| 9 | Amazon Pay # | 93.25 | 9,942.48 | 0.00 | 0.00 | 0.00 | 0.00 | 93.25 | 9,942.48 |
| 10 | BHIM # | 73.07 | 11,725.85 | 0.00 | 0.00 | 0.00 | 0.00 | 73.07 | 11,725.85 |
| 11 | Whatsapp # | 67.48 | 4,989.34 | 0.00 | 0.00 | 0.00 | 0.00 | 67.48 | 4,989.34 |
| 12 | HDFC Bank Apps | 48.40 | 14,287.88 | 19.05 | 8.75 | 0.01 | 1.18 | 67.46 | 14,297.80 |
| 13 | ICICI Bank Apps | 59.57 | 14,148.92 | 0.01 | 13.81 | 2.24 | 1,821.19 | 61.82 | 15,983.92 |
| 14 | Kotak Mahindra Bank Apps | 60.36 | 7,735.27 | 0.00 | 0.00 | 0.00 | 0.00 | 60.36 | 7,735.27 |
| 15 | Yes Bank Apps | 52.20 | 8,898.96 | 0.01 | 0.05 | 0.34 | 18.31 | 52.55 | 8,917.32 |
| 16 | Mobikwik # | 34.43 | 4,600.71 | 0.00 | 0.00 | 0.00 | 0.00 | 34.43 | 4,600.71 |
| 17 | POPclub | 32.33 | 834.39 | 0.00 | 0.00 | 0.00 | 0.00 | 32.33 | 834.39 |
| 18 | Airtel Payments Bank Apps | 19.74 | 1,368.19 | 0.00 | 0.01 | 0.00 | 0.00 | 19.74 | 1,368.20 |
| 19 | Slice Small Finance Bank Apps | 17.76 | 2,317.46 | 0.00 | 0.00 | 0.00 | 0.00 | 17.76 | 2,317.46 |
| 20 | IDFC Bank Apps | 17.42 | 2,481.19 | 0.00 | 0.03 | 0.02 | 0.10 | 17.44 | 2,481.31 |
| 21 | India Post Payments Bank Apps | 16.65 | 1,730.46 | 0.00 | 0.00 | 0.00 | 0.00 | 16.65 | 1,730.46 |
| 22 | State Bank of India Apps | 13.35 | 3,591.53 | 0.00 | 0.00 | 0.00 | 0.00 | 13.35 | 3,591.53 |
| 23 | Groww # | 12.46 | 8,801.55 | 0.00 | 0.00 | 0.00 | 0.00 | 12.46 | 8,801.55 |
| 24 | Bajaj Finserv | 11.40 | 2,351.65 | 0.00 | 0.00 | 0.00 | 0.00 | 11.40 | 2,351.65 |
| 25 | RBL Bank Apps | 10.57 | 1,560.21 | 0.00 | 0.10 | 0.12 | 27.35 | 10.70 | 1,587.67 |
| 26 | Samsung Pay # | 8.81 | 624.29 | 0.00 | 0.00 | 0.00 | 0.00 | 8.81 | 624.29 |
| 27 | Jupiter Money # | 5.99 | 905.62 | 0.00 | 0.00 | 0.00 | 0.00 | 5.99 | 905.62 |
| 28 | Federal Bank Apps | 5.22 | 1,006.22 | 0.00 | 0.00 | 0.00 | 0.00 | 5.22 | 1,006.22 |
| 29 | Jio Payments Bank Apps | 4.26 | 308.69 | 0.00 | 0.00 | 0.00 | 0.00 | 4.26 | 308.69 |
| 30 | Deutsche Bank Apps | 4.02 | 723.81 | 0.00 | 0.00 | 0.00 | 0.14 | 4.02 | 723.95 |
| 31 | Timepay # | 3.96 | 50.49 | 0.00 | 0.00 | 0.00 | 0.00 | 3.96 | 50.49 |
| 32 | Canara Bank Apps | 3.49 | 911.93 | 0.00 | 0.00 | 0.00 | 0.00 | 3.49 | 911.93 |
| 33 | Punjab National Bank Apps | 3.46 | 917.08 | 0.00 | 0.00 | 0.00 | 0.00 | 3.46 | 917.08 |
| 34 | Kiwi # | 3.43 | 385.72 | 0.00 | 0.00 | 0.00 | 0.00 | 3.43 | 385.72 |
| 35 | Fi Money # | 2.75 | 375.21 | 0.00 | 0.00 | 0.00 | 0.00 | 2.75 | 375.21 |
| 36 | Flipkart UPI # | 2.52 | 144.64 | 0.00 | 0.00 | 0.00 | 0.00 | 2.52 | 144.64 |
| 37 | Jammu and Kashmir Bank Apps | 2.41 | 316.86 | 0.00 | 0.00 | 0.00 | 0.00 | 2.41 | 316.86 |
| 38 | Shri Ram One # | 2.16 | 144.64 | 0.00 | 0.00 | 0.00 | 0.00 | 2.16 | 144.64 |
| 39 | Bank of Baroda Apps | 1.77 | 497.24 | 0.00 | 0.00 | 0.00 | 0.00 | 1.77 | 497.24 |
| 40 | Standard Chartered Bank Apps | 1.54 | 158.54 | 0.00 | 0.00 | 0.20 | 6.54 | 1.74 | 165.08 |
| 41 | Omni Card | 1.62 | 93.83 | 0.00 | 0.00 | 0.00 | 0.00 | 1.62 | 93.83 |
| 42 | Ind Money # | 1.41 | 558.23 | 0.00 | 0.00 | 0.00 | 0.00 | 1.41 | 558.23 |
| 43 | IndusInd Bank Apps | 1.31 | 173.24 | 0.00 | 0.00 | 0.00 | 0.00 | 1.31 | 173.24 |
| 44 | NSDL Payments Bank Apps | 1.18 | 47.50 | 0.00 | 0.00 | 0.01 | 0.91 | 1.19 | 48.41 |
| 45 | HSBC Bank Apps | 1.00 | 121.63 | 0.01 | 0.28 | 0.00 | 0.25 | 1.02 | 122.16 |
| 46 | Central Bank of India Apps | 0.93 | 186.91 | 0.00 | 0.00 | 0.00 | 0.00 | 0.93 | 186.91 |
| 47 | Suryoday Bank Apps | 0.89 | 118.34 | 0.00 | 0.00 | 0.01 | 3.07 | 0.90 | 121.41 |
| 48 | Digikhata | 0.88 | 287.21 | 0.00 | 0.00 | 0.00 | 0.00 | 0.88 | 287.21 |
| 49 | DBS Digibank Apps | 0.86 | 221.17 | 0.00 | 0.00 | 0.01 | 1.80 | 0.87 | 222.97 |
| 50 | Indian Bank Apps | 0.87 | 203.68 | 0.00 | 0.00 | 0.00 | 0.00 | 0.87 | 203.68 |
| 51 | Union Bank Apps | 0.74 | 236.20 | 0.00 | 0.00 | 0.00 | 0.00 | 0.74 | 236.20 |
| 52 | South Indian Bank Apps | 0.73 | 208.33 | 0.00 | 0.00 | 0.00 | 0.00 | 0.73 | 208.33 |
| 53 | One Card # | 0.73 | 834.56 | 0.00 | 0.00 | 0.00 | 0.00 | 0.73 | 834.56 |
| 54 | AU Small Finance Bank Apps | 0.62 | 184.72 | 0.00 | 0.00 | 0.00 | 0.00 | 0.62 | 184.72 |
| 55 | ESAF Small Finance Bank Apps | 0.57 | 58.00 | 0.00 | 0.00 | 0.00 | 0.00 | 0.57 | 58.00 |
| 56 | Fino Payments Bank Apps | 0.54 | 53.51 | 0.00 | 0.00 | 0.00 | 0.00 | 0.54 | 53.51 |
| 57 | Bharat Pe # | 0.54 | 46.14 | 0.00 | 0.00 | 0.00 | 0.00 | 0.54 | 46.14 |
| 58 | UCO Bank Apps | 0.51 | 125.51 | 0.00 | 0.00 | 0.00 | 0.00 | 0.51 | 125.51 |
| 59 | Tata Pay # | 0.47 | 134.16 | 0.00 | 0.00 | 0.00 | 0.00 | 0.47 | 134.16 |
| 60 | Salary Se # | 0.46 | 21.59 | 0.00 | 0.00 | 0.00 | 0.00 | 0.46 | 21.59 |
| 61 | Kredit Pe # | 0.43 | 42.00 | 0.00 | 0.00 | 0.00 | 0.00 | 0.43 | 42.00 |
| 62 | Aditya Birla Capital Digital # | 0.37 | 42.70 | 0.00 | 0.00 | 0.00 | 0.00 | 0.37 | 42.70 |
| 63 | Money View # | 0.34 | 38.22 | 0.00 | 0.00 | 0.00 | 0.00 | 0.34 | 38.22 |
| 64 | Indian Overseas Bank Apps | 0.28 | 67.04 | 0.00 | 0.00 | 0.00 | 0.00 | 0.28 | 67.04 |
| 65 | Bank of India Apps | 0.28 | 82.52 | 0.00 | 0.00 | 0.00 | 0.00 | 0.28 | 82.52 |
| 66 | Karnataka Bank Apps | 0.25 | 57.35 | 0.00 | 0.00 | 0.00 | 0.00 | 0.25 | 57.35 |
| 67 | Spice Money | 0.20 | 14.16 | 0.00 | 0.00 | 0.00 | 0.00 | 0.20 | 14.16 |
| 68 | Rapipay | 0.17 | 19.48 | 0.00 | 0.00 | 0.00 | 0.00 | 0.17 | 19.48 |
| 69 | Dhani | 0.17 | 7.65 | 0.00 | 0.00 | 0.00 | 0.00 | 0.17 | 7.65 |
| 70 | IDBI Bank Apps | 0.14 | 49.11 | 0.00 | 0.00 | 0.00 | 0.00 | 0.14 | 49.11 |
| 71 | Ultracash # | 0.10 | 7.45 | 0.00 | 0.00 | 0.00 | 0.00 | 0.10 | 7.45 |
| 72 | Karur Vysya Bank Apps | 0.10 | 35.57 | 0.00 | 0.00 | 0.00 | 0.00 | 0.10 | 35.57 |
| 73 | Tamilnad Mercantile Bank Apps | 0.09 | 32.85 | 0.00 | 0.00 | 0.00 | 0.00 | 0.09 | 32.85 |
| 74 | Obopay | 0.08 | 11.38 | 0.00 | 0.00 | 0.00 | 0.00 | 0.08 | 11.38 |
| 75 | City Union Bank Apps | 0.08 | 29.99 | 0.00 | 0.00 | 0.00 | 0.00 | 0.08 | 29.99 |
| 76 | True Balance | 0.07 | 2.20 | 0.00 | 0.00 | 0.00 | 0.00 | 0.07 | 2.20 |
| 77 | Unity Small Finance Bank Apps | 0.07 | 16.01 | 0.00 | 0.00 | 0.00 | 0.00 | 0.07 | 16.01 |
| 78 | Niyo Global # | 0.06 | 14.82 | 0.00 | 0.00 | 0.00 | 0.00 | 0.06 | 14.82 |
| 79 | Freo # | 0.03 | 2.23 | 0.00 | 0.00 | 0.00 | 0.00 | 0.03 | 2.23 |
| 80 | Payworld | 0.03 | 1.96 | 0.00 | 0.00 | 0.00 | 0.00 | 0.03 | 1.96 |
| 81 | Bank of Maharashtra Apps | 0.02 | 8.31 | 0.00 | 0.00 | 0.00 | 0.00 | 0.02 | 8.31 |
| 82 | Others | 1.94 | 238.55 | 0.00 | 0.00 | 0.12 | 5.06 | 2.06 | 243.61 |
Note:-
| UPI P2P and P2M Transactions | ||||||
|---|---|---|---|---|---|---|
| Month | Total | P2P | P2M | |||
| Volume (Mn) | Value (Cr) | Volume (Mn) | Value (Cr) | Volume (Mn) | Value (Cr) | |
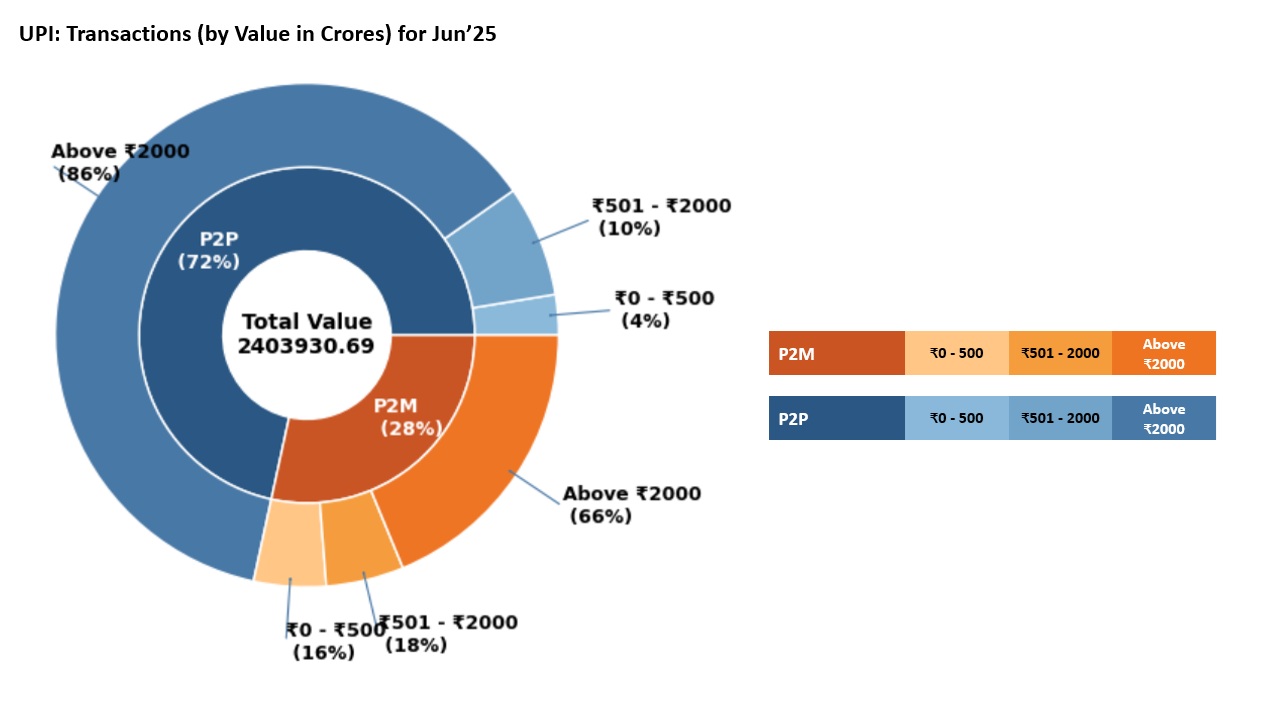
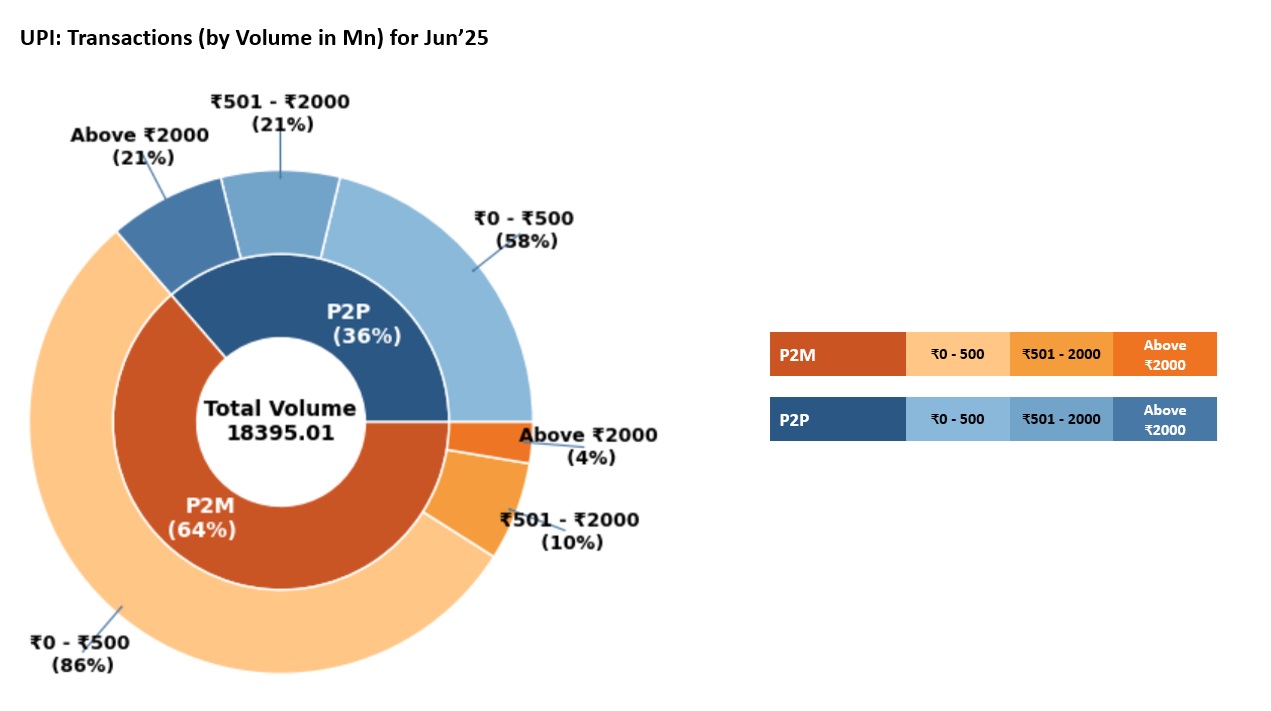
| Jun-25 | 18,395.01 | 24,03,930.69 | 6,685.63 | 17,21,058.47 | 11,709.38 | 6,82,872.22 |
| UPI Payer PSP Performance (Jun'25) | |||||
|---|---|---|---|---|---|
| Sr. No. | Payer PSP | Total Volume (In Mn) | Approved % | BD % | TD % |
| 1 | Axis Bank Ltd. | 6,282.26 | 93.29% | 6.53% | 0.19% |
| 2 | Yes Bank Ltd. | 6,062.04 | 91.82% | 8.06% | 0.12% |
| 3 | ICICI Bank Ltd. | 3,348.12 | 92.46% | 7.40% | 0.15% |
| 4 | HDFC Bank Ltd. | 1,857.50 | 94.36% | 5.57% | 0.07% |
| 5 | State Bank of India | 1,786.32 | 95.31% | 4.48% | 0.21% |
| 6 | Tri O Tech Solutions Private Limited | 112.44 | 100.00% | 0.00% | 0.00% |
| 7 | BHIM | 83.63 | 95.30% | 4.48% | 0.23% |
| 8 | Kotak Mahindra Bank | 60.77 | 100.00% | 0.00% | 0.00% |
| 9 | Airtel Payments Bank Limited | 20.48 | 96.42% | 3.48% | 0.10% |
| 10 | RBL Bank Ltd. | 18.81 | 98.08% | 1.84% | 0.07% |
| 11 | IDFC Bank Ltd. | 18.49 | 99.80% | 0.20% | 0.00% |
| 12 | North East Small Finance Bank Ltd | 18.35 | 97.05% | 2.87% | 0.08% |
| 13 | India Post Payments Bank Limited | 16.65 | 100.00% | 0.00% | 0.00% |
| 14 | One Mobikwik Systems Limited | 13.74 | 100.00% | 0.00% | 0.00% |
| 15 | Federal Bank Ltd. | 8.19 | 98.90% | 1.08% | 0.02% |
| UPI Payee PSP Performance (Jun'25) | |||||
|---|---|---|---|---|---|
| Sr. No. | Payee PSP | Total Volume (In Mn) | Approved % | BD % | TD % |
| 1 | Yes Bank Ltd. | 10,136.06 | 91.76% | 8.10% | 0.15% |
| 2 | Axis Bank Ltd. | 3,513.35 | 94.37% | 5.47% | 0.15% |
| 3 | ICICI Bank Ltd. | 1,746.59 | 93.94% | 5.90% | 0.16% |
| 4 | HDFC Bank Ltd. | 1,274.80 | 93.94% | 5.92% | 0.14% |
| 5 | State Bank of India | 1,182.78 | 95.17% | 4.65% | 0.17% |
| 6 | Federal Bank Ltd. | 298.92 | 97.04% | 2.81% | 0.15% |
| 7 | Airtel Payments Bank Limited | 203.03 | 93.47% | 6.39% | 0.13% |
| 8 | Indusind Bank Ltd. | 106.98 | 92.58% | 7.27% | 0.14% |
| 9 | Unity Small Finance Bank Limited | 93.44 | 97.04% | 2.82% | 0.15% |
| 10 | Canara Bank | 89.49 | 97.03% | 2.84% | 0.13% |
| 11 | RBL Bank Ltd. | 76.46 | 93.64% | 6.20% | 0.16% |
| 12 | Kotak Mahindra Bank | 67.33 | 95.16% | 4.72% | 0.12% |
| 13 | Tri O Tech Solutions Private Limited | 54.49 | 93.91% | 5.91% | 0.18% |
| 14 | One Mobikwik Systems Limited | 52.02 | 96.69% | 3.19% | 0.12% |
| 15 | NSDL Payments Bank Limited | 39.10 | 93.07% | 6.77% | 0.16% |
| UPI Merchant Category-wise Classification - June'25 (Arranged by Volume) | ||||
|---|---|---|---|---|
| Type | MCC | Description | Volume (in Mn) | Value (in Cr.) |
| High Transacting Categories | 5411 | Groceries And Supermarkets | 2,848.11 | 63,307.98 |
| 5814 | Fast Food Restaurants | 1,144.14 | 13,511.21 | |
| 5812 | Eating Places And Restaurants | 1,102.10 | 18,217.20 | |
| 4814 | Telecommunication Services, Including Local And Long Distance Calls, Credit Card Calls,Callsthrough Use Of Magnetic Stripe Reading Telephones And Faxes | 843.97 | 19,946.50 | |
| 5541 | Service Stations (With Or Without Ancillary Services) | 591.24 | 35,909.85 | |
| 5816 | Digital Goods: Games | 332.94 | 9,749.96 | |
| 5993 | Cigar Shops And Stands | 294.96 | 1,830.37 | |
| 5462 | Bakeries | 260.34 | 3,882.89 | |
| 5912 | Drug Stores And Pharmacies | 255.66 | 10,355.33 | |
| 4900 | Utilities Electric, Gas, Water And Sanitary | 171.01 | 22,670.85 | |
| Medium Transacting Categories | 5451 | Dairies | 169.18 | 4,214.89 |
| 5921 | Package Shops Beer, Wine And Liquor | 147.16 | 6,087.56 | |
| 7322 | Debt Collection Agencies | 146.45 | 86,698.33 | |
| 5441 | Candy, Nut And Confectionery Shops | 103.30 | 1,862.47 | |
| 9399 | Government Services Not Elsewhere Classified | 102.81 | 9,204.87 | |
| 5422 | Freezer And Locker Meat Provisioners | 101.02 | 3,330.13 | |
| 5262 | Online Marketplaces | 93.89 | 6,558.75 | |
| 5813 | Drinking Places (Alcoholic Beverages) Bars, Taverns, Night-Clubs, Cocktail Lounges And Discothques | 86.82 | 3,378.32 | |
| 5412 | Purchase Of Digital Gold | 85.46 | 948.05 | |
| 5691 | Mens And Womens Clothing Shops | 84.31 | 10,383.52 | |
| All Other Categories | 5732 | Electronics Shops | 78.51 | 10,436.88 |
| 7230 | Beauty And Barber Shops | 74.50 | 2,061.71 | |
| 7622 | Electronics Repair Shops | 73.64 | 2,188.37 | |
| 4112 | Passenger Railways | 73.27 | 3,832.89 | |
| 5137 | Mens, Womens And Childrens Uniforms And Commercial Clothing | 67.06 | 6,192.06 | |
| 4121 | Taxi-Cabs And Limousines | 64.53 | 1,202.33 | |
| 5311 | Department Stores | 64.10 | 4,084.54 | |
| 5331 | Variety Stores | 59.18 | 3,216.41 | |
| 6211 | Securities Brokers And Dealers | 56.31 | 43,986.51 | |
| Others | 2,133.41 | 2,73,621.49 | ||
| Total | 11,709.38 | 6,82,872.22 | ||
| State-wise UPI Product Statistics* (June'25) | |||||
|---|---|---|---|---|---|
| Sr. No. | State / Union Territory | Volume (in Mn ) | Volume Contribution (%) | Value (in Cr.) | Value Contribution (%) |
| 1 | MAHARASHTRA | 1,741.88 | 9.47% | 2,11,433.62 | 8.80% |
| 2 | KARNATAKA | 1,000.66 | 5.44% | 1,34,850.46 | 5.61% |
| 3 | UTTAR PRADESH | 972.29 | 5.29% | 1,23,844.58 | 5.15% |
| 4 | TELANGANA | 738.37 | 4.01% | 1,18,822.08 | 4.94% |
| 5 | TAMIL NADU | 699.34 | 3.80% | 1,05,130.55 | 4.37% |
| 6 | ANDHRA PRADESH | 496.56 | 2.70% | 87,072.27 | 3.62% |
| 7 | RAJASTHAN | 478.63 | 2.60% | 69,889.10 | 2.91% |
| 8 | GUJARAT | 440.93 | 2.40% | 64,058.92 | 2.66% |
| 9 | DELHI | 420.11 | 2.28% | 50,811.91 | 2.11% |
| 10 | WEST BENGAL | 396.75 | 2.16% | 57,448.44 | 2.39% |
| 11 | BIHAR | 393.05 | 2.14% | 59,059.01 | 2.46% |
| 12 | MADHYA PRADESH | 386.82 | 2.10% | 52,055.10 | 2.17% |
| 13 | HARYANA | 361.02 | 1.96% | 48,951.40 | 2.04% |
| 14 | KERALA | 332.83 | 1.81% | 46,102.32 | 1.92% |
| 15 | ODISHA | 247.92 | 1.35% | 31,882.11 | 1.33% |
| 16 | PUNJAB | 187.82 | 1.02% | 30,674.02 | 1.28% |
| 17 | ASSAM | 181.11 | 0.98% | 19,849.88 | 0.83% |
| 18 | JHARKHAND | 155.8 | 0.85% | 20,667.56 | 0.86% |
| 19 | CHHATTISGARH | 120.57 | 0.66% | 15,492.34 | 0.64% |
| 20 | UTTARAKHAND | 110.35 | 0.60% | 13,596.45 | 0.57% |
| 21 | JAMMU AND KASHMIR | 76.74 | 0.42% | 9,485.08 | 0.39% |
| 22 | HIMACHAL PRADESH | 58.14 | 0.32% | 7,262.40 | 0.30% |
| 23 | GOA | 28.76 | 0.16% | 4,053.68 | 0.17% |
| 24 | CHANDIGARH | 22.92 | 0.12% | 2,742.47 | 0.11% |
| 25 | ARUNACHAL PRADESH | 17.84 | 0.10% | 2,271.25 | 0.09% |
| 26 | PUDUCHERRY | 16.65 | 0.09% | 2,250.01 | 0.09% |
| 27 | MEGHALAYA | 13.25 | 0.07% | 1,743.02 | 0.07% |
| 28 | TRIPURA | 12.51 | 0.07% | 1,607.37 | 0.07% |
| 29 | MANIPUR | 10.79 | 0.06% | 2,212.05 | 0.09% |
| 30 | NAGALAND | 10.09 | 0.05% | 1,506.22 | 0.06% |
| 31 | MIZORAM | 9.9 | 0.05% | 1,501.27 | 0.06% |
| 32 | DADRA & NAGAR HAVELI & DAMAN & DIU | 9.47 | 0.05% | 1,020.22 | 0.04% |
| 33 | SIKKIM | 7.61 | 0.04% | 973.53 | 0.04% |
| 34 | LADAKH | 4.21 | 0.02% | 680.01 | 0.03% |
| 35 | ANDAMAN & NICOBAR | 3.23 | 0.02% | 481.96 | 0.02% |
| 36 | LAKSHADWEEP | 0.49 | 0.00% | 47.78 | 0.00% |
| 37 | Unclassified# | 8,229.58 | 44.74% | 10,02,400.27 | 41.70% |
| UPI Remitter Members - Top 50 Members (May'25) | |||||||
|---|---|---|---|---|---|---|---|
| Sr. No. | UPI Remitter Members (May-2025) | Total Volume (In Mn) | Approved % | BD % | TD% | Total Debit Reversal Count (In Mn) | Debit Reversal Success % |
| 1 | State Bank of India | 4,972.91 | 93.87% | 5.88% | 0.25% | 12.10 | 95.08% |
| 2 | HDFC Bank Ltd. | 1,512.37 | 95.02% | 4.86% | 0.12% | 2.28 | 99.93% |
| 3 | Bank of Baroda | 1,262.84 | 91.27% | 8.64% | 0.09% | 2.65 | 98.59% |
| 4 | Union Bank of India | 1,168.19 | 93.20% | 6.72% | 0.09% | 2.44 | 94.06% |
| 5 | Punjab National Bank | 1,068.01 | 92.60% | 7.20% | 0.20% | 2.57 | 96.74% |
| 6 | Kotak Mahindra Bank | 927.50 | 92.40% | 7.51% | 0.09% | 1.84 | 61.98% |
| 7 | Canara Bank | 903.21 | 93.09% | 6.84% | 0.07% | 1.87 | 89.90% |
| 8 | Axis Bank Ltd. | 852.60 | 94.85% | 5.15% | 0.00% | 1.38 | 99.76% |
| 9 | ICICI Bank Ltd. | 713.35 | 96.15% | 3.84% | 0.01% | 1.01 | 98.36% |
| 10 | Indian Bank | 593.72 | 92.95% | 6.74% | 0.31% | 1.21 | 90.40% |
| 11 | Bank Of India | 587.21 | 92.56% | 6.44% | 0.99% | 2.86 | 53.96% |
| 12 | India Post Payments Bank Limited | 576.10 | 89.08% | 10.71% | 0.21% | 1.72 | 92.44% |
| 13 | Airtel Payments Bank Limited | 573.79 | 86.66% | 12.92% | 0.42% | 2.11 | 91.48% |
| 14 | Indian Overseas Bank | 298.90 | 92.95% | 6.75% | 0.30% | 0.66 | 96.66% |
| 15 | Central Bank of India | 265.24 | 88.88% | 10.60% | 0.52% | 0.85 | 92.13% |
| 16 | UCO Bank | 259.36 | 91.65% | 8.20% | 0.15% | 0.66 | 89.51% |
| 17 | Federal Bank Ltd. | 251.18 | 93.02% | 6.87% | 0.11% | 0.40 | 98.36% |
| 18 | Fino Payments Bank Ltd. | 213.85 | 88.43% | 11.33% | 0.23% | 0.81 | 72.70% |
| 19 | Bank of Maharashtra | 204.66 | 93.47% | 6.36% | 0.18% | 0.58 | 74.16% |
| 20 | Indusind Bank Ltd. | 203.19 | 90.35% | 9.48% | 0.16% | 0.61 | 74.39% |
| 21 | IDBI Bank Ltd. | 199.11 | 93.43% | 6.10% | 0.47% | 0.72 | 85.19% |
| 22 | Yes Bank Ltd. | 175.35 | 92.04% | 7.87% | 0.09% | 0.26 | 78.73% |
| 23 | Karnataka Bank | 140.77 | 92.33% | 7.45% | 0.21% | 0.34 | 81.09% |
| 24 | IDFC Bank Ltd. | 113.06 | 93.44% | 6.51% | 0.05% | 0.22 | 90.55% |
| 25 | Tri O Tech Solutions Private Limited | 110.06 | 100.00% | 0.00% | 0.00% | - | 0.00% |
| 26 | The Jammu & Kashmir Bank Limited | 96.68 | 92.37% | 6.45% | 1.18% | 0.70 | 38.44% |
| 27 | Karur Vysya Bank | 90.61 | 93.23% | 6.62% | 0.14% | 0.19 | 88.09% |
| 28 | Bandhan Bank limited | 86.69 | 94.47% | 5.29% | 0.24% | 0.28 | 92.82% |
| 29 | AU Small Finance Bank | 73.85 | 90.28% | 9.43% | 0.29% | 0.20 | 89.87% |
| 30 | The South Indian Bank Limited | 69.84 | 94.78% | 5.11% | 0.11% | 0.10 | 98.07% |
| 31 | Punjab and Sind Bank | 56.71 | 91.83% | 7.64% | 0.53% | 0.28 | 79.08% |
| 32 | City Union Bank | 53.56 | 92.11% | 7.72% | 0.17% | 0.09 | 99.07% |
| 33 | Ujjivan Small Finance Bank Limited | 52.91 | 93.19% | 6.62% | 0.19% | 0.13 | 91.42% |
| 34 | Tamilnad Mercantile Bank Limited | 52.51 | 92.78% | 7.05% | 0.17% | 0.09 | 92.46% |
| 35 | JIO Payments Bank Ltd | 52.13 | 83.89% | 15.36% | 0.74% | 0.31 | 86.75% |
| 36 | Baroda U.P. Bank | 45.69 | 91.48% | 6.48% | 2.04% | 0.39 | 35.16% |
| 37 | Kerala Gramin Bank | 44.18 | 91.81% | 7.17% | 1.02% | 0.32 | 68.37% |
| 38 | Telangana Grameena Bank | 37.79 | 88.89% | 10.41% | 0.70% | 0.23 | 72.72% |
| 39 | RBL Bank Ltd. | 35.46 | 93.76% | 5.57% | 0.67% | 0.10 | 61.82% |
| 40 | Maharashtra Gramin Bank | 35.09 | 86.13% | 12.35% | 1.52% | 0.18 | 62.95% |
| 41 | NSDL Payments Bank Limited | 35.02 | 84.06% | 15.48% | 0.45% | 0.17 | 77.48% |
| 42 | Karnataka Gramin Bank | 34.59 | 89.38% | 9.26% | 1.36% | 0.32 | 52.34% |
| 43 | Rajasthan Marudhara Gramin Bank | 32.88 | 86.88% | 12.50% | 0.62% | 0.18 | 33.49% |
| 44 | ESAF Small Finance Bank Ltd | 32.02 | 95.76% | 4.06% | 0.19% | 0.07 | 92.80% |
| 45 | DBS Bank India Limited | 31.69 | 93.36% | 6.53% | 0.12% | 0.06 | 94.01% |
| 46 | Equitas Small Finance Bank | 30.47 | 91.32% | 8.47% | 0.21% | 0.07 | 98.98% |
| 47 | Saraswat Co-operative Bank | 28.72 | 95.09% | 4.88% | 0.04% | 0.05 | 99.03% |
| 48 | Andhra Pragathi Grameena Bank | 28.62 | 84.84% | 12.31% | 2.85% | 0.18 | 38.41% |
| 49 | Standard Chartered Bank | 28.24 | 95.89% | 3.67% | 0.43% | 0.08 | 43.42% |
| 50 | Sarva Haryana Gramin Bank | 26.07 | 90.17% | 6.96% | 2.87% | 0.28 | 43.62% |
| UPI Beneficiary Members - Top 50 Members (May'25) | |||||||
|---|---|---|---|---|---|---|---|
| Sr.No. | UPI Beneficiary Members (May-2025) | Total Volume (In Mn) | Approved % | BD% | TD% | Deemed Approved % | |
| 1 | Yes Bank Ltd. | 7,569.54 | 99.99% | 0.01% | 0.00% | 0.00% | |
| 2 | Axis Bank Ltd. | 1,893.85 | 99.95% | 0.04% | 0.00% | 0.01% | |
| 3 | State Bank of India | 1,851.45 | 99.77% | 0.09% | 0.14% | 0.04% | |
| 4 | HDFC Bank Ltd. | 931.57 | 99.41% | 0.54% | 0.05% | 0.03% | |
| 5 | ICICI Bank Ltd. | 602.95 | 99.77% | 0.20% | 0.03% | 0.01% | |
| 6 | Bank of Baroda | 488.55 | 99.87% | 0.06% | 0.06% | 0.06% | |
| 7 | Union Bank of India | 451.96 | 99.90% | 0.09% | 0.02% | 0.04% | |
| 8 | Punjab National Bank | 428.80 | 99.62% | 0.25% | 0.13% | 0.13% | |
| 9 | Airtel Payments Bank Limited | 423.33 | 98.93% | 0.85% | 0.22% | 0.12% | |
| 10 | Canara Bank | 418.99 | 99.81% | 0.12% | 0.07% | 0.02% | |
| 11 | Federal Bank Ltd. | 392.98 | 99.79% | 0.18% | 0.03% | 0.00% | |
| 12 | Kotak Mahindra Bank | 359.30 | 98.94% | 0.92% | 0.14% | 0.08% | |
| 13 | Indian Bank | 274.77 | 99.42% | 0.27% | 0.31% | 0.10% | |
| 14 | India Post Payments Bank Limited | 257.72 | 98.52% | 1.01% | 0.47% | 0.05% | |
| 15 | Bank Of India | 250.87 | 98.20% | 0.94% | 0.86% | 0.30% | |
| 16 | Indusind Bank Ltd. | 176.40 | 99.54% | 0.28% | 0.18% | 0.11% | |
| 17 | Indian Overseas Bank | 148.53 | 99.42% | 0.44% | 0.14% | 0.13% | |
| 18 | Central Bank of India | 123.28 | 99.08% | 0.56% | 0.37% | 0.14% | |
| 19 | UCO Bank | 110.33 | 99.41% | 0.42% | 0.17% | 0.02% | |
| 20 | RBL Bank Ltd. | 101.36 | 99.63% | 0.05% | 0.32% | 0.26% | |
| 21 | Fino Payments Bank Ltd. | 100.21 | 98.22% | 1.65% | 0.13% | 0.11% | |
| 22 | IDBI Bank Ltd. | 96.22 | 99.40% | 0.24% | 0.37% | 0.11% | |
| 23 | Bank of Maharashtra | 86.07 | 99.47% | 0.42% | 0.11% | 0.08% | |
| 24 | Unity Small Finance Bank Limited | 75.73 | 100.00% | 0.00% | 0.00% | 0.00% | |
| 25 | Karnataka Bank | 74.49 | 99.37% | 0.31% | 0.32% | 0.05% | |
| 26 | The Jammu & Kashmir Bank Limited | 53.93 | 98.92% | 0.71% | 0.37% | 0.27% | |
| 27 | One Mobikwik Systems Limited | 52.33 | 99.93% | 0.00% | 0.07% | 0.00% | |
| 28 | NSDL Payments Bank Limited | 50.90 | 99.49% | 0.38% | 0.13% | 0.03% | |
| 29 | Tri O Tech Solutions Private Limited | 50.44 | 99.03% | 0.95% | 0.02% | 0.00% | |
| 30 | Bandhan Bank limited | 49.45 | 99.37% | 0.37% | 0.26% | 0.04% | |
| 31 | IDFC Bank Ltd. | 46.74 | 98.83% | 1.10% | 0.07% | 0.02% | |
| 32 | Karur Vysya Bank | 43.15 | 99.67% | 0.22% | 0.12% | 0.03% | |
| 33 | The South Indian Bank Limited | 42.94 | 99.87% | 0.12% | 0.01% | 0.00% | |
| 34 | Tamilnad Mercantile Bank Limited | 37.27 | 99.61% | 0.26% | 0.14% | 0.02% | |
| 35 | AU Small Finance Bank | 33.40 | 99.30% | 0.51% | 0.20% | 0.02% | |
| 36 | JIO Payments Bank Ltd | 31.76 | 99.06% | 0.58% | 0.36% | 0.15% | |
| 37 | City Union Bank | 31.51 | 99.42% | 0.33% | 0.25% | 0.01% | |
| 38 | Punjab and Sind Bank | 25.66 | 97.76% | 1.78% | 0.46% | 0.09% | |
| 39 | Ujjivan Small Finance Bank Limited | 25.63 | 99.68% | 0.22% | 0.10% | 0.12% | |
| 40 | Kerala Gramin Bank | 25.62 | 98.81% | 0.51% | 0.68% | 0.53% | |
| 41 | Suryoday Small Finance Bank Limited | 22.44 | 98.71% | 1.10% | 0.19% | 0.22% | |
| 42 | Citi Bank | 21.92 | 99.66% | 0.26% | 0.08% | 0.01% | |
| 43 | Baroda U.P. Bank | 21.87 | 98.49% | 0.23% | 1.28% | 0.41% | |
| 44 | Telangana Grameena Bank | 17.48 | 99.30% | 0.41% | 0.30% | 0.11% | |
| 45 | Karnataka Gramin Bank | 15.71 | 99.00% | 0.22% | 0.78% | 0.58% | |
| 46 | Maharashtra Gramin Bank | 14.99 | 98.61% | 0.11% | 1.28% | 0.08% | |
| 47 | ESAF Small Finance Bank Ltd | 14.55 | 99.65% | 0.20% | 0.15% | 0.02% | |
| 48 | Equitas Small Finance Bank | 14.22 | 97.72% | 1.84% | 0.44% | 0.00% | |
| 49 | Andhra Pragathi Grameena Bank | 13.58 | 97.27% | 0.74% | 1.99% | 0.32% | |
| 50 | Rajasthan Marudhara Gramin Bank | 13.15 | 97.89% | 1.81% | 0.30% | 0.15% | |
| UPI Apps (May'25) | |||||||||
|---|---|---|---|---|---|---|---|---|---|
| Sr.No. | Application Name | Customer Initiated Transactions | B2C Transactions | B2B Transactions | Total | ||||
| Volume (Mn) | Value (Cr) | Volume (Mn) | Value (Cr) | Volume (Mn) | Value (Cr) | Volume (Mn) | Value (Cr) | ||
| 1 | Phone Pe # | 8682.08 | 1256541.09 | 0.00 | 0.00 | 0.00 | 0.00 | 8682.08 | 1256541.09 |
| 2 | Google Pay # | 6740.42 | 884735.12 | 0.00 | 0.00 | 0.00 | 0.00 | 6740.42 | 884735.12 |
| 3 | Paytm # | 1277.56 | 138068.97 | 0.00 | 0.00 | 0.00 | 0.00 | 1277.56 | 138068.97 |
| 4 | Navi # | 386.21 | 21350.35 | 0.00 | 0.00 | 0.00 | 0.00 | 386.21 | 21350.35 |
| 5 | super.money # | 203.42 | 7054.28 | 0.00 | 0.00 | 0.00 | 0.00 | 203.42 | 7054.28 |
| 6 | Cred # | 141.95 | 55242.72 | 0.00 | 0.00 | 0.00 | 0.00 | 141.95 | 55242.72 |
| 7 | Axis Bank Apps | 23.10 | 5427.15 | 96.92 | 4253.72 | 0.01 | 2.95 | 120.03 | 9683.82 |
| 8 | FamApp by Trio # | 110.38 | 1415.40 | 0.00 | 0.00 | 0.00 | 0.00 | 110.38 | 1415.40 |
| 9 | Amazon Pay # | 98.68 | 10343.44 | 0.00 | 0.00 | 0.00 | 0.00 | 98.68 | 10343.44 |
| 10 | Whatsapp # | 70.19 | 5280.89 | 0.00 | 0.00 | 0.00 | 0.00 | 70.19 | 5280.89 |
| 11 | BHIM # | 64.60 | 11243.73 | 0.00 | 0.00 | 0.00 | 0.00 | 64.60 | 11243.73 |
| 12 | HDFC Bank Apps | 48.10 | 14798.07 | 15.08 | 7.04 | 0.01 | 1.49 | 63.19 | 14806.60 |
| 13 | Kotak Mahindra Bank Apps | 59.74 | 7862.60 | 0.00 | 0.00 | 0.00 | 0.00 | 59.74 | 7862.60 |
| 14 | ICICI Bank Apps | 57.17 | 14783.71 | 0.01 | 13.90 | 2.29 | 1891.92 | 59.47 | 16689.54 |
| 15 | Yes Bank Apps | 53.19 | 9496.55 | 0.01 | 0.02 | 0.33 | 22.40 | 53.52 | 9518.96 |
| 16 | Mobikwik # | 33.92 | 4674.33 | 0.00 | 0.00 | 0.00 | 0.00 | 33.92 | 4674.33 |
| 17 | Airtel Payments Bank Apps | 20.14 | 1447.34 | 0.00 | 0.01 | 0.00 | 0.00 | 20.14 | 1447.35 |
| 18 | Slice Small Finance Bank Apps | 19.85 | 2330.20 | 0.00 | 0.00 | 0.00 | 0.02 | 19.85 | 2330.22 |
| 19 | India Post Payments Bank Apps | 16.51 | 1834.83 | 0.00 | 0.00 | 0.00 | 0.00 | 16.51 | 1834.83 |
| 20 | IDFC Bank Apps | 16.19 | 2493.14 | 0.00 | 0.02 | 0.02 | 0.12 | 16.21 | 2493.29 |
| 21 | Pop Club # | 13.59 | 500.88 | 0.00 | 0.00 | 0.00 | 0.00 | 13.59 | 500.88 |
| 22 | State Bank of India Apps | 13.48 | 3700.30 | 0.00 | 0.00 | 0.00 | 0.00 | 13.48 | 3700.30 |
| 23 | RBL Bank Apps | 13.17 | 1744.69 | 0.00 | 0.13 | 0.10 | 17.60 | 13.27 | 1762.42 |
| 24 | Groww # | 12.14 | 8443.05 | 0.00 | 0.00 | 0.00 | 0.00 | 12.14 | 8443.05 |
| 25 | Bajaj Finserv | 10.67 | 2219.95 | 0.00 | 0.00 | 0.00 | 0.00 | 10.67 | 2219.95 |
| 26 | Samsung Pay | 9.14 | 656.92 | 0.00 | 0.00 | 0.00 | 0.00 | 9.14 | 656.92 |
| 27 | Jupiter Money | 6.40 | 950.85 | 0.00 | 0.00 | 0.00 | 0.00 | 6.40 | 950.85 |
| 28 | Federal Bank Apps | 5.09 | 982.11 | 0.00 | 0.00 | 0.00 | 0.00 | 5.09 | 982.11 |
| 29 | Jio Payments Bank Apps | 4.70 | 341.19 | 0.00 | 0.00 | 0.00 | 0.00 | 4.70 | 341.19 |
| 30 | Deutsche Bank Apps | 4.02 | 723.74 | 0.00 | 0.00 | 0.00 | 0.14 | 4.02 | 723.88 |
| 31 | Timepay # | 3.90 | 50.01 | 0.00 | 0.00 | 0.00 | 0.00 | 3.90 | 50.01 |
| 32 | Canara Bank Apps | 3.85 | 992.90 | 0.00 | 0.00 | 0.00 | 0.00 | 3.85 | 992.90 |
| 33 | Punjab National Bank Apps | 3.60 | 953.88 | 0.00 | 0.00 | 0.00 | 0.00 | 3.60 | 953.88 |
| 34 | Kiwi # | 3.58 | 428.68 | 0.00 | 0.00 | 0.00 | 0.00 | 3.58 | 428.68 |
| 35 | Flipkart UPI # | 3.23 | 187.83 | 0.00 | 0.00 | 0.00 | 0.00 | 3.23 | 187.83 |
| 36 | Standard Chartered Bank Apps | 2.75 | 172.79 | 0.00 | 0.00 | 0.27 | 7.77 | 3.02 | 180.55 |
| 37 | Fi Money # | 2.99 | 407.88 | 0.00 | 0.00 | 0.00 | 0.00 | 2.99 | 407.88 |
| 38 | Shri Ram One # | 2.58 | 165.88 | 0.00 | 0.00 | 0.00 | 0.00 | 2.58 | 165.88 |
| 39 | Jammu and Kashmir Bank Apps | 2.36 | 308.47 | 0.00 | 0.00 | 0.00 | 0.00 | 2.36 | 308.47 |
| 40 | IndusInd Bank Apps | 1.99 | 258.89 | 0.00 | 0.00 | 0.00 | 0.00 | 1.99 | 258.89 |
| 41 | Bank of Baroda Apps | 1.80 | 528.32 | 0.00 | 0.00 | 0.00 | 0.00 | 1.80 | 528.32 |
| 42 | Omni Card # | 1.63 | 92.27 | 0.00 | 0.00 | 0.00 | 0.00 | 1.63 | 92.27 |
| 43 | Central Bank of India Apps | 1.56 | 268.09 | 0.00 | 0.00 | 0.00 | 0.00 | 1.56 | 268.09 |
| 44 | Ind Money # | 1.30 | 560.96 | 0.00 | 0.00 | 0.00 | 0.00 | 1.30 | 560.96 |
| 45 | Suryoday Bank Apps | 1.24 | 214.28 | 0.00 | 0.00 | 0.01 | 4.18 | 1.25 | 218.46 |
| 46 | DBS Digibank Apps | 1.04 | 224.55 | 0.00 | 0.00 | 0.02 | 2.10 | 1.06 | 226.65 |
| 47 | HSBC Bank Apps | 1.01 | 123.87 | 0.01 | 0.27 | 0.00 | 0.22 | 1.03 | 124.36 |
| 48 | Digikhata | 0.87 | 282.69 | 0.00 | 0.00 | 0.00 | 0.00 | 0.87 | 282.69 |
| 49 | Indian Bank Apps | 0.80 | 202.18 | 0.00 | 0.00 | 0.00 | 0.00 | 0.80 | 202.18 |
| 50 | One Card # | 0.80 | 954.81 | 0.00 | 0.00 | 0.00 | 0.00 | 0.80 | 954.81 |
| 51 | Bharat Pe # | 0.74 | 58.21 | 0.00 | 0.00 | 0.00 | 0.00 | 0.74 | 58.21 |
| 52 | Union Bank Apps | 0.73 | 241.85 | 0.00 | 0.00 | 0.00 | 0.00 | 0.73 | 241.85 |
| 53 | South Indian Bank Apps | 0.71 | 211.09 | 0.00 | 0.00 | 0.00 | 0.00 | 0.71 | 211.09 |
| 54 | AU Small Finance Bank Apps | 0.60 | 184.67 | 0.00 | 0.00 | 0.00 | 0.00 | 0.60 | 184.67 |
| 55 | ESAF Small Finance Bank Apps | 0.57 | 63.39 | 0.00 | 0.00 | 0.00 | 0.00 | 0.57 | 63.39 |
| 56 | Fino Payments Bank Apps | 0.54 | 56.90 | 0.00 | 0.00 | 0.00 | 0.00 | 0.54 | 56.90 |
| 57 | Aditya Birla Capital Digital # | 0.49 | 26.92 | 0.00 | 0.00 | 0.00 | 0.00 | 0.49 | 26.92 |
| 58 | UCO Bank Apps | 0.48 | 122.06 | 0.00 | 0.00 | 0.00 | 0.00 | 0.48 | 122.06 |
| 59 | Tata Neu # | 0.45 | 132.55 | 0.00 | 0.00 | 0.00 | 0.00 | 0.45 | 132.55 |
| 60 | Salary Se # | 0.43 | 20.47 | 0.00 | 0.00 | 0.00 | 0.00 | 0.43 | 20.47 |
| 61 | Money View # | 0.32 | 31.91 | 0.00 | 0.00 | 0.00 | 0.00 | 0.32 | 31.91 |
| 62 | Kredit Pe # | 0.32 | 35.29 | 0.00 | 0.00 | 0.00 | 0.00 | 0.32 | 35.29 |
| 63 | Bank of India Apps | 0.30 | 91.04 | 0.00 | 0.00 | 0.00 | 0.00 | 0.30 | 91.04 |
| 64 | Indian Overseas Bank Apps | 0.27 | 64.81 | 0.00 | 0.00 | 0.00 | 0.00 | 0.27 | 64.81 |
| 65 | Karnataka Bank Apps | 0.25 | 59.72 | 0.00 | 0.00 | 0.00 | 0.00 | 0.25 | 59.72 |
| 66 | Spice Money | 0.20 | 14.26 | 0.00 | 0.00 | 0.00 | 0.00 | 0.20 | 14.26 |
| 67 | Dhani | 0.17 | 8.63 | 0.00 | 0.00 | 0.00 | 0.00 | 0.17 | 8.63 |
| 68 | NSDL Payments Bank Apps | 0.16 | 16.23 | 0.00 | 0.00 | 0.00 | 0.02 | 0.17 | 16.25 |
| 69 | Rapipay | 0.17 | 19.16 | 0.00 | 0.00 | 0.00 | 0.00 | 0.17 | 19.16 |
| 70 | IDBI Bank Apps | 0.13 | 49.81 | 0.00 | 0.00 | 0.00 | 0.00 | 0.13 | 49.81 |
| 71 | Ultracash # | 0.10 | 7.77 | 0.00 | 0.00 | 0.00 | 0.00 | 0.10 | 7.77 |
| 72 | True Balance | 0.10 | 3.01 | 0.00 | 0.00 | 0.00 | 0.00 | 0.10 | 3.01 |
| 73 | Karur Vysya Bank Apps | 0.10 | 35.02 | 0.00 | 0.00 | 0.00 | 0.00 | 0.10 | 35.02 |
| 74 | Tamilnad Mercantile Bank Apps | 0.09 | 32.95 | 0.00 | 0.00 | 0.00 | 0.00 | 0.09 | 32.95 |
| 75 | Niyo Global # | 0.07 | 25.75 | 0.00 | 0.00 | 0.00 | 0.00 | 0.07 | 25.75 |
| 76 | City Union Bank Apps | 0.07 | 29.97 | 0.00 | 0.00 | 0.00 | 0.00 | 0.07 | 29.97 |
| 77 | Obopay | 0.06 | 8.77 | 0.00 | 0.00 | 0.00 | 0.00 | 0.06 | 8.77 |
| 78 | Unity Small Finance Bank Apps | 0.06 | 12.79 | 0.00 | 0.00 | 0.00 | 0.00 | 0.06 | 12.79 |
| 79 | Freo # | 0.04 | 2.27 | 0.00 | 0.00 | 0.00 | 0.00 | 0.04 | 2.27 |
| 80 | Payworld | 0.03 | 2.21 | 0.00 | 0.00 | 0.00 | 0.00 | 0.03 | 2.21 |
| 81 | Punjab Sind Bank Apps | 0.02 | 8.87 | 0.00 | 0.00 | 0.00 | 0.00 | 0.02 | 8.87 |
| 82 | Bank of Maharashtra Apps | 0.02 | 7.44 | 0.00 | 0.00 | 0.00 | 0.00 | 0.02 | 7.44 |
| 83 | Others | 1.76 | 235.74 | 0.00 | 0.00 | 0.12 | 5.04 | 1.87 | 240.77 |
Note:-
| UPI P2P and P2M Transactions | ||||||
|---|---|---|---|---|---|---|
| Month | Total | P2P | P2M | |||
| Volume (Mn) | Value (Cr) | Volume (Mn) | Value (Cr) | Volume (Mn) | Value (Cr) | |
| May-25 | 18,677.46 | 25,14,297.01 | 6,823.80 | 18,17,672.02 | 11,853.66 | 6,96,624.99 |
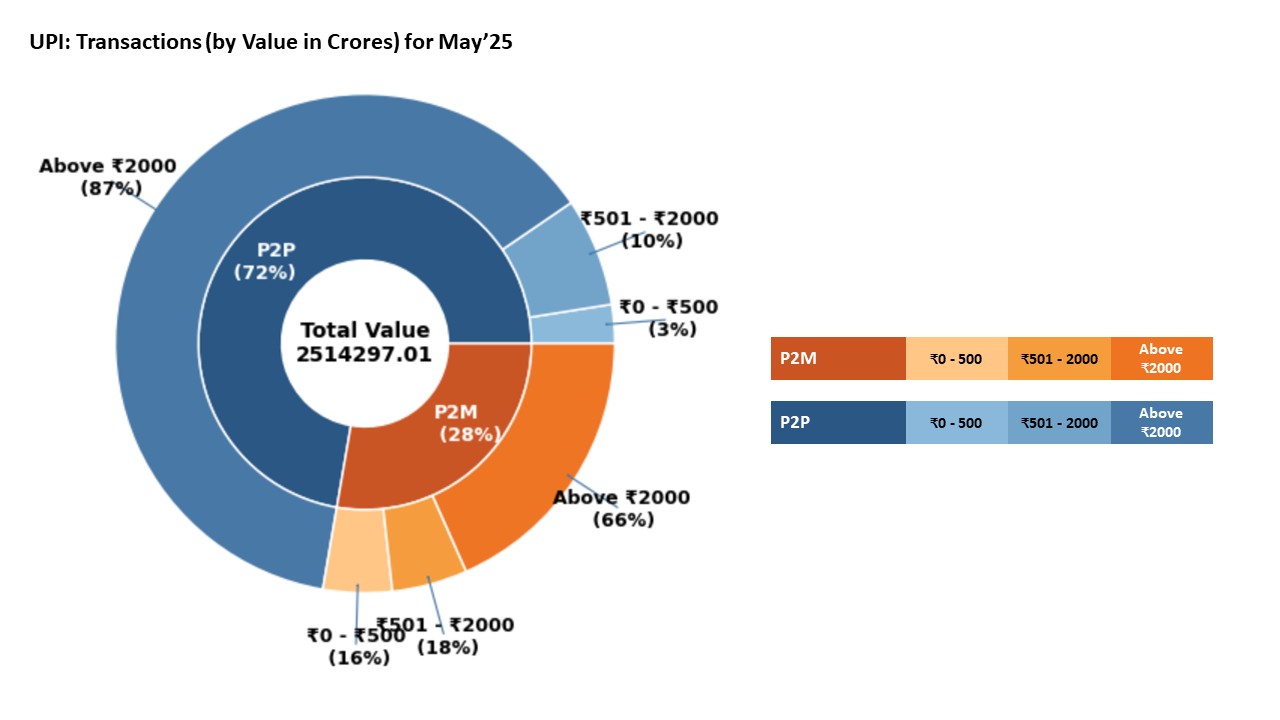

| UPI Payer PSP Performance (May'25) | |||||
|---|---|---|---|---|---|
| Sr. No. | Payer PSP | Total Volume (In Mn) | Approved % | BD % | TD % |
| 1 | Yes Bank Ltd. | 6,249.31 | 91.91% | 8.02% | 0.07% |
| 2 | Axis Bank Ltd. | 6,243.68 | 93.26% | 6.66% | 0.08% |
| 3 | ICICI Bank Ltd. | 3,429.87 | 92.48% | 7.44% | 0.08% |
| 4 | HDFC Bank Ltd. | 1,903.95 | 94.32% | 5.63% | 0.05% |
| 5 | State Bank of India | 1,814.30 | 95.37% | 4.54% | 0.09% |
| 6 | Tri O Tech Solutions Private Limited | 110.06 | 100.00% | 0.00% | 0.00% |
| 7 | BHIM | 74.53 | 95.27% | 4.61% | 0.12% |
| 8 | Kotak Mahindra Bank | 60.08 | 100.00% | 0.00% | 0.00% |
| 9 | RBL Bank Ltd. | 21.94 | 98.10% | 1.86% | 0.04% |
| 10 | Airtel Payments Bank Limited | 20.85 | 96.64% | 3.29% | 0.06% |
| 11 | North East Small Finance Bank Ltd | 20.22 | 97.42% | 2.54% | 0.04% |
| 12 | IDFC Bank Ltd. | 17.11 | 99.81% | 0.19% | 0.00% |
| 13 | India Post Payments Bank Limited | 16.51 | 100.00% | 0.00% | 0.00% |
| 14 | One Mobikwik Systems Limited | 13.66 | 100.00% | 0.00% | 0.00% |
| 15 | Federal Bank Ltd. | 8.30 | 98.83% | 1.14% | 0.03% |
| UPI Payee PSP Performance (May'25) | |||||
|---|---|---|---|---|---|
| Sr. No. | Payee PSP | Total Volume (In Mn) | Approved % | BD % | TD % |
| 1 | Yes Bank Ltd. | 10,200.44 | 91.74% | 8.18% | 0.08% |
| 2 | Axis Bank Ltd. | 3,662.85 | 94.45% | 5.48% | 0.07% |
| 3 | ICICI Bank Ltd. | 1,759.20 | 93.94% | 5.98% | 0.08% |
| 4 | HDFC Bank Ltd. | 1,279.85 | 93.88% | 6.06% | 0.06% |
| 5 | State Bank of India | 1,182.71 | 95.24% | 4.69% | 0.07% |
| 6 | Federal Bank Ltd. | 320.29 | 96.92% | 3.02% | 0.06% |
| 7 | Airtel Payments Bank Limited | 184.27 | 94.29% | 5.64% | 0.07% |
| 8 | Indusind Bank Ltd. | 116.59 | 93.24% | 6.70% | 0.07% |
| 9 | RBL Bank Ltd. | 103.75 | 92.94% | 6.94% | 0.11% |
| 10 | Canara Bank | 89.00 | 97.07% | 2.88% | 0.05% |
| 11 | Kotak Mahindra Bank | 82.50 | 94.77% | 5.16% | 0.07% |
| 12 | Unity Small Finance Bank Limited | 78.29 | 96.86% | 3.08% | 0.06% |
| 13 | One Mobikwik Systems Limited | 54.02 | 96.74% | 3.20% | 0.06% |
| 14 | Tri O Tech Solutions Private Limited | 52.97 | 94.00% | 5.92% | 0.08% |
| 15 | NSDL Payments Bank Limited | 43.57 | 93.38% | 6.53% | 0.10% |
| UPI Merchant Category-wise Classification - May'25 (Arranged by Volume) | ||||
|---|---|---|---|---|
| Type | MCC | Description | Volume (in Mn) | Value (in Cr.) |
| High Transacting Categories | 5411 | Groceries And Supermarkets | 2,826.09 | 64,483.81 |
| 5814 | Fast Food Restaurants | 1,160.30 | 14,132.00 | |
| 5812 | Eating Places And Restaurants | 1,133.93 | 18,755.38 | |
| 4814 | Telecommunication Services, Including Local And Long Distance Calls, Credit Card Calls,Callsthrough Use Of Magnetic Stripe Reading Telephones And Faxes | 879.66 | 19,907.48 | |
| 5541 | Service Stations (With Or Without Ancillary Services) | 590.57 | 36,592.74 | |
| 5816 | Digital Goods: Games | 420.82 | 10,634.88 | |
| 5993 | Cigar Shops And Stands | 290.88 | 1,888.90 | |
| 5462 | Bakeries | 257.12 | 3,865.32 | |
| 5912 | Drug Stores And Pharmacies | 251.91 | 10,306.01 | |
| 4900 | Utilities Electric, Gas, Water And Sanitary | 176.13 | 21,702.00 | |
| Medium Transacting Categories | 5451 | Dairies | 172.62 | 4,452.53 |
| 7322 | Debt Collection Agencies | 145.47 | 90,133.03 | |
| 5921 | Package Shops Beer, Wine And Liquor | 141.16 | 6,035.54 | |
| 5441 | Candy, Nut And Confectionery Shops | 104.43 | 1,925.94 | |
| 5422 | Freezer And Locker Meat Provisioners | 100.89 | 3,360.59 | |
| 9399 | Government Services Not Elsewhere Classified | 98.24 | 8,821.95 | |
| 5262 | Online Marketplaces | 90.97 | 6,342.46 | |
| 5813 | Drinking Places (Alcoholic Beverages) Bars, Taverns, Night-Clubs, Cocktail Lounges And Discothques | 86.39 | 3,409.77 | |
| 5691 | Mens And Womens Clothing Shops | 82.55 | 11,092.78 | |
| 5412 | Purchase Of Digital Gold | 79.43 | 983.24 | |
| All Other Categories | 5732 | Electronics Shops | 78.81 | 11,012.13 |
| 7230 | Beauty And Barber Shops | 74.89 | 2,202.25 | |
| 7622 | Electronics Repair Shops | 74.82 | 2,313.50 | |
| 4112 | Passenger Railways | 71.39 | 3,731.24 | |
| 5137 | Mens, Womens And Childrens Uniforms And Commercial Clothing | 71.34 | 7,176.69 | |
| 5311 | Department Stores | 67.96 | 4,525.50 | |
| 4121 | Taxi-Cabs And Limousines | 64.09 | 1,226.37 | |
| 5331 | Variety Stores | 61.00 | 3,562.05 | |
| 5651 | Family Clothing Shops | 54.93 | 4,900.77 | |
| Others | 2,144.87 | 3,17,148.14 | ||
| Total | 11,853.66 | 6,96,624.99 | ||
| State-wise UPI Product Statistics* (May'25) | |||||
|---|---|---|---|---|---|
| Sr. No. | State / Union Territory | Volume (in Mn ) | Volume Contribution (%) | Value (in Cr.) | Value Contribution (%) |
| 1 | MAHARASHTRA | 2,463.88 | 13.19% | 2,97,260.99 | 11.82% |
| 2 | KARNATAKA | 1,443.05 | 7.73% | 2,00,378.42 | 7.97% |
| 3 | UTTAR PRADESH | 1,401.43 | 7.50% | 1,82,118.99 | 7.24% |
| 4 | TELANGANA | 1,088.58 | 5.83% | 1,74,971.59 | 6.96% |
| 5 | TAMIL NADU | 859.85 | 4.60% | 1,30,583.67 | 5.19% |
| 6 | RAJASTHAN | 763.44 | 4.09% | 1,12,439.70 | 4.47% |
| 7 | MADHYA PRADESH | 688.25 | 3.68% | 92,795.08 | 3.69% |
| 8 | ANDHRA PRADESH | 681.45 | 3.65% | 1,19,081.99 | 4.74% |
| 9 | BIHAR | 677.10 | 3.63% | 98,286.45 | 3.91% |
| 10 | DELHI | 605.31 | 3.24% | 72,520.26 | 2.88% |
| 11 | GUJARAT | 585.79 | 3.14% | 85,134.34 | 3.39% |
| 12 | WEST BENGAL | 579.06 | 3.10% | 87,037.14 | 3.46% |
| 13 | HARYANA | 462.67 | 2.48% | 65,952.89 | 2.62% |
| 14 | ODISHA | 416.50 | 2.23% | 52,003.42 | 2.07% |
| 15 | KERALA | 397.08 | 2.13% | 56,646.28 | 2.25% |
| 16 | ASSAM | 251.67 | 1.35% | 28,542.68 | 1.14% |
| 17 | JHARKHAND | 229.10 | 1.23% | 30,563.83 | 1.22% |
| 18 | PUNJAB | 224.47 | 1.20% | 38,466.52 | 1.53% |
| 19 | CHHATTISGARH | 170.88 | 0.91% | 21,544.12 | 0.86% |
| 20 | UTTARAKHAND | 141.43 | 0.76% | 17,646.59 | 0.70% |
| 21 | JAMMU AND KASHMIR | 94.39 | 0.51% | 11,815.90 | 0.47% |
| 22 | HIMACHAL PRADESH | 68.39 | 0.37% | 8,430.37 | 0.34% |
| 23 | GOA | 40.10 | 0.21% | 5,659.28 | 0.23% |
| 24 | CHANDIGARH | 32.69 | 0.18% | 4,158.48 | 0.17% |
| 25 | ARUNACHAL PRADESH | 21.01 | 0.11% | 2,768.13 | 0.11% |
| 26 | PUDUCHERRY | 18.93 | 0.10% | 2,644.69 | 0.11% |
| 27 | MEGHALAYA | 16.86 | 0.09% | 2,289.90 | 0.09% |
| 28 | MANIPUR | 15.37 | 0.08% | 3,092.24 | 0.12% |
| 29 | TRIPURA | 14.82 | 0.08% | 1,968.89 | 0.08% |
| 30 | NAGALAND | 12.50 | 0.07% | 1,943.79 | 0.08% |
| 31 | DADRA & NAGAR HAVELI & DAMAN & DIU | 12.48 | 0.07% | 1,306.18 | 0.05% |
| 32 | MIZORAM | 10.92 | 0.06% | 1,750.44 | 0.07% |
| 33 | SIKKIM | 9.76 | 0.05% | 1,358.66 | 0.05% |
| 34 | LADAKH | 4.33 | 0.02% | 724.92 | 0.03% |
| 35 | ANDAMAN & NICOBAR | 3.95 | 0.02% | 630.83 | 0.03% |
| 36 | LAKSHADWEEP | 0.52 | 0.00% | 59.61 | 0.00% |
| 37 | Unclassified# | 4,169.47 | 22.31% | 4,99,719.76 | 19.86% |
| UPI Remitter Members - Top 50 Members (Apr'25) | |||||||
|---|---|---|---|---|---|---|---|
| Sr. No. | UPI Remitter Members (Apr-2025) | Total Volume (In Mn) | Approved % | BD % | TD% | Total Debit Reversal Count (In Mn) | Debit Reversal Success % |
| 1 | State Bank of India | 4,850.52 | 91.83% | 7.42% | 0.75% | 14.48 | 93.18% |
| 2 | HDFC Bank Ltd. | 1,471.20 | 94.26% | 5.74% | 0.00% | 5.69 | 95.45% |
| 3 | Bank of Baroda | 1,243.19 | 89.74% | 10.25% | 0.01% | 3.92 | 93.70% |
| 4 | Union Bank of India | 1,139.95 | 91.34% | 8.18% | 0.47% | 4.32 | 68.02% |
| 5 | Punjab National Bank | 1,033.60 | 90.90% | 8.74% | 0.36% | 4.15 | 87.03% |
| 6 | Kotak Mahindra Bank | 917.25 | 90.42% | 9.58% | 0.00% | 2.27 | 1.20% |
| 7 | Canara Bank | 876.59 | 91.88% | 7.97% | 0.14% | 3.12 | 78.87% |
| 8 | Axis Bank Ltd. | 837.82 | 93.69% | 6.30% | 0.01% | 1.93 | 93.94% |
| 9 | ICICI Bank Ltd. | 697.48 | 95.29% | 4.68% | 0.03% | 1.59 | 91.28% |
| 10 | Indian Bank | 581.43 | 91.50% | 8.50% | 0.00% | 1.57 | 89.24% |
| 11 | Bank Of India | 578.05 | 91.29% | 7.79% | 0.92% | 3.05 | 62.65% |
| 12 | Airtel Payments Bank Limited | 567.67 | 83.13% | 16.41% | 0.46% | 2.57 | 83.11% |
| 13 | India Post Payments Bank Limited | 554.68 | 86.07% | 13.73% | 0.21% | 2.35 | 82.42% |
| 14 | Indian Overseas Bank | 288.12 | 92.05% | 7.73% | 0.22% | 0.88 | 94.06% |
| 15 | Central Bank of India | 260.39 | 85.82% | 13.54% | 0.64% | 1.04 | 82.21% |
| 16 | UCO Bank | 252.89 | 89.27% | 10.40% | 0.33% | 1.00 | 83.06% |
| 17 | Federal Bank Ltd. | 245.91 | 91.50% | 8.49% | 0.00% | 0.54 | 95.94% |
| 18 | Fino Payments Bank Ltd. | 209.14 | 86.54% | 13.35% | 0.10% | 1.03 | 74.62% |
| 19 | Bank of Maharashtra | 205.33 | 92.15% | 7.80% | 0.05% | 0.64 | 84.29% |
| 20 | Indusind Bank Ltd. | 199.26 | 88.17% | 11.74% | 0.10% | 0.73 | 81.98% |
| 21 | IDBI Bank Ltd. | 195.97 | 92.72% | 7.12% | 0.15% | 0.71 | 84.92% |
| 22 | Yes Bank Ltd. | 168.80 | 89.21% | 10.76% | 0.03% | 0.35 | 83.34% |
| 23 | Karnataka Bank | 137.30 | 89.51% | 9.22% | 1.27% | 1.00 | 40.28% |
| 24 | IDFC Bank Ltd. | 111.75 | 91.64% | 8.35% | 0.01% | 0.30 | 86.21% |
| 25 | Tri O Tech Solutions Private Limited | 99.59 | 100.00% | 0.00% | 0.00% | - | 0.00% |
| 26 | The Jammu & Kashmir Bank Limited | 94.27 | 92.37% | 6.58% | 1.05% | 0.94 | 26.83% |
| 27 | Karur Vysya Bank | 87.89 | 92.36% | 7.44% | 0.20% | 0.31 | 75.96% |
| 28 | Bandhan Bank limited | 82.44 | 93.75% | 5.62% | 0.64% | 0.42 | 85.31% |
| 29 | AU Small Finance Bank | 73.95 | 87.39% | 12.34% | 0.27% | 0.34 | 71.56% |
| 30 | The South Indian Bank Limited | 66.92 | 94.08% | 5.91% | 0.01% | 0.27 | 79.98% |
| 31 | Punjab and Sind Bank | 54.50 | 90.17% | 9.36% | 0.47% | 0.29 | 80.90% |
| 32 | City Union Bank | 52.19 | 90.55% | 9.18% | 0.27% | 0.13 | 91.66% |
| 33 | Ujjivan Small Finance Bank Limited | 51.60 | 91.96% | 7.09% | 0.94% | 0.32 | 52.76% |
| 34 | Tamilnad Mercantile Bank Limited | 50.57 | 91.59% | 8.27% | 0.14% | 0.23 | 56.26% |
| 35 | JIO Payments Bank Ltd | 49.43 | 79.30% | 20.13% | 0.58% | 0.36 | 79.43% |
| 36 | Baroda U.P. Bank | 43.04 | 91.80% | 6.80% | 1.40% | 0.37 | 45.96% |
| 37 | Kerala Gramin Bank | 41.93 | 91.12% | 7.68% | 1.20% | 0.28 | 70.10% |
| 38 | RBL Bank Ltd. | 36.09 | 92.76% | 6.80% | 0.45% | 0.14 | 75.67% |
| 39 | Telangana Grameena Bank | 36.07 | 85.88% | 12.91% | 1.21% | 0.32 | 64.78% |
| 40 | Maharashtra Gramin Bank | 35.66 | 84.44% | 12.84% | 2.73% | 0.26 | 56.69% |
| 41 | Karnataka Gramin Bank | 34.52 | 86.08% | 11.12% | 2.80% | 0.51 | 63.66% |
| 42 | Rajasthan Marudhara Gramin Bank | 33.47 | 82.68% | 17.01% | 0.31% | 0.19 | 81.33% |
| 43 | NSDL Payments Bank Limited | 33.14 | 78.01% | 20.66% | 1.32% | 0.24 | 68.58% |
| 44 | DBS Bank India Limited | 31.44 | 91.81% | 8.18% | 0.01% | 0.09 | 88.92% |
| 45 | ESAF Small Finance Bank Ltd | 30.46 | 94.78% | 5.17% | 0.05% | 0.11 | 89.71% |
| 46 | Equitas Small Finance Bank | 30.39 | 90.12% | 9.44% | 0.44% | 0.10 | 82.35% |
| 47 | Saraswat Co-operative Bank | 28.81 | 94.13% | 5.86% | 0.00% | 0.07 | 89.93% |
| 48 | Andhra Pragathi Grameena Bank | 28.12 | 82.07% | 12.71% | 5.22% | 0.64 | 50.54% |
| 49 | Standard Chartered Bank | 27.01 | 94.52% | 4.50% | 0.97% | 0.10 | 53.00% |
| 50 | Sarva Haryana Gramin Bank | 23.95 | 93.23% | 5.04% | 1.73% | 0.24 | 65.23% |
| UPI Beneficiary Members - Top 50 Members (Apr'25) | |||||||
|---|---|---|---|---|---|---|---|
| Sr.No. | UPI Beneficiary Members (Apr-2025) | Total Volume (In Mn) | Approved % | BD% | TD% | Deemed Approved % | |
| 1 | Yes Bank Ltd. | 7,312.77 | 99.99% | 0.01% | 0.00% | 0.00% | |
| 2 | Axis Bank Ltd. | 1,822.48 | 99.95% | 0.05% | 0.00% | 0.01% | |
| 3 | State Bank of India | 1,767.09 | 99.26% | 0.10% | 0.64% | 0.28% | |
| 4 | HDFC Bank Ltd. | 857.29 | 99.17% | 0.81% | 0.02% | 0.12% | |
| 5 | ICICI Bank Ltd. | 565.73 | 99.64% | 0.24% | 0.12% | 0.04% | |
| 6 | Bank of Baroda | 474.07 | 99.90% | 0.07% | 0.03% | 0.07% | |
| 7 | Union Bank of India | 434.62 | 99.43% | 0.10% | 0.47% | 0.15% | |
| 8 | Airtel Payments Bank Limited | 414.65 | 98.77% | 0.97% | 0.26% | 0.12% | |
| 9 | Punjab National Bank | 407.55 | 99.28% | 0.34% | 0.39% | 0.29% | |
| 10 | Canara Bank | 404.64 | 99.67% | 0.14% | 0.19% | 0.06% | |
| 11 | Federal Bank Ltd. | 386.02 | 99.72% | 0.19% | 0.09% | 0.00% | |
| 12 | Kotak Mahindra Bank | 345.82 | 98.92% | 1.04% | 0.04% | 0.04% | |
| 13 | Indian Bank | 264.85 | 99.59% | 0.32% | 0.08% | 0.08% | |
| 14 | Bank Of India | 243.98 | 97.89% | 1.14% | 0.97% | 0.31% | |
| 15 | India Post Payments Bank Limited | 241.01 | 97.74% | 1.29% | 0.98% | 0.13% | |
| 16 | Indusind Bank Ltd. | 177.35 | 99.48% | 0.33% | 0.20% | 0.11% | |
| 17 | Indian Overseas Bank | 140.85 | 99.31% | 0.56% | 0.13% | 0.22% | |
| 18 | Central Bank of India | 117.91 | 98.85% | 0.50% | 0.65% | 0.17% | |
| 19 | UCO Bank | 105.71 | 99.00% | 0.61% | 0.39% | 0.05% | |
| 20 | IDBI Bank Ltd. | 98.27 | 99.62% | 0.25% | 0.13% | 0.06% | |
| 21 | Fino Payments Bank Ltd. | 98.00 | 96.03% | 3.61% | 0.37% | 0.10% | |
| 22 | Bank of Maharashtra | 89.10 | 99.44% | 0.43% | 0.13% | 0.05% | |
| 23 | RBL Bank Ltd. | 85.03 | 99.77% | 0.08% | 0.15% | 0.07% | |
| 24 | Karnataka Bank | 68.10 | 98.10% | 0.36% | 1.54% | 0.45% | |
| 25 | Unity Small Finance Bank Limited | 56.73 | 99.98% | 0.01% | 0.01% | 0.03% | |
| 26 | One Mobikwik Systems Limited | 51.12 | 99.96% | 0.00% | 0.04% | 0.00% | |
| 27 | The Jammu & Kashmir Bank Limited | 51.05 | 99.41% | 0.37% | 0.21% | 0.54% | |
| 28 | Bandhan Bank limited | 47.15 | 98.66% | 0.52% | 0.83% | 0.14% | |
| 29 | IDFC Bank Ltd. | 45.76 | 98.54% | 1.37% | 0.10% | 0.03% | |
| 30 | Tri O Tech Solutions Private Limited | 45.31 | 99.09% | 0.91% | 0.00% | 0.00% | |
| 31 | NSDL Payments Bank Limited | 45.21 | 99.28% | 0.35% | 0.37% | 0.34% | |
| 32 | Karur Vysya Bank | 42.11 | 99.45% | 0.25% | 0.30% | 0.08% | |
| 33 | The South Indian Bank Limited | 40.60 | 99.81% | 0.16% | 0.03% | 0.02% | |
| 34 | Tamilnad Mercantile Bank Limited | 37.32 | 99.73% | 0.08% | 0.19% | 0.13% | |
| 35 | AU Small Finance Bank | 32.90 | 99.22% | 0.53% | 0.25% | 0.12% | |
| 36 | City Union Bank | 30.69 | 98.66% | 1.01% | 0.34% | 0.05% | |
| 37 | JIO Payments Bank Ltd | 28.39 | 99.22% | 0.48% | 0.31% | 0.17% | |
| 38 | Punjab and Sind Bank | 25.15 | 96.48% | 2.56% | 0.96% | 0.11% | |
| 39 | Ujjivan Small Finance Bank Limited | 24.91 | 99.07% | 0.24% | 0.69% | 0.42% | |
| 40 | Kerala Gramin Bank | 23.54 | 98.46% | 0.23% | 1.31% | 0.44% | |
| 41 | Baroda U.P. Bank | 20.22 | 98.86% | 0.26% | 0.87% | 0.36% | |
| 42 | Suryoday Small Finance Bank Limited | 19.78 | 98.43% | 1.18% | 0.40% | 0.26% | |
| 43 | Citi Bank | 18.28 | 99.49% | 0.33% | 0.17% | 0.03% | |
| 44 | Telangana Grameena Bank | 16.35 | 98.83% | 0.48% | 0.69% | 0.22% | |
| 45 | Karnataka Gramin Bank | 15.41 | 97.07% | 0.24% | 2.69% | 1.08% | |
| 46 | Maharashtra Gramin Bank | 14.94 | 97.95% | 0.11% | 1.94% | 0.14% | |
| 47 | Equitas Small Finance Bank | 13.79 | 97.44% | 1.89% | 0.66% | 0.05% | |
| 48 | ESAF Small Finance Bank Ltd | 13.73 | 99.53% | 0.30% | 0.17% | 0.03% | |
| 49 | Andhra Pragathi Grameena Bank | 13.36 | 94.59% | 0.65% | 4.76% | 0.41% | |
| 50 | Rajasthan Marudhara Gramin Bank | 12.86 | 96.74% | 2.97% | 0.29% | 0.05% | |
| UPI Apps (Apr'25) | |||||||||
|---|---|---|---|---|---|---|---|---|---|
| Sr.No. | Application Name | Customer Initiated Transactions | B2C Transactions | B2B Transactions | Total | ||||
| Volume (Mn) | Value (Cr) | Volume (Mn) | Value (Cr) | Volume (Mn) | Value (Cr) | Volume (Mn) | Value (Cr) | ||
| 1 | Phone Pe # | 8,362.31 | 12,05,047.30 | 0.00 | 0.00 | 0.00 | 0.00 | 8,362.31 | 12,05,047.30 |
| 2 | Google Pay # | 6,488.55 | 8,42,628.56 | 0.00 | 0.00 | 0.00 | 0.00 | 6,488.55 | 8,42,628.56 |
| 3 | Paytm # | 1,210.24 | 1,31,153.97 | 0.00 | 0.00 | 0.00 | 0.00 | 1,210.24 | 1,31,153.97 |
| 4 | Navi # | 344.21 | 18,841.19 | 0.00 | 0.00 | 0.00 | 0.00 | 344.21 | 18,841.19 |
| 5 | super.money # | 175.24 | 5,924.95 | 0.00 | 0.00 | 0.00 | 0.00 | 175.24 | 5,924.95 |
| 6 | Cred # | 134.67 | 49,753.00 | 0.00 | 0.00 | 0.00 | 0.00 | 134.67 | 49,753.00 |
| 7 | Axis Bank Apps | 22.18 | 5,281.10 | 97.85 | 3,863.71 | 0.01 | 2.83 | 120.05 | 9,147.64 |
| 8 | FamApp by Trio # | 99.91 | 1,241.80 | 0.00 | 0.00 | 0.00 | 0.00 | 99.91 | 1,241.80 |
| 9 | Amazon Pay # | 98.26 | 9,966.68 | 0.00 | 0.00 | 0.00 | 0.00 | 98.26 | 9,966.68 |
| 10 | Whatsapp # | 67.40 | 5,065.44 | 0.00 | 0.00 | 0.00 | 0.00 | 67.40 | 5,065.44 |
| 11 | ICICI Bank Apps | 55.89 | 14,360.28 | 0.01 | 12.53 | 2.21 | 1,851.16 | 58.11 | 16,223.97 |
| 12 | Kotak Mahindra Bank Apps | 57.73 | 7,681.65 | 0.00 | 0.00 | 0.00 | 0.00 | 57.73 | 7,681.65 |
| 13 | HDFC Bank Apps | 44.47 | 11,941.31 | 12.98 | 5.21 | 0.01 | 1.23 | 57.46 | 11,947.75 |
| 14 | BHIM # | 53.57 | 10,363.27 | 0.00 | 0.00 | 0.00 | 0.00 | 53.57 | 10,363.27 |
| 15 | Yes Bank Apps | 47.98 | 9,039.54 | 0.00 | 0.00 | 0.32 | 19.73 | 48.30 | 9,059.27 |
| 16 | Mobikwik # | 31.70 | 4,277.05 | 0.00 | 0.00 | 0.00 | 0.00 | 31.70 | 4,277.05 |
| 17 | Airtel Payments Bank Apps | 20.40 | 1,416.38 | 0.00 | 0.01 | 0.00 | 0.00 | 20.40 | 1,416.39 |
| 18 | Slice # | 17.81 | 2,119.99 | 0.00 | 0.00 | 0.00 | 0.02 | 17.81 | 2,120.01 |
| 19 | IDFC Bank Apps | 16.01 | 2,430.68 | 0.05 | 4.34 | 0.03 | 0.22 | 16.09 | 2,435.24 |
| 20 | India Post Payments Bank Apps | 14.76 | 1,738.65 | 0.00 | 0.00 | 0.00 | 0.00 | 14.76 | 1,738.65 |
| 21 | RBL Bank Apps | 13.90 | 1,630.61 | 0.00 | 0.14 | 0.19 | 22.38 | 14.09 | 1,653.13 |
| 22 | State Bank of India Apps | 13.16 | 3,524.25 | 0.00 | 0.00 | 0.00 | 0.00 | 13.16 | 3,524.25 |
| 23 | Groww # | 12.37 | 8,788.46 | 0.00 | 0.00 | 0.00 | 0.00 | 12.37 | 8,788.46 |
| 24 | Pop Club # | 10.38 | 445.95 | 0.00 | 0.00 | 0.00 | 0.00 | 10.38 | 445.95 |
| 25 | Bajaj Finserv # | 10.25 | 2,002.37 | 0.00 | 0.00 | 0.00 | 0.00 | 10.25 | 2,002.37 |
| 26 | Samsung Pay # | 8.72 | 619.96 | 0.00 | 0.00 | 0.00 | 0.00 | 8.72 | 619.96 |
| 27 | Jupiter Money # | 6.15 | 900.17 | 0.00 | 0.00 | 0.00 | 0.00 | 6.15 | 900.17 |
| 28 | Federal Bank Apps | 4.89 | 894.05 | 0.00 | 0.00 | 0.00 | 0.00 | 4.89 | 894.05 |
| 29 | Jio Payments Bank Apps | 4.21 | 315.88 | 0.00 | 0.00 | 0.00 | 0.00 | 4.21 | 315.88 |
| 30 | Canara Bank Apps | 3.71 | 970.18 | 0.00 | 0.00 | 0.00 | 0.00 | 3.71 | 970.18 |
| 31 | Deutsche Bank Apps | 3.55 | 647.31 | 0.00 | 0.00 | 0.00 | 0.11 | 3.56 | 647.42 |
| 32 | Flipkart UPI # | 3.47 | 195.89 | 0.00 | 0.00 | 0.00 | 0.00 | 3.47 | 195.89 |
| 33 | Punjab National Bank Apps | 3.40 | 912.54 | 0.00 | 0.00 | 0.00 | 0.00 | 3.40 | 912.54 |
| 34 | Timepay # | 3.12 | 40.66 | 0.00 | 0.00 | 0.00 | 0.00 | 3.12 | 40.66 |
| 35 | Fi Money # | 3.01 | 396.69 | 0.00 | 0.00 | 0.00 | 0.00 | 3.01 | 396.69 |
| 36 | Kiwi # | 2.41 | 297.79 | 0.00 | 0.00 | 0.00 | 0.00 | 2.41 | 297.79 |
| 37 | IndusInd Bank Apps | 2.17 | 345.61 | 0.00 | 0.00 | 0.00 | 0.00 | 2.17 | 345.61 |
| 38 | Jammu and Kashmir Bank Apps | 2.11 | 281.40 | 0.00 | 0.00 | 0.00 | 0.00 | 2.11 | 281.40 |
| 39 | Shri Ram One # | 2.09 | 137.77 | 0.00 | 0.00 | 0.00 | 0.00 | 2.09 | 137.77 |
| 40 | Bank of Baroda Apps | 1.90 | 567.22 | 0.00 | 0.00 | 0.00 | 0.00 | 1.90 | 567.22 |
| 41 | Standard Chartered Bank Apps | 1.72 | 153.33 | 0.00 | 0.00 | 0.18 | 5.07 | 1.90 | 158.39 |
| 42 | Omni Card | 1.57 | 84.95 | 0.00 | 0.00 | 0.00 | 0.00 | 1.57 | 84.95 |
| 43 | Central Bank of India Apps | 1.54 | 263.72 | 0.00 | 0.00 | 0.00 | 0.00 | 1.54 | 263.72 |
| 44 | DBS Digibank Apps | 1.09 | 211.67 | 0.00 | 0.00 | 0.01 | 1.70 | 1.10 | 213.38 |
| 45 | Ind Money # | 1.05 | 541.53 | 0.00 | 0.00 | 0.00 | 0.00 | 1.05 | 541.53 |
| 46 | HSBC Bank Apps | 0.87 | 106.65 | 0.01 | 0.37 | 0.00 | 0.11 | 0.88 | 107.13 |
| 47 | Digikhata | 0.80 | 254.47 | 0.00 | 0.00 | 0.00 | 0.00 | 0.80 | 254.47 |
| 48 | Bharat Pe # | 0.78 | 59.59 | 0.00 | 0.00 | 0.00 | 0.00 | 0.78 | 59.59 |
| 49 | Suryoday Bank Apps | 0.73 | 130.27 | 0.00 | 0.00 | 0.01 | 5.30 | 0.75 | 135.57 |
| 50 | One Card # | 0.74 | 842.35 | 0.00 | 0.00 | 0.00 | 0.00 | 0.74 | 842.35 |
| 51 | Union Bank Apps | 0.72 | 243.46 | 0.00 | 0.00 | 0.00 | 0.00 | 0.72 | 243.46 |
| 52 | Indian Bank Apps | 0.70 | 186.42 | 0.00 | 0.00 | 0.00 | 0.00 | 0.70 | 186.42 |
| 53 | South Indian Bank Apps | 0.68 | 200.19 | 0.00 | 0.00 | 0.00 | 0.00 | 0.68 | 200.19 |
| 54 | Aditya Birla Capital Digital # | 0.63 | 32.69 | 0.00 | 0.00 | 0.00 | 0.00 | 0.63 | 32.69 |
| 55 | AU Small Finance Bank Apps | 0.57 | 178.31 | 0.00 | 0.00 | 0.00 | 0.00 | 0.57 | 178.31 |
| 56 | Fino Payments Bank Apps | 0.51 | 54.60 | 0.00 | 0.00 | 0.00 | 0.00 | 0.51 | 54.60 |
| 57 | UCO Bank Apps | 0.46 | 116.70 | 0.00 | 0.00 | 0.00 | 0.00 | 0.46 | 116.70 |
| 58 | ESAF Small Finance Bank Apps | 0.44 | 52.11 | 0.00 | 0.00 | 0.00 | 0.00 | 0.44 | 52.11 |
| 59 | Tata Neu # | 0.39 | 118.54 | 0.00 | 0.00 | 0.00 | 0.00 | 0.39 | 118.54 |
| 60 | Salary Se # | 0.37 | 17.58 | 0.00 | 0.00 | 0.00 | 0.00 | 0.37 | 17.58 |
| 61 | Bank of India Apps | 0.30 | 90.46 | 0.00 | 0.00 | 0.00 | 0.00 | 0.30 | 90.46 |
| 62 | Indian Overseas Bank Apps | 0.27 | 63.56 | 0.00 | 0.00 | 0.00 | 0.00 | 0.27 | 63.56 |
| 63 | Karnataka Bank Apps | 0.24 | 58.02 | 0.00 | 0.00 | 0.00 | 0.00 | 0.24 | 58.02 |
| 64 | Money View # | 0.23 | 25.72 | 0.00 | 0.00 | 0.00 | 0.00 | 0.23 | 25.72 |
| 65 | Kredit.Pe # | 0.22 | 28.84 | 0.00 | 0.00 | 0.00 | 0.00 | 0.22 | 28.84 |
| 66 | Spice Money | 0.17 | 12.63 | 0.00 | 0.00 | 0.00 | 0.00 | 0.17 | 12.63 |
| 67 | Dhani | 0.16 | 7.15 | 0.00 | 0.00 | 0.00 | 0.00 | 0.16 | 7.15 |
| 68 | Rapipay | 0.15 | 16.93 | 0.00 | 0.00 | 0.00 | 0.00 | 0.15 | 16.93 |
| 69 | IDBI Bank Apps | 0.13 | 47.44 | 0.00 | 0.00 | 0.00 | 0.00 | 0.13 | 47.44 |
| 70 | Niyo Global # | 0.11 | 58.73 | 0.00 | 0.00 | 0.00 | 0.00 | 0.11 | 58.73 |
| 71 | Ultracash # | 0.10 | 8.26 | 0.00 | 0.00 | 0.00 | 0.00 | 0.10 | 8.26 |
| 72 | Karur Vysya Bank Apps | 0.09 | 33.47 | 0.00 | 0.00 | 0.00 | 0.00 | 0.09 | 33.47 |
| 73 | True Balance | 0.09 | 3.02 | 0.00 | 0.00 | 0.00 | 0.00 | 0.09 | 3.02 |
| 74 | Tamilnad Mercantile Bank Apps | 0.09 | 31.21 | 0.00 | 0.00 | 0.00 | 0.00 | 0.09 | 31.21 |
| 75 | City Union Bank Apps | 0.08 | 29.30 | 0.00 | 0.00 | 0.00 | 0.00 | 0.08 | 29.30 |
| 76 | Genwise # | 0.07 | 27.48 | 0.00 | 0.00 | 0.00 | 0.00 | 0.07 | 27.48 |
| 77 | NSDL Payments Bank Apps | 0.06 | 6.78 | 0.00 | 0.00 | 0.00 | 0.00 | 0.06 | 6.78 |
| 78 | Freo # | 0.04 | 2.60 | 0.00 | 0.00 | 0.00 | 0.00 | 0.04 | 2.60 |
| 79 | Obopay | 0.04 | 4.79 | 0.00 | 0.00 | 0.00 | 0.00 | 0.04 | 4.79 |
| 80 | Unity Small Finance Bank Apps | 0.03 | 6.73 | 0.00 | 0.00 | 0.00 | 0.00 | 0.03 | 6.73 |
| 81 | Punjab Sind Bank Apps | 0.03 | 9.50 | 0.00 | 0.00 | 0.00 | 0.00 | 0.03 | 9.50 |
| 82 | Cheq | 0.02 | 1.72 | 0.00 | 0.00 | 0.00 | 0.00 | 0.02 | 1.72 |
| 83 | Bank of Maharashtra Apps | 0.02 | 6.66 | 0.00 | 0.00 | 0.00 | 0.00 | 0.02 | 6.66 |
| 84 | Others | 1.75 | 210.85 | 0.00 | 0.00 | 0.13 | 6.06 | 1.88 | 216.91 |
Note:-
| UPI P2P and P2M Transactions | ||||||
|---|---|---|---|---|---|---|
| Month | Total | P2P | P2M | |||
| Volume (Mn) | Value (Cr) | Volume (Mn) | Value (Cr) | Volume (Mn) | Value (Cr) | |
| Apr-25 | 17,893.42 | 23,94,925.87 | 6,539.82 | 17,31,364.08 | 11,353.60 | 6,63,561.79 |
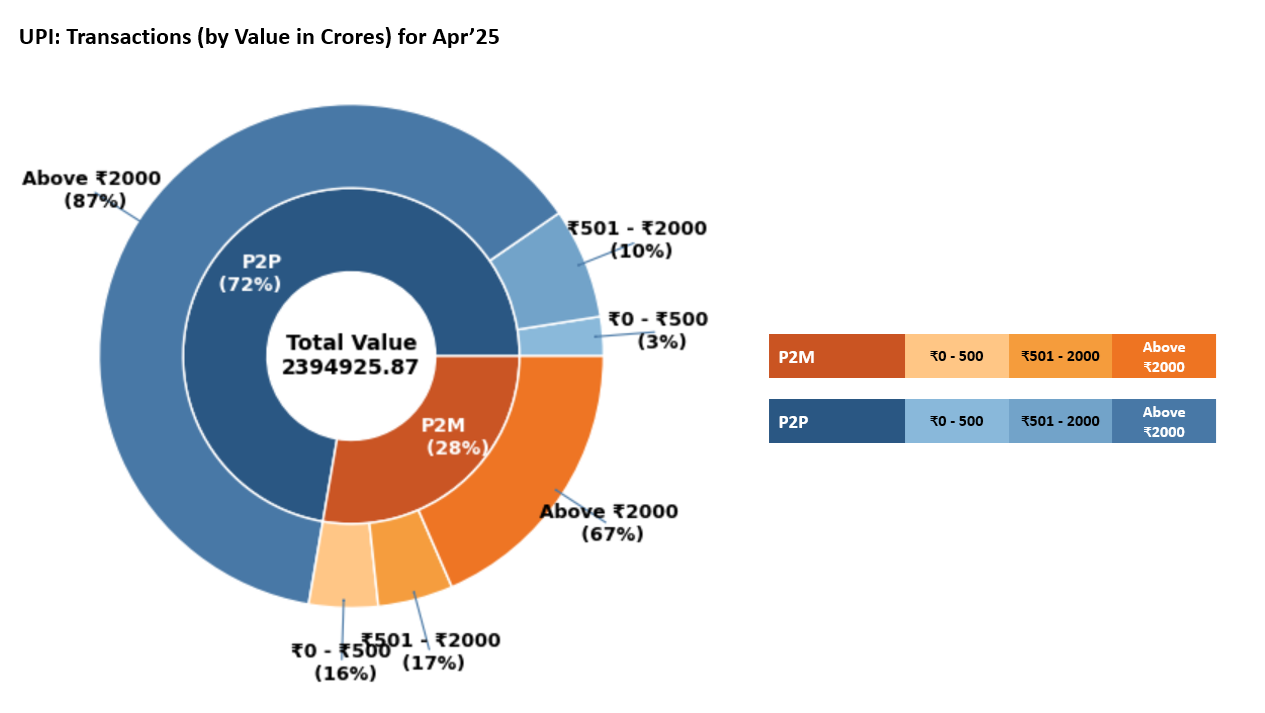
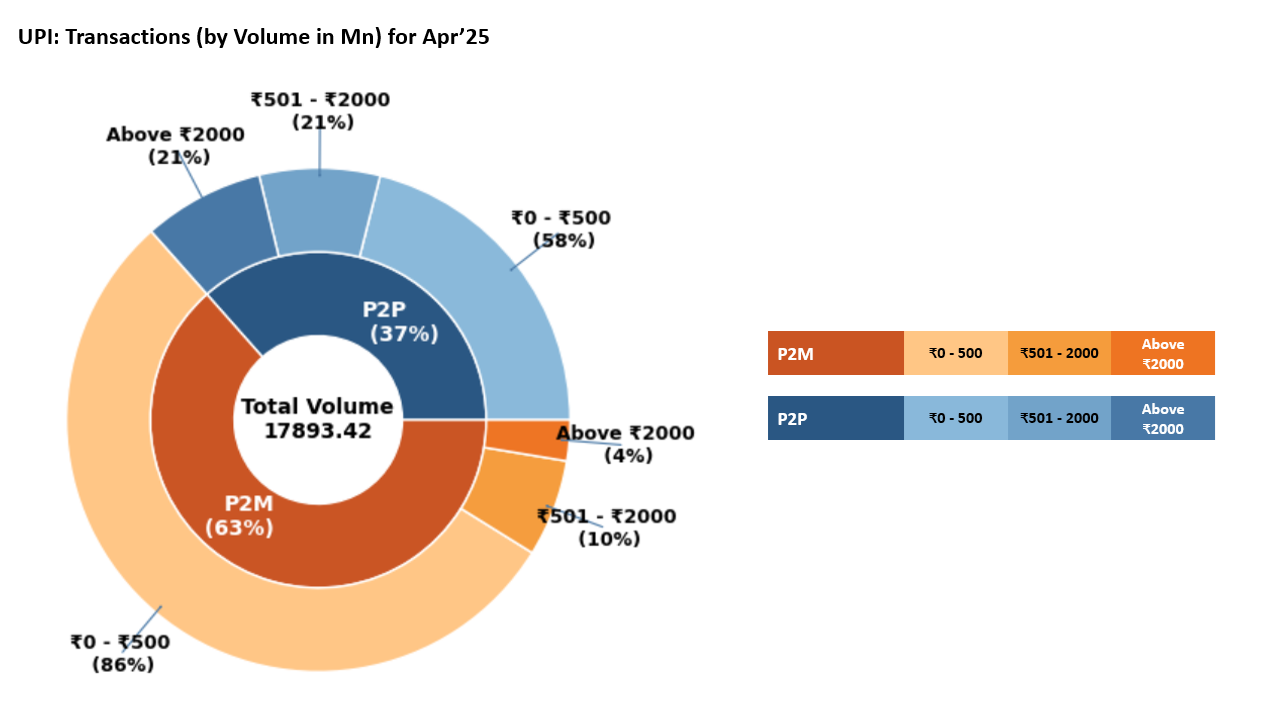
| UPI Payer PSP Performance (April'25) | |||||
|---|---|---|---|---|---|
| Sr. No. | Payer PSP | Total Volume (In Mn) | Approved % | BD % | TD % |
| 1 | Axis Bank Ltd. | 6,387.98 | 91.79% | 7.91% | 0.31% |
| 2 | Yes Bank Ltd. | 5,989.77 | 89.60% | 10.23% | 0.16% |
| 3 | ICICI Bank Ltd. | 3,331.43 | 90.40% | 9.35% | 0.26% |
| 4 | HDFC Bank Ltd. | 1,914.70 | 93.35% | 6.52% | 0.13% |
| 5 | State Bank of India | 1,570.86 | 94.50% | 5.21% | 0.29% |
| 6 | Tri O Tech Solutions Private Limited | 99.59 | 100.00% | 0.00% | 0.00% |
| 7 | BHIM | 63.18 | 94.12% | 5.46% | 0.42% |
| 8 | Kotak Mahindra Bank | 58.08 | 100.00% | 0.00% | 0.00% |
| 9 | RBL Bank Ltd. | 22.69 | 97.91% | 1.97% | 0.12% |
| 10 | Airtel Payments Bank Limited | 21.16 | 96.47% | 3.40% | 0.13% |
| 11 | North East Small Finance Bank Ltd | 17.86 | 97.11% | 2.79% | 0.11% |
| 12 | IDFC Bank Ltd. | 17.05 | 99.80% | 0.20% | 0.01% |
| 13 | India Post Payments Bank Limited | 14.76 | 100.00% | 0.00% | 0.00% |
| 14 | One Mobikwik Systems Limited | 12.70 | 100.00% | 0.00% | 0.00% |
| 15 | Federal Bank Ltd. | 8.17 | 98.76% | 1.17% | 0.08% |
| UPI Payee PSP Performance (April'25) | |||||
|---|---|---|---|---|---|
| Sr. No. | Payee PSP | Total Volume (In Mn) | Approved % | BD % | TD % |
| 1 | Yes Bank Ltd. | 10,184.32 | 88.91% | 10.88% | 0.21% |
| 2 | Axis Bank Ltd. | 3,608.52 | 94.00% | 5.78% | 0.22% |
| 3 | ICICI Bank Ltd. | 1,611.80 | 93.51% | 6.19% | 0.29% |
| 4 | HDFC Bank Ltd. | 1,181.26 | 93.49% | 6.24% | 0.27% |
| 5 | State Bank of India | 1,105.53 | 94.58% | 5.07% | 0.34% |
| 6 | Federal Bank Ltd. | 317.93 | 96.26% | 3.55% | 0.20% |
| 7 | Airtel Payments Bank Limited | 189.83 | 94.22% | 5.58% | 0.20% |
| 8 | Indusind Bank Ltd. | 120.67 | 93.10% | 6.63% | 0.26% |
| 9 | Canara Bank | 86.72 | 96.67% | 3.12% | 0.21% |
| 10 | RBL Bank Ltd. | 86.75 | 92.48% | 7.31% | 0.21% |
| 11 | Kotak Mahindra Bank | 77.92 | 94.52% | 5.28% | 0.20% |
| 12 | Unity Small Finance Bank Limited | 58.99 | 96.44% | 3.41% | 0.15% |
| 13 | One Mobikwik Systems Limited | 52.96 | 96.43% | 3.40% | 0.16% |
| 14 | Tri O Tech Solutions Private Limited | 48.02 | 93.23% | 6.50% | 0.28% |
| 15 | NSDL Payments Bank Limited | 39.53 | 92.21% | 7.66% | 0.13% |
| UPI Merchant Category-wise Classification - Apr'25 (Arranged by Volume) | ||||
|---|---|---|---|---|
| Type | MCC | Description | Volume (in Mn) | Value (in Cr.) |
| High Transacting Categories | 5411 | Groceries And Supermarkets | 2,699.03 | 60,073.81 |
| 5814 | Fast Food Restaurants | 1,104.47 | 13,153.73 | |
| 5812 | Eating Places And Restaurants | 1,072.96 | 17,279.32 | |
| 4814 | Telecommunication Services, Including Local And Long Distance Calls, Credit Card Calls,Callsthrough Use Of Magnetic Stripe Reading Telephones And Faxes | 857.14 | 19,323.48 | |
| 5541 | Service Stations (With Or Without Ancillary Services) | 552.20 | 33,921.33 | |
| 5816 | Digital Goods: Games | 505.37 | 10,530.66 | |
| 5993 | Cigar Shops And Stands | 270.99 | 1,750.68 | |
| 5462 | Bakeries | 240.61 | 3,540.67 | |
| 5912 | Drug Stores And Pharmacies | 239.03 | 9,654.27 | |
| 5451 | Dairies | 172.16 | 4,354.63 | |
| Medium Transacting Categories | 4900 | Utilities Electric, Gas, Water And Sanitary | 162.21 | 18,060.74 |
| 7322 | Debt Collection Agencies | 135.74 | 80,788.65 | |
| 5921 | Package Shops Beer, Wine And Liquor | 109.02 | 4,681.52 | |
| 5441 | Candy, Nut And Confectionery Shops | 100.88 | 1,814.70 | |
| 9399 | Government Services Not Elsewhere Classified | 89.50 | 8,932.49 | |
| 5813 | Drinking Places (Alcoholic Beverages) Bars, Taverns, Night-Clubs, Cocktail Lounges And Discothques | 88.04 | 3,446.07 | |
| 5422 | Freezer And Locker Meat Provisioners | 87.58 | 2,892.29 | |
| 5732 | Electronics Shops | 78.35 | 11,034.98 | |
| 5691 | Mens And Womens Clothing Shops | 77.90 | 10,400.23 | |
| 5262 | Online Marketplaces | 75.76 | 5,170.52 | |
| All Other Categories | 7622 | Electronics Repair Shops | 71.92 | 2,212.60 |
| 7230 | Beauty And Barber Shops | 71.68 | 2,122.10 | |
| 5137 | Mens, Womens And Childrens Uniforms And Commercial Clothing | 70.21 | 7,402.00 | |
| 4112 | Passenger Railways | 68.46 | 3,807.00 | |
| 5412 | Purchase Of Digital Gold | 68.40 | 978.24 | |
| 5311 | Department Stores | 64.10 | 4,306.86 | |
| 4121 | Taxi-Cabs And Limousines | 61.50 | 1,173.21 | |
| 5331 | Variety Stores | 60.50 | 3,435.06 | |
| 6211 | Securities Brokers And Dealers | 53.65 | 48,902.82 | |
| Others | 2,044.24 | 2,68,417.13 | ||
| Total | 11,353.60 | 6,63,561.79 | ||
| State-wise UPI Product Statistics* (April'25) | |||||
|---|---|---|---|---|---|
| Sr. No. | State / Union Territory | Volume (in Mn ) | Volume Contribution (%) | Value (in Cr.) | Value Contribution (%) |
| 1 | MAHARASHTRA | 2,382.34 | 13.31% | 2,78,375.41 | 11.62% |
| 2 | KARNATAKA | 1,263.40 | 7.06% | 1,73,465.79 | 7.24% |
| 3 | UTTAR PRADESH | 1,206.85 | 6.74% | 1,59,811.36 | 6.67% |
| 4 | TELANGANA | 949.72 | 5.31% | 1,47,127.52 | 6.14% |
| 5 | TAMIL NADU | 776.9 | 4.34% | 1,15,363.33 | 4.82% |
| 6 | RAJASTHAN | 668.4 | 3.74% | 98,142.13 | 4.10% |
| 7 | ANDHRA PRADESH | 602.36 | 3.37% | 1,05,315.39 | 4.40% |
| 8 | BIHAR | 577.79 | 3.23% | 82,713.97 | 3.45% |
| 9 | MADHYA PRADESH | 575.99 | 3.22% | 77,961.24 | 3.26% |
| 10 | GUJARAT | 538.57 | 3.01% | 77,374.37 | 3.23% |
| 11 | DELHI | 527 | 2.95% | 64,152.87 | 2.68% |
| 12 | WEST BENGAL | 500.08 | 2.79% | 74,892.26 | 3.13% |
| 13 | HARYANA | 410.35 | 2.29% | 57,581.17 | 2.40% |
| 14 | KERALA | 362.28 | 2.02% | 50,824.24 | 2.12% |
| 15 | ODISHA | 362.01 | 2.02% | 44,717.27 | 1.87% |
| 16 | ASSAM | 218.83 | 1.22% | 25,997.91 | 1.09% |
| 17 | PUNJAB | 212.04 | 1.19% | 34,535.98 | 1.44% |
| 18 | JHARKHAND | 206.06 | 1.15% | 28,022.42 | 1.17% |
| 19 | CHHATTISGARH | 152.75 | 0.85% | 19,636.20 | 0.82% |
| 20 | UTTARAKHAND | 125.79 | 0.70% | 15,444.37 | 0.64% |
| 21 | JAMMU AND KASHMIR | 88.43 | 0.49% | 11,544.77 | 0.48% |
| 22 | HIMACHAL PRADESH | 64.32 | 0.36% | 7,821.20 | 0.33% |
| 23 | GOA | 36.36 | 0.20% | 5,041.14 | 0.21% |
| 24 | CHANDIGARH | 29.74 | 0.17% | 3,711.18 | 0.15% |
| 25 | ARUNACHAL PRADESH | 18.42 | 0.10% | 2,612.54 | 0.11% |
| 26 | PUDUCHERRY | 17.44 | 0.10% | 2,384.85 | 0.10% |
| 27 | MEGHALAYA | 14.32 | 0.08% | 1,971.84 | 0.08% |
| 28 | TRIPURA | 13.94 | 0.08% | 1,936.41 | 0.08% |
| 29 | MANIPUR | 13.51 | 0.08% | 2,844.24 | 0.12% |
| 30 | DADRA & NAGAR HAVELI & DAMAN & DIU | 11.91 | 0.07% | 1,205.30 | 0.05% |
| 31 | NAGALAND | 10.89 | 0.06% | 1,769.78 | 0.07% |
| 32 | MIZORAM | 9.76 | 0.05% | 1,555.83 | 0.06% |
| 33 | SIKKIM | 8.65 | 0.05% | 1,221.50 | 0.05% |
| 34 | ANDAMAN & NICOBAR | 3.79 | 0.02% | 619.48 | 0.03% |
| 35 | LADAKH | 3.63 | 0.02% | 651.93 | 0.03% |
| 36 | LAKSHADWEEP | 0.5 | 0.00% | 60.39 | 0.00% |
| 37 | Unclassified# | 4,928.30 | 27.56% | 6,16,518.29 | 25.76% |
| UPI Remitter Members - Top 50 Members (Mar'25) | |||||||
|---|---|---|---|---|---|---|---|
| Sr. No. | UPI Remitter Members (Mar-2025) | Total Volume (In Mn) | Approved % | BD % | TD% | Total Debit Reversal Count (In Mn) | Debit Reversal Success % |
| 1 | State Bank of India | 4,956.07 | 92.01% | 7.09% | 0.90% | 20.26 | 86.30% |
| 2 | HDFC Bank Ltd. | 1,513.14 | 93.98% | 6.00% | 0.02% | 4.92 | 97.21% |
| 3 | Bank of Baroda | 1,270.60 | 89.47% | 10.50% | 0.03% | 3.86 | 95.32% |
| 4 | Union Bank of India | 1,173.28 | 91.58% | 8.36% | 0.06% | 3.51 | 89.97% |
| 5 | Punjab National Bank | 1,043.06 | 90.22% | 9.45% | 0.33% | 3.83 | 91.30% |
| 6 | Kotak Mahindra Bank | 938.60 | 89.78% | 10.19% | 0.02% | 2.42 | 0.94% |
| 7 | Canara Bank | 901.11 | 91.83% | 8.04% | 0.13% | 2.70 | 87.81% |
| 8 | Axis Bank Ltd. | 883.53 | 93.52% | 6.45% | 0.03% | 2.25 | 84.45% |
| 9 | ICICI Bank Ltd. | 730.29 | 95.15% | 4.72% | 0.13% | 1.83 | 91.05% |
| 10 | Bank Of India | 595.31 | 92.34% | 7.08% | 0.58% | 2.67 | 73.07% |
| 11 | Indian Bank | 589.50 | 91.56% | 8.21% | 0.23% | 1.97 | 75.66% |
| 12 | India Post Payments Bank Limited | 570.54 | 86.13% | 13.54% | 0.33% | 2.31 | 89.05% |
| 13 | Airtel Payments Bank Limited | 569.69 | 84.31% | 15.38% | 0.31% | 2.52 | 88.84% |
| 14 | Indian Overseas Bank | 292.32 | 91.93% | 7.67% | 0.40% | 1.06 | 91.87% |
| 15 | Central Bank of India | 266.98 | 86.15% | 13.55% | 0.30% | 0.94 | 94.79% |
| 16 | Federal Bank Ltd. | 256.34 | 91.49% | 8.46% | 0.05% | 0.57 | 98.07% |
| 17 | UCO Bank | 254.76 | 89.86% | 10.05% | 0.09% | 0.96 | 89.31% |
| 18 | Fino Payments Bank Ltd. | 214.85 | 87.62% | 12.18% | 0.21% | 1.20 | 72.33% |
| 19 | Bank of Maharashtra | 208.61 | 92.52% | 7.31% | 0.17% | 0.81 | 69.23% |
| 20 | Indusind Bank Ltd. | 203.78 | 87.95% | 12.02% | 0.03% | 0.74 | 81.22% |
| 21 | IDBI Bank Ltd. | 200.78 | 92.76% | 7.23% | 0.01% | 0.60 | 95.10% |
| 22 | Yes Bank Ltd. | 167.37 | 88.24% | 11.65% | 0.11% | 0.46 | 69.33% |
| 23 | Karnataka Bank | 144.19 | 90.64% | 8.75% | 0.61% | 0.70 | 59.68% |
| 24 | IDFC Bank Ltd. | 112.68 | 91.20% | 8.80% | 0.00% | 0.29 | 91.84% |
| 25 | Karur Vysya Bank | 90.86 | 91.97% | 7.76% | 0.27% | 0.27 | 82.68% |
| 26 | Tri O Tech Solutions Private Limited | 89.61 | 100.00% | 0.00% | 0.00% | - | 0.00% |
| 27 | The Jammu & Kashmir Bank Limited | 88.86 | 92.45% | 6.41% | 1.14% | 0.99 | 32.27% |
| 28 | Bandhan Bank limited | 82.99 | 92.36% | 5.16% | 2.48% | 0.79 | 67.08% |
| 29 | AU Small Finance Bank | 75.73 | 87.32% | 12.67% | 0.00% | 0.29 | 83.57% |
| 30 | The South Indian Bank Limited | 70.22 | 93.88% | 6.04% | 0.08% | 0.17 | 90.63% |
| 31 | Punjab and Sind Bank | 55.66 | 89.85% | 9.52% | 0.63% | 0.35 | 71.58% |
| 32 | City Union Bank | 54.12 | 90.75% | 9.13% | 0.12% | 0.12 | 97.17% |
| 33 | Ujjivan Small Finance Bank Limited | 53.09 | 93.11% | 6.29% | 0.60% | 0.25 | 69.05% |
| 34 | Tamilnad Mercantile Bank Limited | 51.92 | 91.34% | 8.14% | 0.52% | 0.19 | 63.01% |
| 35 | JIO Payments Bank Ltd | 48.73 | 78.72% | 14.05% | 7.23% | 0.83 | 48.37% |
| 36 | Kerala Gramin Bank | 43.54 | 91.33% | 7.35% | 1.32% | 0.34 | 62.35% |
| 37 | Baroda U.P. Bank | 43.22 | 90.27% | 7.22% | 2.51% | 0.38 | 44.46% |
| 38 | Telangana Grameena Bank | 37.03 | 83.67% | 12.91% | 3.42% | 0.45 | 40.45% |
| 39 | Karnataka Gramin Bank | 36.00 | 88.58% | 10.27% | 1.16% | 0.27 | 82.93% |
| 40 | Maharashtra Gramin Bank | 35.59 | 86.14% | 12.37% | 1.50% | 0.17 | 60.21% |
| 41 | RBL Bank Ltd. | 34.99 | 92.49% | 6.98% | 0.53% | 0.12 | 66.84% |
| 42 | NSDL Payments Bank Limited | 34.89 | 69.20% | 19.22% | 11.58% | 1.07 | 16.58% |
| 43 | Rajasthan Marudhara Gramin Bank | 34.54 | 80.78% | 17.51% | 1.71% | 0.32 | 60.34% |
| 44 | DBS Bank India Limited | 32.09 | 91.95% | 8.04% | 0.01% | 0.09 | 94.35% |
| 45 | ESAF Small Finance Bank Ltd | 31.85 | 91.50% | 4.25% | 4.26% | 0.36 | 51.60% |
| 46 | Equitas Small Finance Bank | 31.50 | 90.20% | 9.43% | 0.37% | 0.10 | 89.49% |
| 47 | Saraswat Co-operative Bank | 29.58 | 93.49% | 6.01% | 0.50% | 0.10 | 66.23% |
| 48 | Andhra Pragathi Grameena Bank | 28.26 | 83.93% | 12.16% | 3.91% | 0.59 | 82.53% |
| 49 | Standard Chartered Bank | 27.87 | 95.83% | 4.14% | 0.03% | 0.06 | 91.92% |
| 50 | Sarva Haryana Gramin Bank | 23.93 | 93.63% | 4.59% | 1.77% | 0.21 | 51.59% |
| UPI Beneficiary Members - Top 50 Members (Mar'25) | |||||||
|---|---|---|---|---|---|---|---|
| Sr.No. | UPI Beneficiary Members (Mar-2025) | Total Volume (In Mn) | Approved % | BD% | TD% | Deemed Approved % | |
| 1 | Yes Bank Ltd. | 7,307.36 | 99.98% | 0.01% | 0.01% | 0.00% | |
| 2 | Axis Bank Ltd. | 1,899.35 | 99.70% | 0.17% | 0.14% | 0.09% | |
| 3 | State Bank of India | 1,859.07 | 99.14% | 0.10% | 0.75% | 0.16% | |
| 4 | HDFC Bank Ltd. | 876.97 | 99.25% | 0.70% | 0.05% | 0.06% | |
| 5 | ICICI Bank Ltd. | 611.58 | 99.67% | 0.24% | 0.09% | 0.02% | |
| 6 | Bank of Baroda | 492.70 | 99.88% | 0.07% | 0.05% | 0.06% | |
| 7 | Union Bank of India | 458.94 | 99.86% | 0.10% | 0.04% | 0.04% | |
| 8 | Canara Bank | 440.10 | 99.68% | 0.20% | 0.12% | 0.04% | |
| 9 | Airtel Payments Bank Limited | 419.54 | 98.88% | 0.91% | 0.21% | 0.08% | |
| 10 | Punjab National Bank | 419.12 | 99.43% | 0.29% | 0.27% | 0.22% | |
| 11 | Federal Bank Ltd. | 407.79 | 99.75% | 0.17% | 0.08% | 0.00% | |
| 12 | Kotak Mahindra Bank | 354.55 | 98.89% | 1.09% | 0.02% | 0.02% | |
| 13 | Indian Bank | 272.99 | 99.47% | 0.33% | 0.20% | 0.09% | |
| 14 | Bank Of India | 256.53 | 98.53% | 1.02% | 0.46% | 0.14% | |
| 15 | India Post Payments Bank Limited | 248.71 | 98.59% | 1.06% | 0.35% | 0.16% | |
| 16 | Indusind Bank Ltd. | 176.00 | 99.60% | 0.30% | 0.11% | 0.05% | |
| 17 | Indian Overseas Bank | 144.84 | 99.28% | 0.48% | 0.25% | 0.21% | |
| 18 | Central Bank of India | 123.40 | 99.30% | 0.55% | 0.15% | 0.09% | |
| 19 | Fino Payments Bank Ltd. | 109.36 | 96.01% | 3.81% | 0.18% | 0.11% | |
| 20 | UCO Bank | 109.28 | 99.34% | 0.54% | 0.12% | 0.03% | |
| 21 | IDBI Bank Ltd. | 98.38 | 99.70% | 0.25% | 0.04% | 0.01% | |
| 22 | Bank of Maharashtra | 93.68 | 99.47% | 0.28% | 0.25% | 0.10% | |
| 23 | RBL Bank Ltd. | 85.36 | 99.33% | 0.09% | 0.58% | 0.29% | |
| 24 | Karnataka Bank | 69.07 | 99.14% | 0.30% | 0.56% | 0.17% | |
| 25 | One Mobikwik Systems Limited | 51.92 | 99.95% | 0.00% | 0.04% | 0.00% | |
| 26 | The Jammu & Kashmir Bank Limited | 51.57 | 99.01% | 0.43% | 0.55% | 0.61% | |
| 27 | Bandhan Bank limited | 48.45 | 97.22% | 0.33% | 2.45% | 0.39% | |
| 28 | IDFC Bank Ltd. | 45.90 | 98.91% | 1.05% | 0.05% | 0.02% | |
| 29 | Karur Vysya Bank | 44.17 | 99.46% | 0.28% | 0.26% | 0.04% | |
| 30 | Tri O Tech Solutions Private Limited | 43.48 | 97.67% | 2.31% | 0.02% | 0.02% | |
| 31 | The South Indian Bank Limited | 43.07 | 99.78% | 0.13% | 0.09% | 0.02% | |
| 32 | Unity Small Finance Bank Limited | 41.03 | 99.96% | 0.01% | 0.03% | 0.02% | |
| 33 | Tamilnad Mercantile Bank Limited | 37.74 | 99.34% | 0.12% | 0.54% | 0.16% | |
| 34 | AU Small Finance Bank | 34.42 | 99.44% | 0.52% | 0.04% | 0.03% | |
| 35 | NSDL Payments Bank Limited | 32.60 | 96.45% | 0.83% | 2.72% | 1.20% | |
| 36 | City Union Bank | 30.84 | 99.27% | 0.57% | 0.16% | 0.01% | |
| 37 | JIO Payments Bank Ltd | 27.71 | 95.42% | 0.82% | 3.75% | 1.01% | |
| 38 | Punjab and Sind Bank | 26.55 | 96.87% | 2.47% | 0.66% | 0.19% | |
| 39 | Ujjivan Small Finance Bank Limited | 26.53 | 99.32% | 0.23% | 0.45% | 0.24% | |
| 40 | Kerala Gramin Bank | 24.70 | 98.87% | 0.16% | 0.97% | 0.58% | |
| 41 | Citi Bank | 22.11 | 99.63% | 0.31% | 0.06% | 0.03% | |
| 42 | Suryoday Small Finance Bank Limited | 21.22 | 97.90% | 1.14% | 0.95% | 0.45% | |
| 43 | Baroda U.P. Bank | 20.99 | 97.37% | 0.25% | 2.38% | 0.45% | |
| 44 | Telangana Grameena Bank | 16.74 | 97.58% | 0.64% | 1.78% | 0.58% | |
| 45 | Karnataka Gramin Bank | 16.25 | 99.26% | 0.16% | 0.58% | 0.54% | |
| 46 | Maharashtra Gramin Bank | 15.36 | 98.35% | 0.18% | 1.47% | 0.73% | |
| 47 | Equitas Small Finance Bank | 14.84 | 97.88% | 1.66% | 0.46% | 0.04% | |
| 48 | ESAF Small Finance Bank Ltd | 14.74 | 96.16% | 0.18% | 3.66% | 0.53% | |
| 49 | Rajasthan Marudhara Gramin Bank | 13.49 | 94.97% | 3.85% | 1.18% | 0.24% | |
| 50 | Andhra Pragathi Grameena Bank | 13.42 | 97.61% | 0.29% | 2.10% | 0.16% | |
| UPI Apps (Mar'25) | |||||||||
|---|---|---|---|---|---|---|---|---|---|
| Sr.No. | Application Name | Customer Initiated Transactions | B2C Transactions | B2B Transactions | Total | ||||
| Volume (Mn) | Value (Cr) | Volume (Mn) | Value (Cr) | Volume (Mn) | Value (Cr) | Volume (Mn) | Value (Cr) | ||
| 1 | Phone Pe # | 8,647.78 | 12,57,075.54 | 0.00 | 0.00 | 0.00 | 0.00 | 8,647.78 | 12,57,075.54 |
| 2 | Google Pay # | 6,596.76 | 8,66,568.18 | 0.00 | 0.00 | 0.00 | 0.00 | 6,596.76 | 8,66,568.18 |
| 3 | Paytm # | 1,221.12 | 1,32,912.04 | 0.00 | 0.00 | 0.00 | 0.00 | 1,221.12 | 1,32,912.04 |
| 4 | Navi # | 324.42 | 18,018.65 | 0.00 | 0.00 | 0.00 | 0.00 | 324.42 | 18,018.65 |
| 5 | super.money # | 171.75 | 5,933.08 | 0.00 | 0.00 | 0.00 | 0.00 | 171.75 | 5,933.08 |
| 6 | Axis Bank Apps | 20.26 | 5,015.47 | 125.50 | 4,948.62 | 0.01 | 2.43 | 145.78 | 9,966.53 |
| 7 | Cred # | 144.82 | 55,091.22 | 0.00 | 0.00 | 0.00 | 0.00 | 144.82 | 55,091.22 |
| 8 | Amazon Pay # | 111.06 | 10,606.66 | 0.00 | 0.00 | 0.00 | 0.00 | 111.06 | 10,606.66 |
| 9 | FamApp by Trio # | 89.94 | 1,099.28 | 0.00 | 0.00 | 0.00 | 0.00 | 89.94 | 1,099.28 |
| 10 | ICICI Bank Apps | 65.41 | 14,804.72 | 0.01 | 13.65 | 2.21 | 1,878.57 | 67.63 | 16,696.94 |
| 11 | Whatsapp # | 66.23 | 4,958.25 | 0.00 | 0.00 | 0.00 | 0.00 | 66.23 | 4,958.25 |
| 12 | HDFC Bank Apps | 46.63 | 11,782.56 | 14.30 | 5.37 | 0.01 | 1.97 | 60.94 | 11,789.90 |
| 13 | Kotak Mahindra Bank Apps | 57.05 | 7,737.14 | 0.00 | 0.00 | 0.00 | 0.00 | 57.05 | 7,737.14 |
| 14 | BHIM # | 46.13 | 9,540.09 | 0.00 | 0.00 | 0.00 | 0.00 | 46.13 | 9,540.09 |
| 15 | Yes Bank Apps | 43.58 | 9,369.60 | 0.01 | 0.12 | 0.44 | 19.13 | 44.03 | 9,388.85 |
| 16 | Mobikwik # | 29.80 | 4,414.00 | 0.00 | 0.00 | 0.00 | 0.00 | 29.80 | 4,414.00 |
| 17 | Airtel Payments Bank Apps | 21.63 | 1,487.83 | 0.00 | 0.02 | 0.00 | 0.04 | 21.63 | 1,487.89 |
| 18 | Slice # | 17.41 | 2,069.29 | 0.00 | 0.00 | 0.00 | 0.02 | 17.41 | 2,069.31 |
| 19 | India Post Payments Bank Apps | 16.58 | 1,941.73 | 0.00 | 0.00 | 0.00 | 0.00 | 16.58 | 1,941.73 |
| 20 | IDFC Bank Apps | 14.39 | 2,478.07 | 0.14 | 7.96 | 0.01 | 0.05 | 14.53 | 2,486.08 |
| 21 | State Bank of India Apps | 12.61 | 3,418.04 | 0.00 | 0.00 | 0.00 | 0.00 | 12.61 | 3,418.04 |
| 22 | RBL Bank Apps | 12.38 | 1,714.22 | 0.00 | 0.01 | 0.20 | 27.46 | 12.59 | 1,741.69 |
| 23 | Groww # | 11.63 | 7,009.63 | 0.00 | 0.00 | 0.00 | 0.00 | 11.63 | 7,009.63 |
| 24 | Bajaj Finserv # | 9.66 | 1,892.01 | 0.00 | 0.00 | 0.00 | 0.00 | 9.66 | 1,892.01 |
| 25 | Samsung Pay # | 8.95 | 642.73 | 0.00 | 0.00 | 0.00 | 0.00 | 8.95 | 642.73 |
| 26 | Pop Club # | 8.53 | 449.95 | 0.00 | 0.00 | 0.00 | 0.00 | 8.53 | 449.95 |
| 27 | Jupiter Money # | 6.49 | 958.52 | 0.00 | 0.00 | 0.00 | 0.00 | 6.49 | 958.52 |
| 28 | Federal Bank Apps | 4.75 | 869.77 | 0.00 | 0.00 | 0.00 | 0.00 | 4.75 | 869.77 |
| 29 | Flipkart UPI # | 4.72 | 257.82 | 0.00 | 0.00 | 0.00 | 0.00 | 4.72 | 257.82 |
| 30 | Jio Payments Bank Apps | 4.08 | 318.20 | 0.00 | 0.00 | 0.00 | 0.00 | 4.08 | 318.20 |
| 31 | Canara Bank Apps | 3.75 | 975.91 | 0.00 | 0.00 | 0.00 | 0.00 | 3.75 | 975.91 |
| 32 | Deutsche Bank Apps | 3.61 | 531.92 | 0.00 | 0.00 | 0.00 | 0.12 | 3.62 | 532.05 |
| 33 | Punjab National Bank Apps | 3.38 | 898.95 | 0.00 | 0.00 | 0.00 | 0.00 | 3.38 | 898.95 |
| 34 | Fi Money # | 3.25 | 434.16 | 0.00 | 0.00 | 0.00 | 0.00 | 3.25 | 434.16 |
| 35 | Timepay # | 3.07 | 37.66 | 0.00 | 0.00 | 0.00 | 0.00 | 3.07 | 37.66 |
| 36 | Bank of Baroda Apps | 2.11 | 588.95 | 0.00 | 0.00 | 0.00 | 0.00 | 2.11 | 588.95 |
| 37 | IndusInd Bank Apps | 2.04 | 346.00 | 0.00 | 0.00 | 0.00 | 0.00 | 2.04 | 346.00 |
| 38 | Shri Ram One # | 1.75 | 116.77 | 0.00 | 0.00 | 0.00 | 0.00 | 1.75 | 116.77 |
| 39 | Jammu and Kashmir Bank Apps | 1.75 | 261.45 | 0.00 | 0.00 | 0.00 | 0.00 | 1.75 | 261.45 |
| 40 | Omni Card | 1.59 | 86.51 | 0.00 | 0.00 | 0.00 | 0.00 | 1.59 | 86.51 |
| 41 | Central Bank of India Apps | 1.57 | 268.00 | 0.00 | 0.00 | 0.00 | 0.00 | 1.57 | 268.00 |
| 42 | Kiwi # | 1.41 | 213.93 | 0.00 | 0.00 | 0.00 | 0.00 | 1.41 | 213.93 |
| 43 | Suryoday Bank Apps | 1.24 | 174.22 | 0.00 | 0.00 | 0.02 | 4.71 | 1.26 | 178.92 |
| 44 | Bharat Pe # | 1.07 | 68.67 | 0.00 | 0.00 | 0.00 | 0.00 | 1.07 | 68.67 |
| 45 | DBS Digibank Apps | 1.02 | 228.73 | 0.00 | 0.00 | 0.01 | 1.48 | 1.02 | 230.21 |
| 46 | HSBC Bank Apps | 0.99 | 224.31 | 0.01 | 0.32 | 0.00 | 0.21 | 1.00 | 224.84 |
| 47 | Ind Money # | 0.95 | 436.80 | 0.00 | 0.00 | 0.00 | 0.00 | 0.95 | 436.80 |
| 48 | Aditya Birla Capital Digital # | 0.88 | 39.97 | 0.00 | 0.00 | 0.00 | 0.00 | 0.88 | 39.97 |
| 49 | One Card # | 0.82 | 973.00 | 0.00 | 0.00 | 0.00 | 0.00 | 0.82 | 973.00 |
| 50 | Digikhata | 0.80 | 258.58 | 0.00 | 0.00 | 0.00 | 0.00 | 0.80 | 258.58 |
| 51 | Union Bank Apps | 0.72 | 241.09 | 0.00 | 0.00 | 0.00 | 0.00 | 0.72 | 241.09 |
| 52 | South Indian Bank Apps | 0.68 | 204.88 | 0.00 | 0.00 | 0.00 | 0.00 | 0.68 | 204.88 |
| 53 | Indian Bank Apps | 0.64 | 176.18 | 0.00 | 0.00 | 0.00 | 0.00 | 0.64 | 176.18 |
| 54 | AU Small Finance Bank Apps | 0.59 | 174.06 | 0.00 | 0.00 | 0.00 | 0.00 | 0.59 | 174.06 |
| 55 | Fino Payments Bank Apps | 0.58 | 63.84 | 0.00 | 0.00 | 0.00 | 0.00 | 0.58 | 63.84 |
| 56 | Standard Chartered Bank Apps | 0.31 | 140.79 | 0.00 | 0.00 | 0.19 | 5.67 | 0.50 | 146.46 |
| 57 | UCO Bank Apps | 0.44 | 110.34 | 0.00 | 0.00 | 0.00 | 0.00 | 0.44 | 110.34 |
| 58 | Tata Neu # | 0.38 | 111.95 | 0.00 | 0.00 | 0.00 | 0.00 | 0.38 | 111.95 |
| 59 | ESAF Small Finance Bank Apps | 0.38 | 40.78 | 0.00 | 0.00 | 0.00 | 0.00 | 0.38 | 40.78 |
| 60 | Salary Se # | 0.36 | 18.23 | 0.00 | 0.00 | 0.00 | 0.00 | 0.36 | 18.23 |
| 61 | Bank of India Apps | 0.27 | 86.10 | 0.00 | 0.00 | 0.00 | 0.00 | 0.27 | 86.10 |
| 62 | Indian Overseas Bank Apps | 0.26 | 60.29 | 0.00 | 0.00 | 0.00 | 0.00 | 0.26 | 60.29 |
| 63 | Karnataka Bank Apps | 0.25 | 57.71 | 0.00 | 0.00 | 0.00 | 0.01 | 0.25 | 57.72 |
| 64 | Kredit.Pe # | 0.19 | 26.43 | 0.00 | 0.00 | 0.00 | 0.00 | 0.19 | 26.43 |
| 65 | Money View # | 0.18 | 18.99 | 0.00 | 0.00 | 0.00 | 0.00 | 0.18 | 18.99 |
| 66 | Dhani | 0.17 | 8.44 | 0.00 | 0.00 | 0.00 | 0.00 | 0.17 | 8.44 |
| 67 | Spice Money | 0.16 | 12.87 | 0.00 | 0.00 | 0.00 | 0.00 | 0.16 | 12.87 |
| 68 | Rapipay | 0.14 | 17.08 | 0.00 | 0.00 | 0.00 | 0.00 | 0.14 | 17.08 |
| 69 | IDBI Bank Apps | 0.13 | 45.74 | 0.00 | 0.00 | 0.00 | 0.00 | 0.13 | 45.74 |
| 70 | Ultracash # | 0.11 | 8.67 | 0.00 | 0.00 | 0.00 | 0.00 | 0.11 | 8.67 |
| 71 | Niyo Global # | 0.11 | 54.39 | 0.00 | 0.00 | 0.00 | 0.00 | 0.11 | 54.39 |
| 72 | True Balance | 0.10 | 3.41 | 0.00 | 0.00 | 0.00 | 0.00 | 0.10 | 3.41 |
| 73 | Karur Vysya Bank Apps | 0.09 | 33.66 | 0.00 | 0.00 | 0.00 | 0.00 | 0.09 | 33.66 |
| 74 | City Union Bank Apps | 0.09 | 31.31 | 0.00 | 0.00 | 0.00 | 0.00 | 0.09 | 31.31 |
| 75 | Tamilnad Mercantile Bank Apps | 0.08 | 29.48 | 0.00 | 0.00 | 0.00 | 0.00 | 0.08 | 29.48 |
| 76 | Genwise # | 0.07 | 28.34 | 0.00 | 0.00 | 0.00 | 0.00 | 0.07 | 28.34 |
| 77 | Freo # | 0.05 | 3.87 | 0.00 | 0.00 | 0.00 | 0.00 | 0.05 | 3.87 |
| 78 | NSDL Payments Bank Apps | 0.04 | 5.54 | 0.00 | 0.00 | 0.00 | 0.00 | 0.04 | 5.54 |
| 79 | Cheq | 0.03 | 2.43 | 0.00 | 0.00 | 0.00 | 0.00 | 0.03 | 2.43 |
| 80 | Bank of Maharashtra Apps | 0.03 | 9.11 | 0.00 | 0.00 | 0.00 | 0.00 | 0.03 | 9.11 |
| 81 | Punjab Sind Bank Apps | 0.03 | 9.19 | 0.00 | 0.00 | 0.00 | 0.00 | 0.03 | 9.19 |
| 82 | Others | 2.08 | 247.74 | 0.00 | 0.00 | 0.18 | 7.19 | 2.26 | 254.93 |
Note:-
| UPI P2P and P2M Transactions | ||||||
|---|---|---|---|---|---|---|
| Month | Total | P2P | P2M | |||
| Volume (Mn) | Value (Cr) | Volume (Mn) | Value (Cr) | Volume (Mn) | Value (Cr) | |
| Mar-25 | 18,301.51 | 24,77,221.61 | 6,840.45 | 18,06,811.06 | 11,461.06 | 6,70,410.55 |
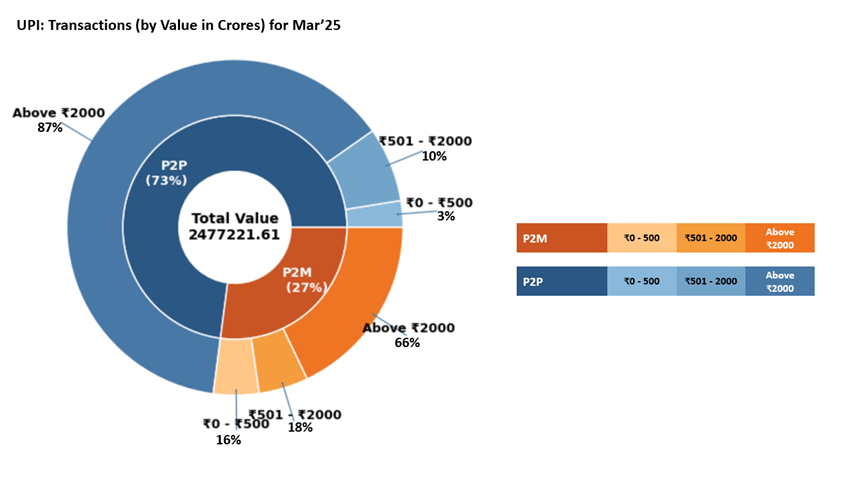
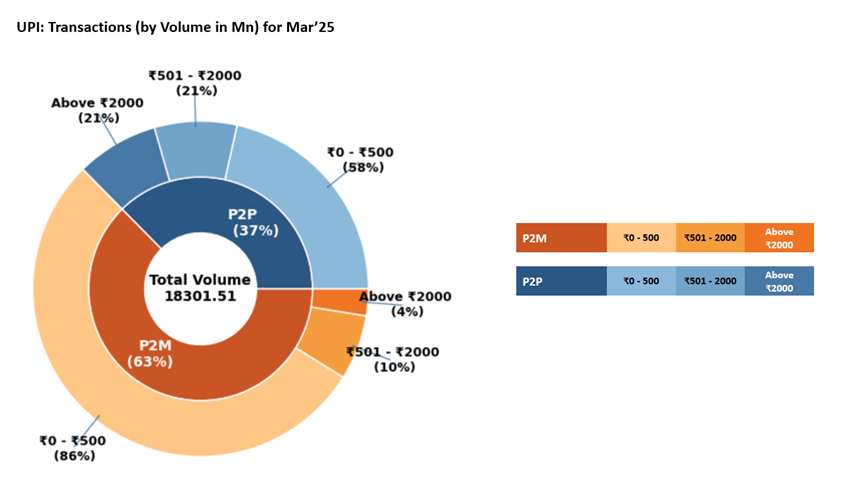
| UPI Payer PSP Performance (March'25) | |||||
|---|---|---|---|---|---|
| Sr. No. | Payer PSP | Total Volume (In Mn) | Approved % | BD % | TD % |
| 1 | Axis Bank Ltd. | 6,604.23 | 92.40% | 7.45% | 0.16% |
| 2 | Yes Bank Ltd. | 5,941.99 | 89.01% | 10.86% | 0.13% |
| 3 | ICICI Bank Ltd. | 3,439.32 | 90.81% | 9.06% | 0.12% |
| 4 | HDFC Bank Ltd. | 2,057.59 | 93.55% | 6.37% | 0.08% |
| 5 | State Bank of India | 1,584.82 | 94.74% | 5.10% | 0.17% |
| 6 | Tri O Tech Solutions Private Limited | 89.61 | 100.00% | 0.00% | 0.00% |
| 7 | Kotak Mahindra Bank | 57.42 | 100.00% | 0.00% | 0.00% |
| 8 | BHIM | 55.53 | 94.09% | 5.71% | 0.20% |
| 9 | Airtel Payments Bank Limited | 22.47 | 96.32% | 3.58% | 0.10% |
| 10 | RBL Bank Ltd. | 22.14 | 97.94% | 1.99% | 0.07% |
| 11 | North East Small Finance Bank | 16.79 | 97.39% | 2.52% | 0.09% |
| 12 | India Post Payments Bank Limited | 16.58 | 100.00% | 0.00% | 0.00% |
| 13 | IDFC Bank Ltd. | 15.55 | 99.76% | 0.24% | 0.00% |
| 14 | One Mobikwik Systems Limited | 11.90 | 100.00% | 0.00% | 0.00% |
| 15 | Federal Bank Ltd. | 8.28 | 98.74% | 1.24% | 0.02% |
| UPI Payee PSP Performance (March'25) | |||||
|---|---|---|---|---|---|
| Sr. No. | Payee PSP | Total Volume (In Mn) | Approved % | BD % | TD % |
| 1 | Yes Bank Ltd. | 10,420.07 | 88.88% | 10.98% | 0.13% |
| 2 | Axis Bank Ltd. | 3,652.62 | 94.47% | 5.40% | 0.13% |
| 3 | ICICI Bank Ltd. | 1,793.36 | 93.71% | 6.16% | 0.14% |
| 4 | HDFC Bank Ltd. | 1,157.83 | 93.76% | 6.11% | 0.12% |
| 5 | State Bank of India | 1,043.16 | 95.08% | 4.78% | 0.14% |
| 6 | Federal Bank Ltd. | 331.85 | 96.90% | 2.98% | 0.13% |
| 7 | Airtel Payments Bank Limited | 187.41 | 93.64% | 6.24% | 0.12% |
| 8 | Indusind Bank Ltd. | 115.91 | 93.17% | 6.70% | 0.12% |
| 9 | Canara Bank | 105.51 | 96.38% | 3.50% | 0.11% |
| 10 | RBL Bank Ltd. | 86.13 | 92.91% | 6.94% | 0.15% |
| 11 | Kotak Mahindra Bank | 70.38 | 94.72% | 5.16% | 0.12% |
| 12 | One Mobikwik Systems Limited | 53.73 | 96.53% | 3.35% | 0.12% |
| 13 | Tri O Tech Solutions Private Limited | 45.31 | 93.46% | 6.37% | 0.17% |
| 14 | Fino Payments Bank Ltd. | 43.14 | 89.70% | 10.09% | 0.21% |
| 15 | Unity Small Finance Bank Limited | 42.50 | 96.82% | 3.04% | 0.13% |
| UPI Merchant Category-wise Classification - March'25 (Arranged by Volume) | ||||
|---|---|---|---|---|
| Type | MCC | Description | Volume (in Mn) | Value (in Cr.) |
| High Transacting Categories | 5411 | Groceries and supermarkets | 2,730.18 | 61,999.70 |
| 5814 | Fast food restaurants | 1,127.01 | 13,740.91 | |
| 5812 | Eating places and restaurants | 1,059.15 | 17,014.22 | |
| 4814 | Telecommunication services, including local and long distance calls, credit card calls, calls through use of magnetic stripe reading telephones and faxes | 896.41 | 20,150.23 | |
| 5541 | Service stations (with or without ancillary services) | 551.45 | 32,535.12 | |
| 5816 | Digital Goods: Games | 425.95 | 11,202.93 | |
| 5993 | Cigar shops and stands | 268.96 | 1,725.09 | |
| 5912 | Drug stores and pharmacies | 254.87 | 10,265.19 | |
| 5462 | Bakeries | 244.59 | 3,568.38 | |
| 5451 | Dairies | 169.52 | 4,298.47 | |
| Medium Transacting Categories | 4900 | Utilities electric, gas, water and sanitary | 166.31 | 18,590.12 |
| 7322 | Debt collection agencies | 139.49 | 88,856.37 | |
| 5921 | Package shops beer, wine and liquor | 108.72 | 4,877.55 | |
| 5422 | Freezer and locker meat provisioners | 98.46 | 3,305.09 | |
| 5441 | Candy, nut and confectionery shops | 97.95 | 1,851.47 | |
| 5813 | Drinking places (alcoholic beverages) bars, taverns, night-clubs, cocktail lounges and discothques | 95.69 | 3,823.52 | |
| 9399 | Government services not elsewhere classified | 91.89 | 10,134.63 | |
| 5262 | Online Marketplaces | 80.73 | 5,321.63 | |
| 5691 | Mens and womens clothing shops | 78.82 | 10,443.54 | |
| 5732 | Electronics shops | 76.10 | 10,028.83 | |
| All Other Categories | 5137 | Mens, womens and childrens uniforms and commercial clothing | 73.80 | 7,628.34 |
| 7230 | Beauty and barber shops | 73.33 | 2,063.09 | |
| 7622 | Electronics repair shops | 72.59 | 2,219.90 | |
| 4112 | Passenger railways | 69.01 | 3,797.87 | |
| 5311 | Department stores | 68.34 | 4,532.07 | |
| 5412 | Purchase of digital gold | 64.96 | 866.43 | |
| 5331 | Variety stores | 63.83 | 3,640.12 | |
| 4121 | Taxi-cabs and limousines | 62.12 | 1,216.14 | |
| 5651 | Family clothing shops | 52.70 | 4,906.57 | |
| Others | 2,098.12 | 3,05,807.04 | ||
| Total | 11,461.06 | 6,70,410.55 | ||
| State-wise UPI Product Statistics* (Mar'25) | |||||
|---|---|---|---|---|---|
| Sr. No. | State / Union Territory | Volume (in Mn ) | Volume Contribution (%) | Value (in Cr.) | Value Contribution (%) |
| 1 | MAHARASHTRA | 2,195.56 | 12.00% | 2,54,485.23 | 10.27% |
| 2 | KARNATAKA | 1,092.86 | 5.97% | 1,52,072.42 | 6.14% |
| 3 | UTTAR PRADESH | 962.13 | 5.26% | 1,34,045.16 | 5.41% |
| 4 | TELANGANA | 784.35 | 4.29% | 1,24,966.41 | 5.04% |
| 5 | TAMIL NADU | 730.26 | 3.99% | 1,11,554.31 | 4.50% |
| 6 | ANDHRA PRADESH | 524.69 | 2.87% | 93,739.59 | 3.78% |
| 7 | RAJASTHAN | 515.61 | 2.82% | 78,119.12 | 3.15% |
| 8 | GUJARAT | 470.83 | 2.57% | 70,343.32 | 2.84% |
| 9 | MADHYA PRADESH | 427.85 | 2.34% | 58,146.44 | 2.35% |
| 10 | DELHI | 419.25 | 2.29% | 53,531.51 | 2.16% |
| 11 | BIHAR | 414.96 | 2.27% | 64,098.56 | 2.59% |
| 12 | WEST BENGAL | 405.81 | 2.22% | 64,647.94 | 2.61% |
| 13 | KERALA | 353.95 | 1.93% | 50,645.70 | 2.04% |
| 14 | HARYANA | 346.80 | 1.89% | 49,619.26 | 2.00% |
| 15 | ODISHA | 281.28 | 1.54% | 38,771.50 | 1.57% |
| 16 | PUNJAB | 194.70 | 1.06% | 33,048.66 | 1.33% |
| 17 | ASSAM | 181.37 | 0.99% | 22,815.27 | 0.92% |
| 18 | JHARKHAND | 166.62 | 0.91% | 23,760.23 | 0.96% |
| 19 | CHHATTISGARH | 128.15 | 0.70% | 17,043.76 | 0.69% |
| 20 | UTTARAKHAND | 105.37 | 0.58% | 13,275.09 | 0.54% |
| 21 | JAMMU AND KASHMIR | 71.77 | 0.39% | 10,046.35 | 0.41% |
| 22 | HIMACHAL PRADESH | 57.13 | 0.31% | 7,048.59 | 0.28% |
| 23 | GOA | 32.62 | 0.18% | 4,518.59 | 0.18% |
| 24 | CHANDIGARH | 24.74 | 0.14% | 3,054.21 | 0.12% |
| 25 | ARUNACHAL PRADESH | 17.70 | 0.10% | 2,450.07 | 0.10% |
| 26 | PUDUCHERRY | 16.94 | 0.09% | 2,340.69 | 0.09% |
| 27 | TRIPURA | 13.16 | 0.07% | 1,871.46 | 0.08% |
| 28 | MEGHALAYA | 13.07 | 0.07% | 1,880.92 | 0.08% |
| 29 | MANIPUR | 12.02 | 0.07% | 2,655.73 | 0.11% |
| 30 | DADRA & NAGAR HAVELI & DAMAN & DIU | 10.57 | 0.06% | 1,095.97 | 0.04% |
| 31 | MIZORAM | 10.02 | 0.05% | 1,681.13 | 0.07% |
| 32 | NAGALAND | 9.97 | 0.05% | 1,726.32 | 0.07% |
| 33 | SIKKIM | 7.77 | 0.04% | 1,063.13 | 0.04% |
| 34 | ANDAMAN & NICOBAR | 3.66 | 0.02% | 597.85 | 0.02% |
| 35 | LADAKH | 2.55 | 0.01% | 419.60 | 0.02% |
| 36 | LAKSHADWEEP | 0.52 | 0.00% | 64.59 | 0.00% |
| 37 | UNCLASSIFIED# | 7,294.90 | 39.86% | 9,25,976.91 | 37.38% |
| UPI Remitter Members - Top 50 Members (Feb'25) | |||||||
|---|---|---|---|---|---|---|---|
| Sr. No. | UPI Remitter Members (Feb-2025) | Total Volume (In Mn) | Approved % | BD % | TD% | Total Debit Reversal Count (In Mn) | Debit Reversal Success % |
| 1 | State Bank of India | 4,400.89 | 92.13% | 7.53% | 0.34% | 12.56 | 94.16% |
| 2 | HDFC Bank Ltd. | 1,335.84 | 93.74% | 6.20% | 0.06% | 3.56 | 98.71% |
| 3 | Bank of Baroda | 1,107.47 | 90.78% | 9.16% | 0.06% | 2.98 | 94.41% |
| 4 | Union Bank of India | 1,035.24 | 91.72% | 8.05% | 0.22% | 2.90 | 89.12% |
| 5 | Punjab National Bank | 925.01 | 89.74% | 10.12% | 0.14% | 2.77 | 96.09% |
| 6 | Kotak Mahindra Bank | 838.10 | 89.58% | 10.23% | 0.19% | 2.07 | 2.75% |
| 7 | Canara Bank | 799.21 | 90.86% | 8.70% | 0.44% | 2.65 | 77.52% |
| 8 | Axis Bank Ltd. | 774.80 | 93.21% | 6.78% | 0.02% | 1.61 | 97.96% |
| 9 | ICICI Bank Ltd. | 646.14 | 94.86% | 5.08% | 0.06% | 1.29 | 92.36% |
| 10 | Bank Of India | 524.43 | 92.00% | 7.17% | 0.83% | 2.60 | 63.53% |
| 11 | Indian Bank | 517.21 | 91.87% | 8.08% | 0.05% | 1.27 | 93.38% |
| 12 | Airtel Payments Bank Limited | 494.58 | 79.75% | 17.84% | 2.41% | 2.16 | 82.80% |
| 13 | India Post Payments Bank Ltd. | 488.27 | 84.83% | 14.04% | 1.13% | 1.76 | 85.35% |
| 14 | Indian Overseas Bank | 257.53 | 91.88% | 7.93% | 0.19% | 0.67 | 97.18% |
| 15 | Central Bank of India | 234.96 | 85.99% | 13.49% | 0.52% | 0.85 | 92.18% |
| 16 | Federal Bank Ltd. | 234.23 | 91.54% | 8.32% | 0.14% | 0.48 | 97.98% |
| 17 | UCO Bank | 222.51 | 90.40% | 9.22% | 0.38% | 0.79 | 83.80% |
| 18 | Bank of Maharashtra | 183.07 | 92.04% | 7.47% | 0.50% | 0.71 | 62.29% |
| 19 | Fino Payments Bank Ltd. | 182.03 | 89.88% | 9.89% | 0.22% | 0.82 | 83.43% |
| 20 | Indusind Bank Ltd. | 180.68 | 87.51% | 12.12% | 0.37% | 0.81 | 61.52% |
| 21 | IDBI Bank Ltd. | 177.38 | 92.32% | 7.34% | 0.34% | 0.62 | 87.66% |
| 22 | Yes Bank Ltd. | 150.13 | 86.99% | 12.77% | 0.23% | 0.48 | 54.37% |
| 23 | Karnataka Bank | 127.01 | 90.88% | 8.65% | 0.47% | 0.47 | 62.11% |
| 24 | IDFC Bank Ltd. | 99.48 | 90.73% | 9.24% | 0.02% | 0.23 | 95.90% |
| 25 | Karur Vysya Bank | 80.65 | 91.79% | 7.87% | 0.34% | 0.23 | 78.72% |
| 26 | The Jammu & Kashmir Bank Limited | 80.46 | 91.31% | 6.33% | 2.36% | 0.96 | 27.81% |
| 27 | Tri O Tech Solutions Private Limited | 76.79 | 100.00% | 0.00% | 0.00% | - | 0.00% |
| 28 | Bandhan Bank limited | 74.75 | 92.93% | 5.02% | 2.05% | 0.65 | 88.71% |
| 29 | AU Small Finance Bank | 67.04 | 86.79% | 12.78% | 0.43% | 0.28 | 74.62% |
| 30 | The South Indian Bank Limited | 63.83 | 93.57% | 5.83% | 0.60% | 0.12 | 96.99% |
| 31 | Punjab and Sind Bank | 48.34 | 89.73% | 9.68% | 0.59% | 0.25 | 75.45% |
| 32 | City Union Bank | 48.24 | 91.53% | 8.33% | 0.13% | 0.09 | 96.40% |
| 33 | Ujjivan Small Finance Bank Limited | 46.36 | 94.56% | 5.35% | 0.10% | 0.15 | 88.76% |
| 34 | Tamilnad Mercantile Bank Limited | 45.82 | 91.37% | 8.13% | 0.50% | 0.14 | 64.88% |
| 35 | Kerala Gramin Bank | 39.96 | 92.08% | 7.29% | 0.63% | 0.15 | 88.95% |
| 36 | JIO Payments Bank Ltd | 39.60 | 86.44% | 12.94% | 0.62% | 0.21 | 80.00% |
| 37 | Baroda U.P. Bank | 35.45 | 92.12% | 6.03% | 1.84% | 0.31 | 41.58% |
| 38 | Telangana Grameena Bank | 31.21 | 83.85% | 12.35% | 3.81% | 0.60 | 26.67% |
| 39 | Karnataka Gramin Bank | 31.05 | 88.53% | 10.15% | 1.32% | 0.21 | 87.74% |
| 40 | NSDL Payments Bank Limited | 30.80 | 68.39% | 15.91% | 15.71% | 1.47 | 8.99% |
| 41 | Rajasthan Marudhara Gramin Bank | 30.74 | 80.12% | 14.29% | 5.59% | 0.63 | 18.91% |
| 42 | Maharashtra Gramin Bank | 30.50 | 86.01% | 11.99% | 2.01% | 0.15 | 53.25% |
| 43 | ESAF Small Finance Bank Ltd | 28.79 | 94.28% | 4.15% | 1.57% | 0.18 | 91.31% |
| 44 | DBS Bank India Limited | 28.75 | 92.20% | 7.75% | 0.05% | 0.07 | 93.35% |
| 45 | RBL Bank Ltd. | 28.55 | 91.46% | 7.75% | 0.79% | 0.09 | 66.20% |
| 46 | Equitas Small Finance Bank | 28.49 | 89.74% | 9.72% | 0.54% | 0.10 | 71.53% |
| 47 | Saraswat Co-operative Bank | 26.38 | 93.24% | 6.16% | 0.61% | 0.10 | 55.99% |
| 48 | Standard Chartered Bank | 25.11 | 95.66% | 4.29% | 0.05% | 0.05 | 91.57% |
| 49 | Andhra Pragathi Grameena Bank | 23.70 | 83.93% | 12.53% | 3.53% | 0.43 | 79.17% |
| 50 | Sarva Haryana Gramin Bank | 20.73 | 92.58% | 4.52% | 2.90% | 0.20 | 46.38% |
| UPI Beneficiary Members - Top 50 Members (Feb'25) | |||||||
|---|---|---|---|---|---|---|---|
| Sr.No. | UPI Beneficiary Members (Feb-2025) | Total Volume (In Mn) | Approved % | BD% | TD% | Deemed Approved % | |
| 1 | Yes Bank Ltd. | 6,412.99 | 99.99% | 0.01% | 0.00% | 0.00% | |
| 2 | Axis Bank Ltd. | 1,662.94 | 99.84% | 0.15% | 0.01% | 0.01% | |
| 3 | State Bank of India | 1,627.18 | 99.68% | 0.10% | 0.22% | 0.07% | |
| 4 | HDFC Bank Ltd. | 774.50 | 99.24% | 0.72% | 0.05% | 0.03% | |
| 5 | ICICI Bank Ltd. | 561.55 | 99.66% | 0.27% | 0.07% | 0.03% | |
| 6 | Bank of Baroda | 434.99 | 99.91% | 0.06% | 0.03% | 0.04% | |
| 7 | Canara Bank | 423.99 | 99.33% | 0.34% | 0.33% | 0.12% | |
| 8 | Union Bank of India | 405.83 | 99.77% | 0.11% | 0.13% | 0.06% | |
| 9 | Federal Bank Ltd. | 374.29 | 99.82% | 0.15% | 0.03% | 0.00% | |
| 10 | Punjab National Bank | 368.35 | 99.60% | 0.36% | 0.04% | 0.03% | |
| 11 | Airtel Payments Bank Limited | 334.99 | 98.47% | 0.82% | 0.72% | 0.18% | |
| 12 | Kotak Mahindra Bank | 313.80 | 98.88% | 1.04% | 0.08% | 0.06% | |
| 13 | Indian Bank | 235.01 | 99.68% | 0.28% | 0.04% | 0.02% | |
| 14 | Bank Of India | 225.76 | 98.40% | 0.83% | 0.78% | 0.28% | |
| 15 | India Post Payments Bank Ltd. | 210.46 | 98.74% | 0.82% | 0.44% | 0.22% | |
| 16 | Indusind Bank Ltd. | 157.73 | 99.28% | 0.30% | 0.42% | 0.23% | |
| 17 | Indian Overseas Bank | 128.46 | 99.41% | 0.48% | 0.11% | 0.08% | |
| 18 | Central Bank of India | 108.51 | 99.21% | 0.57% | 0.22% | 0.10% | |
| 19 | Fino Payments Bank Ltd. | 98.36 | 97.19% | 2.68% | 0.13% | 0.04% | |
| 20 | UCO Bank | 96.02 | 99.13% | 0.53% | 0.34% | 0.05% | |
| 21 | IDBI Bank Ltd. | 81.03 | 99.45% | 0.26% | 0.29% | 0.07% | |
| 22 | Bank of Maharashtra | 78.86 | 99.38% | 0.22% | 0.40% | 0.22% | |
| 23 | RBL Bank Ltd. | 73.78 | 99.52% | 0.11% | 0.38% | 0.19% | |
| 24 | Karnataka Bank | 59.83 | 98.87% | 0.58% | 0.54% | 0.13% | |
| 25 | One Mobikwik Systems Limited | 46.10 | 99.95% | 0.00% | 0.04% | 0.00% | |
| 26 | Bandhan Bank limited | 43.29 | 98.41% | 0.21% | 1.38% | 0.16% | |
| 27 | IDFC Bank Ltd. | 42.15 | 98.96% | 1.01% | 0.03% | 0.01% | |
| 28 | The Jammu & Kashmir Bank Limited | 41.94 | 98.67% | 0.45% | 0.88% | 0.50% | |
| 29 | The South Indian Bank Limited | 39.59 | 99.20% | 0.13% | 0.67% | 0.02% | |
| 30 | Karur Vysya Bank | 39.03 | 99.37% | 0.30% | 0.33% | 0.06% | |
| 31 | Tri O Tech Solutions Private Limited | 37.15 | 96.60% | 3.39% | 0.00% | 0.00% | |
| 32 | NSDL Payments Bank Limited | 34.48 | 96.69% | 0.84% | 2.47% | 0.99% | |
| 33 | Tamilnad Mercantile Bank Limited | 31.84 | 99.52% | 0.08% | 0.40% | 0.09% | |
| 34 | AU Small Finance Bank | 30.92 | 99.15% | 0.48% | 0.37% | 0.09% | |
| 35 | City Union Bank | 27.02 | 99.41% | 0.44% | 0.15% | 0.01% | |
| 36 | JIO Payments Bank Ltd | 24.04 | 98.87% | 0.73% | 0.39% | 0.19% | |
| 37 | Ujjivan Small Finance Bank Limited | 23.56 | 99.60% | 0.23% | 0.17% | 0.17% | |
| 38 | Punjab and Sind Bank | 23.29 | 97.40% | 2.00% | 0.60% | 0.14% | |
| 39 | Kerala Gramin Bank | 21.85 | 99.37% | 0.20% | 0.43% | 0.23% | |
| 40 | Unity Small Finance Bank Limited | 20.19 | 99.89% | 0.03% | 0.08% | 0.03% | |
| 41 | Citi Bank | 18.14 | 99.46% | 0.36% | 0.18% | 0.09% | |
| 42 | Baroda U.P. Bank | 17.91 | 98.60% | 0.24% | 1.16% | 0.42% | |
| 43 | Suryoday Small Finance Bank Limited | 17.22 | 97.85% | 1.01% | 1.13% | 0.59% | |
| 44 | Telangana Grameena Bank | 14.25 | 97.13% | 0.90% | 1.96% | 1.05% | |
| 45 | Karnataka Gramin Bank | 14.19 | 98.98% | 0.15% | 0.87% | 0.42% | |
| 46 | Equitas Small Finance Bank | 13.37 | 97.13% | 2.08% | 0.79% | 0.14% | |
| 47 | ESAF Small Finance Bank Ltd | 13.30 | 99.08% | 0.18% | 0.74% | 0.22% | |
| 48 | Maharashtra Gramin Bank | 13.25 | 97.97% | 0.33% | 1.70% | 0.24% | |
| 49 | Rajasthan Marudhara Gramin Bank | 12.35 | 95.08% | 1.32% | 3.60% | 1.16% | |
| 50 | Andhra Pragathi Grameena Bank | 11.26 | 97.78% | 0.37% | 1.85% | 0.01% | |
| UPI Apps (Feb'25) | |||||||||
|---|---|---|---|---|---|---|---|---|---|
| Sr.No. | Application Name | Customer Initiated Transactions | B2C Transactions | B2B Transactions | Total | ||||
| Volume (Mn) | Value (Cr) | Volume (Mn) | Value (Cr) | Volume (Mn) | Value (Cr) | Volume (Mn) | Value (Cr) | ||
| 1 | Phone Pe # | 7,656.40 | 11,18,963.81 | 0.00 | 0.00 | 0.00 | 0.00 | 7,656.40 | 11,18,963.81 |
| 2 | Google Pay # | 5,836.80 | 7,71,089.15 | 0.00 | 0.00 | 0.00 | 0.00 | 5,836.80 | 7,71,089.15 |
| 3 | Paytm # | 1,079.64 | 1,17,090.29 | 0.00 | 0.00 | 0.00 | 0.00 | 1,079.64 | 1,17,090.29 |
| 4 | Navi # | 260.75 | 14,322.97 | 0.00 | 0.00 | 0.00 | 0.00 | 260.75 | 14,322.97 |
| 5 | super.money # | 139.10 | 4,812.44 | 0.00 | 0.00 | 0.00 | 0.00 | 139.10 | 4,812.44 |
| 6 | Cred # | 126.48 | 45,127.72 | 0.00 | 0.00 | 0.00 | 0.00 | 126.48 | 45,127.72 |
| 7 | Axis Bank Apps | 17.53 | 4,556.21 | 100.15 | 4,638.45 | 0.01 | 2.67 | 117.70 | 9,197.33 |
| 8 | Amazon Pay # | 93.31 | 9,077.30 | 0.00 | 0.00 | 0.00 | 0.00 | 93.31 | 9,077.30 |
| 9 | FamApp by Trio # | 77.08 | 876.12 | 0.00 | 0.00 | 0.00 | 0.00 | 77.08 | 876.12 |
| 10 | Whatsapp # | 58.86 | 4,349.62 | 0.00 | 0.00 | 0.00 | 0.00 | 58.86 | 4,349.62 |
| 11 | ICICI Bank Apps | 52.17 | 12,740.39 | 0.01 | 11.15 | 1.93 | 1,622.99 | 54.11 | 14,374.53 |
| 12 | Kotak Mahindra Bank Apps | 50.53 | 6,872.10 | 0.00 | 0.00 | 0.00 | 0.00 | 50.53 | 6,872.10 |
| 13 | HDFC Bank Apps | 39.26 | 10,543.20 | 8.71 | 3.71 | 0.01 | 0.73 | 47.98 | 10,547.64 |
| 14 | Yes Bank Apps | 37.40 | 8,367.66 | 0.00 | 0.09 | 0.37 | 17.31 | 37.78 | 8,385.06 |
| 15 | BHIM # | 36.88 | 8,475.29 | 0.00 | 0.00 | 0.00 | 0.00 | 36.88 | 8,475.29 |
| 16 | Mobikwik # | 24.19 | 3,733.72 | 0.00 | 0.00 | 0.00 | 0.00 | 24.19 | 3,733.72 |
| 17 | Airtel Payments Bank Apps | 18.99 | 1,349.20 | 0.00 | 0.01 | 0.00 | 0.03 | 18.99 | 1,349.23 |
| 18 | Slice # | 15.31 | 1,742.70 | 0.00 | 0.00 | 0.00 | 0.01 | 15.31 | 1,742.71 |
| 19 | Groww # | 12.81 | 8,383.73 | 0.00 | 0.00 | 0.00 | 0.00 | 12.81 | 8,383.73 |
| 20 | India Post Payments Bank Apps | 12.27 | 1,463.53 | 0.00 | 0.00 | 0.00 | 0.00 | 12.27 | 1,463.53 |
| 21 | IDFC Bank Apps | 11.98 | 2,158.27 | 0.00 | 0.00 | 0.00 | 0.02 | 11.98 | 2,158.30 |
| 22 | State Bank of India Apps | 11.68 | 3,197.67 | 0.00 | 0.00 | 0.00 | 0.00 | 11.68 | 3,197.67 |
| 23 | RBL Bank Apps | 8.76 | 1,408.32 | 0.00 | 0.00 | 0.10 | 13.57 | 8.86 | 1,421.89 |
| 24 | Bajaj Finserv # | 8.39 | 1,707.51 | 0.00 | 0.00 | 0.00 | 0.00 | 8.39 | 1,707.51 |
| 25 | Samsung Pay # | 8.09 | 576.30 | 0.00 | 0.00 | 0.00 | 0.00 | 8.09 | 576.30 |
| 26 | Pop Club # | 7.27 | 419.36 | 0.00 | 0.00 | 0.00 | 0.00 | 7.27 | 419.36 |
| 27 | Jupiter Money # | 5.95 | 858.34 | 0.00 | 0.00 | 0.00 | 0.00 | 5.95 | 858.34 |
| 28 | Flipkart UPI # | 4.42 | 238.42 | 0.00 | 0.00 | 0.00 | 0.00 | 4.42 | 238.42 |
| 29 | Federal Bank Apps | 4.08 | 715.26 | 0.00 | 0.00 | 0.00 | 0.00 | 4.08 | 715.26 |
| 30 | Jio Payments Bank Apps | 3.66 | 290.56 | 0.00 | 0.00 | 0.00 | 0.00 | 3.66 | 290.56 |
| 31 | Canara Bank Apps | 3.25 | 837.13 | 0.00 | 0.00 | 0.00 | 0.00 | 3.25 | 837.13 |
| 32 | Punjab National Bank Apps | 3.19 | 809.91 | 0.00 | 0.00 | 0.00 | 0.00 | 3.19 | 809.91 |
| 33 | Deutsche Bank Apps | 3.12 | 442.59 | 0.00 | 0.00 | 0.00 | 0.09 | 3.12 | 442.68 |
| 34 | Fi Money # | 2.99 | 377.32 | 0.00 | 0.00 | 0.00 | 0.00 | 2.99 | 377.32 |
| 35 | Timepay # | 2.19 | 28.77 | 0.00 | 0.00 | 0.00 | 0.00 | 2.19 | 28.77 |
| 36 | IndusInd Bank Apps | 1.76 | 307.45 | 0.00 | 0.00 | 0.00 | 0.00 | 1.76 | 307.45 |
| 37 | Bank of Baroda Apps | 1.72 | 472.44 | 0.00 | 0.00 | 0.00 | 0.00 | 1.72 | 472.44 |
| 38 | Jammu and Kashmir Bank Apps | 1.57 | 216.84 | 0.00 | 0.00 | 0.00 | 0.00 | 1.57 | 216.84 |
| 39 | Omni Card | 1.41 | 93.44 | 0.00 | 0.00 | 0.00 | 0.00 | 1.41 | 93.44 |
| 40 | Central Bank of India Apps | 1.36 | 233.31 | 0.00 | 0.00 | 0.00 | 0.00 | 1.36 | 233.31 |
| 41 | Shri Ram One # | 1.16 | 81.10 | 0.00 | 0.00 | 0.00 | 0.00 | 1.16 | 81.10 |
| 42 | Suryoday Bank Apps | 1.10 | 189.69 | 0.00 | 0.00 | 0.02 | 3.59 | 1.12 | 193.28 |
| 43 | Kiwi # | 1.01 | 155.81 | 0.00 | 0.00 | 0.00 | 0.00 | 1.01 | 155.81 |
| 44 | DBS Digibank Apps | 0.99 | 201.32 | 0.00 | 0.00 | 0.01 | 1.37 | 1.00 | 202.69 |
| 45 | HSBC Bank Apps | 0.81 | 186.34 | 0.00 | 0.27 | 0.00 | 0.10 | 0.82 | 186.70 |
| 46 | Ind Money # | 0.78 | 357.98 | 0.00 | 0.00 | 0.00 | 0.00 | 0.78 | 357.98 |
| 47 | Aditya Birla Capital Digital # | 0.70 | 29.68 | 0.00 | 0.00 | 0.00 | 0.00 | 0.70 | 29.68 |
| 48 | Digikhata | 0.68 | 208.81 | 0.00 | 0.00 | 0.00 | 0.00 | 0.68 | 208.81 |
| 49 | Union Bank Apps | 0.67 | 225.15 | 0.00 | 0.00 | 0.00 | 0.00 | 0.67 | 225.15 |
| 50 | One Card # | 0.66 | 742.49 | 0.00 | 0.00 | 0.00 | 0.00 | 0.66 | 742.49 |
| 51 | Bharat Pe # | 0.62 | 41.42 | 0.00 | 0.00 | 0.00 | 0.00 | 0.62 | 41.42 |
| 52 | South Indian Bank Apps | 0.62 | 178.11 | 0.00 | 0.00 | 0.00 | 0.00 | 0.62 | 178.11 |
| 53 | Indian Bank Apps | 0.61 | 168.69 | 0.00 | 0.00 | 0.00 | 0.00 | 0.61 | 168.69 |
| 54 | Fino Payments Bank Apps | 0.53 | 68.54 | 0.00 | 0.00 | 0.00 | 0.00 | 0.53 | 68.54 |
| 55 | AU Small Finance Bank Apps | 0.49 | 148.93 | 0.00 | 0.00 | 0.00 | 0.00 | 0.49 | 148.93 |
| 56 | UCO Bank Apps | 0.35 | 89.18 | 0.00 | 0.00 | 0.00 | 0.00 | 0.35 | 89.18 |
| 57 | Salary Se # | 0.30 | 15.64 | 0.00 | 0.00 | 0.00 | 0.00 | 0.30 | 15.64 |
| 58 | Tata Neu # | 0.30 | 92.32 | 0.00 | 0.00 | 0.00 | 0.00 | 0.30 | 92.32 |
| 59 | Indian Overseas Bank Apps | 0.27 | 67.20 | 0.00 | 0.00 | 0.00 | 0.00 | 0.27 | 67.20 |
| 60 | ESAF Small Finance Bank Apps | 0.27 | 26.81 | 0.00 | 0.00 | 0.00 | 0.00 | 0.27 | 26.81 |
| 61 | Bank of India Apps | 0.24 | 75.45 | 0.00 | 0.00 | 0.00 | 0.00 | 0.24 | 75.45 |
| 62 | Karnataka Bank Apps | 0.23 | 50.92 | 0.00 | 0.00 | 0.00 | 0.00 | 0.23 | 50.92 |
| 63 | Standard Chartered Bank Apps | 0.20 | 114.04 | 0.00 | 0.00 | 0.00 | 0.07 | 0.20 | 114.12 |
| 64 | Dhani | 0.15 | 7.35 | 0.00 | 0.00 | 0.00 | 0.00 | 0.15 | 7.35 |
| 65 | Money View # | 0.15 | 15.33 | 0.00 | 0.00 | 0.00 | 0.00 | 0.15 | 15.33 |
| 66 | True Balance | 0.13 | 4.64 | 0.00 | 0.00 | 0.00 | 0.00 | 0.13 | 4.64 |
| 67 | Kredit.Pe # | 0.12 | 16.73 | 0.00 | 0.00 | 0.00 | 0.00 | 0.12 | 16.73 |
| 68 | Rapipay | 0.12 | 14.62 | 0.00 | 0.00 | 0.00 | 0.00 | 0.12 | 14.62 |
| 69 | Spice Money | 0.10 | 9.88 | 0.00 | 0.00 | 0.00 | 0.00 | 0.10 | 9.88 |
| 70 | Niyo Global # | 0.09 | 46.26 | 0.00 | 0.00 | 0.00 | 0.00 | 0.09 | 46.26 |
| 71 | IDBI Bank Apps | 0.09 | 32.23 | 0.00 | 0.00 | 0.00 | 0.00 | 0.09 | 32.23 |
| 72 | Ultracash # | 0.09 | 6.62 | 0.00 | 0.00 | 0.00 | 0.00 | 0.09 | 6.62 |
| 73 | City Union Bank Apps | 0.08 | 28.98 | 0.00 | 0.00 | 0.00 | 0.00 | 0.08 | 28.98 |
| 74 | Karur Vysya Bank Apps | 0.08 | 28.60 | 0.00 | 0.00 | 0.00 | 0.00 | 0.08 | 28.60 |
| 75 | Tamilnad Mercantile Bank Apps | 0.08 | 26.47 | 0.00 | 0.00 | 0.00 | 0.00 | 0.08 | 26.47 |
| 76 | NSDL Payments Bank Apps | 0.08 | 8.12 | 0.00 | 0.00 | 0.00 | 0.00 | 0.08 | 8.12 |
| 77 | Genwise # | 0.07 | 24.26 | 0.00 | 0.00 | 0.00 | 0.00 | 0.07 | 24.26 |
| 78 | Freo # | 0.04 | 2.36 | 0.00 | 0.00 | 0.00 | 0.00 | 0.04 | 2.36 |
| 79 | Cheq | 0.03 | 2.44 | 0.00 | 0.00 | 0.00 | 0.00 | 0.03 | 2.44 |
| 80 | Punjab Sind Bank Apps | 0.03 | 9.76 | 0.00 | 0.00 | 0.00 | 0.00 | 0.03 | 9.76 |
| 81 | Bank of Maharashtra Apps | 0.02 | 9.03 | 0.00 | 0.00 | 0.00 | 0.00 | 0.02 | 9.03 |
| 82 | Others | 1.80 | 216.46 | 0.00 | 0.00 | 0.15 | 6.15 | 1.94 | 222.61 |
Note:-
| UPI P2P and P2M Transactions | ||||||
|---|---|---|---|---|---|---|
| Month | Total | P2P | P2M | |||
| Volume (Mn) | Value (Cr) | Volume (Mn) | Value (Cr) | Volume (Mn) | Value (Cr) | |
| Feb-25 | 16,106.19 | 21,96,481.69 | 6,039.45 | 16,06,397.95 | 10,066.74 | 5,90,083.74 |
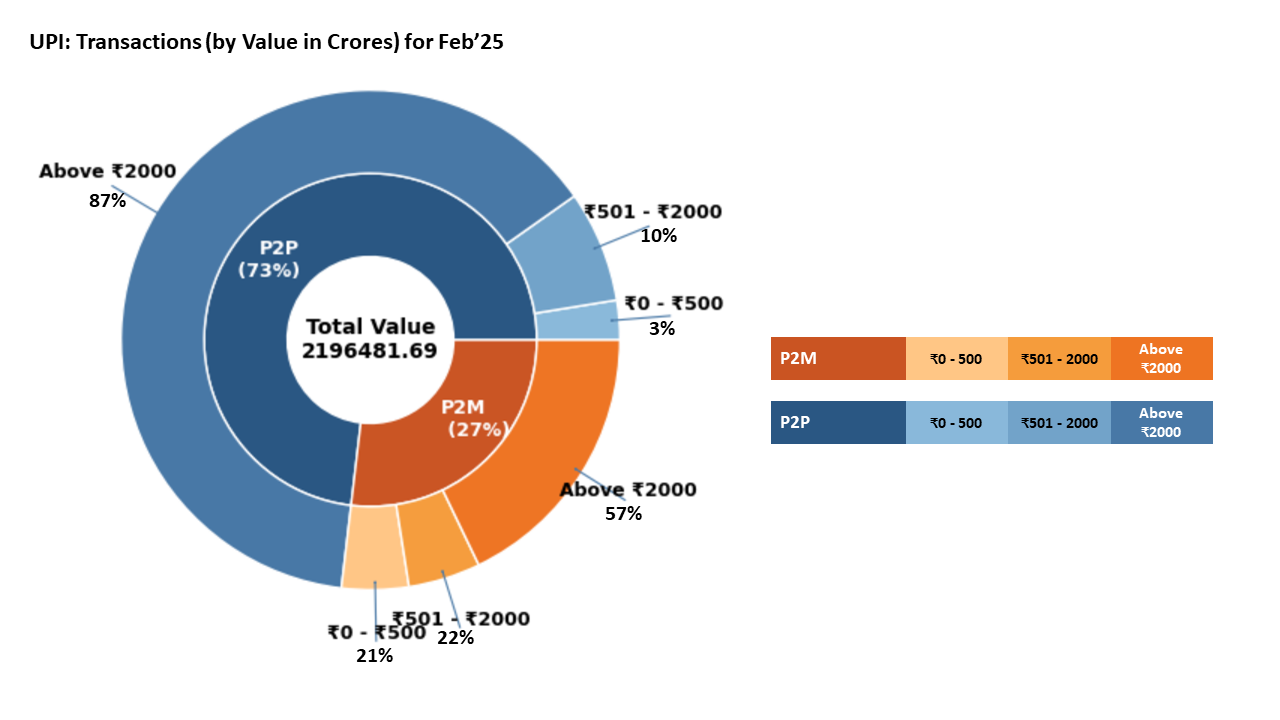
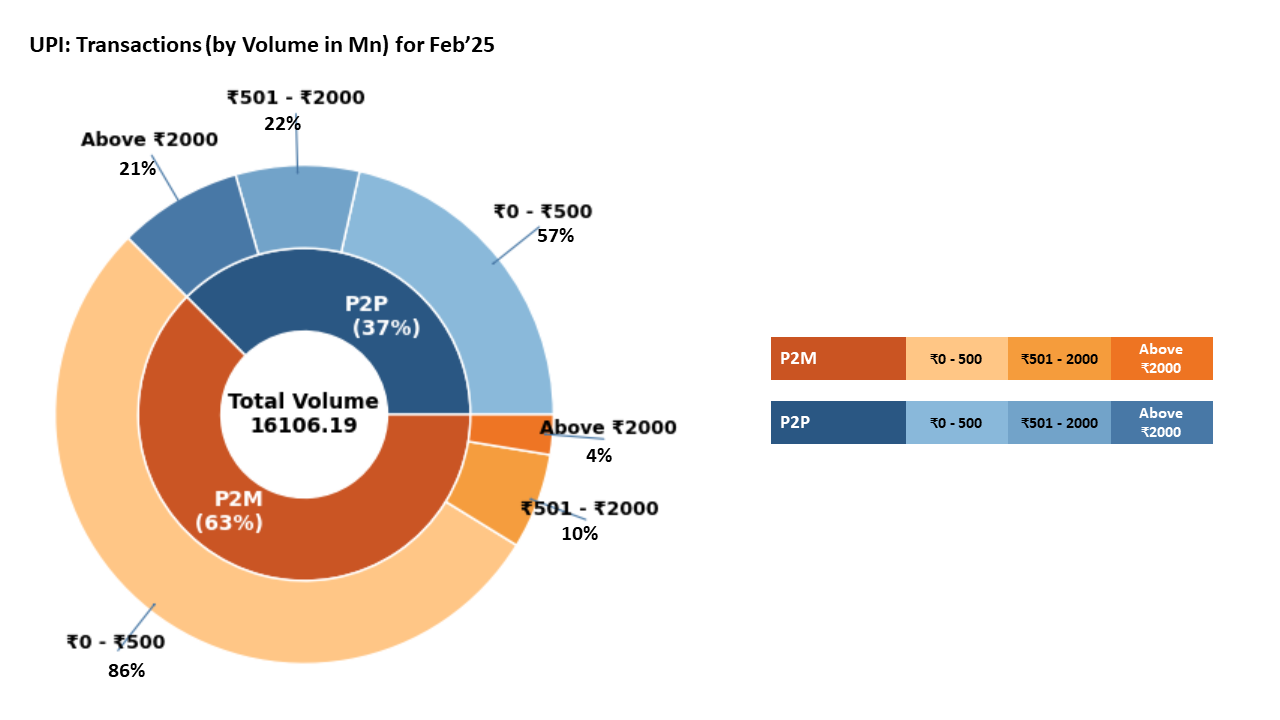
| UPI Payer PSP Performance (February'25) | |||||
|---|---|---|---|---|---|
| Sr. No. | Payer PSP | Total Volume (In Mn) | Approved % | BD % | TD % |
| 1 | Axis Bank Ltd. | 5,700.87 | 92.24% | 7.57% | 0.19% |
| 2 | Yes Bank Ltd. | 5,129.26 | 88.46% | 11.38% | 0.15% |
| 3 | ICICI Bank Ltd. | 3,081.73 | 90.89% | 8.94% | 0.16% |
| 4 | HDFC Bank Ltd. | 1,810.37 | 93.45% | 6.40% | 0.15% |
| 5 | State Bank of India | 1,599.37 | 94.58% | 5.22% | 0.20% |
| 6 | Tri O Tech Solutions Private Limited | 76.79 | 100.00% | 0.00% | 0.00% |
| 7 | Kotak Mahindra Bank | 50.89 | 100.00% | 0.00% | 0.00% |
| 8 | BHIM | 45.50 | 93.38% | 6.39% | 0.23% |
| 9 | Airtel Payments Bank Limited | 19.85 | 95.73% | 4.16% | 0.10% |
| 10 | RBL Bank Ltd. | 16.96 | 97.50% | 2.39% | 0.11% |
| 11 | IDFC Bank Ltd. | 12.83 | 99.74% | 0.26% | 0.00% |
| 12 | India Post Payments Bank Limited | 12.27 | 100.00% | 0.00% | 0.00% |
| 13 | North East Small Finance Bank | 10.97 | 96.10% | 3.76% | 0.14% |
| 14 | One Mobikwik Systems Limited | 9.98 | 100.00% | 0.00% | 0.00% |
| 15 | Federal Bank Ltd. | 7.32 | 98.68% | 1.27% | 0.05% |
| UPI Payee PSP Performance (February'25) | |||||
|---|---|---|---|---|---|
| Sr. No. | Payee PSP | Total Volume (In Mn) | Approved % | BD % | TD % |
| 1 | Yes Bank Ltd. | 9,223.00 | 88.71% | 11.13% | 0.16% |
| 2 | Axis Bank Ltd. | 3,198.69 | 94.30% | 5.52% | 0.18% |
| 3 | ICICI Bank Ltd. | 1,590.89 | 93.47% | 6.33% | 0.20% |
| 4 | HDFC Bank Ltd. | 1,010.36 | 93.72% | 6.13% | 0.15% |
| 5 | State Bank of India | 922.49 | 94.82% | 4.99% | 0.19% |
| 6 | Federal Bank Ltd. | 305.86 | 96.85% | 3.00% | 0.15% |
| 7 | Airtel Payments Bank Limited | 137.28 | 93.89% | 5.97% | 0.15% |
| 8 | Canara Bank | 130.41 | 95.44% | 4.38% | 0.18% |
| 9 | Indusind Bank Ltd. | 104.59 | 92.70% | 7.14% | 0.16% |
| 10 | RBL Bank Ltd. | 74.77 | 92.54% | 7.25% | 0.21% |
| 11 | Kotak Mahindra Bank | 61.91 | 93.86% | 5.99% | 0.15% |
| 12 | One Mobikwik Systems Limited | 47.74 | 96.47% | 3.39% | 0.13% |
| 13 | Fino Payments Bank Ltd. | 39.24 | 89.91% | 9.85% | 0.24% |
| 14 | Tri O Tech Solutions Private Limited | 38.43 | 93.12% | 6.65% | 0.23% |
| 15 | NSDL Payments Bank Limited | 28.18 | 92.73% | 7.04% | 0.23% |
| UPI Merchant Category-wise Classification - February'25 (Arranged by Volume) | ||||
|---|---|---|---|---|
| Type | MCC | Description | Volume (in Mn) | Value (in Cr.) |
| High Transacting Categories | 5411 | Groceries and supermarkets | 2,337.30 | 53,191.68 |
| 5814 | Fast food restaurants | 1,048.77 | 12,706.77 | |
| 5812 | Eating places and restaurants | 950.10 | 14,811.62 | |
| 4814 | Telecommunication services, including local and long distance calls, credit card calls, calls through use of magnetic stripe reading telephones and faxes | 774.88 | 17,922.78 | |
| 5541 | Service stations (with or without ancillary services) | 494.38 | 29,937.81 | |
| 5816 | Digital Goods: Games | 329.18 | 9,819.53 | |
| 5993 | Cigar shops and stands | 244.61 | 1,509.33 | |
| 5912 | Drug stores and pharmacies | 235.26 | 9,137.81 | |
| 5462 | Bakeries | 219.33 | 3,183.22 | |
| 4900 | Utilities electric, gas, water and sanitary | 153.13 | 16,368.03 | |
| Medium Transacting Categories | 5451 | Dairies | 137.96 | 3,593.66 |
| 7322 | Debt collection agencies | 123.78 | 76,001.18 | |
| 5921 | Package shops beer, wine and liquor | 91.13 | 3,887.16 | |
| 5813 | Drinking places (alcoholic beverages) bars, taverns, night-clubs, cocktail lounges and discothques | 84.99 | 3,222.43 | |
| 5441 | Candy, nut and confectionery shops | 81.34 | 1,583.89 | |
| 5422 | Freezer and locker meat provisioners | 80.67 | 2,610.00 | |
| 9399 | Government services not elsewhere classified | 76.08 | 7,907.32 | |
| 7230 | Beauty and barber shops | 66.56 | 1,987.42 | |
| 4112 | Passenger railways | 65.82 | 3,460.95 | |
| 5262 | Online Marketplaces | 63.81 | 4,526.55 | |
| All Other Categories | 7622 | Electronics repair shops | 63.66 | 1,927.79 |
| 5732 | Electronics shops | 61.64 | 8,001.32 | |
| 5691 | Mens and womens clothing shops | 60.92 | 8,076.66 | |
| 5137 | Mens, womens and childrens uniforms and commercial clothing | 59.42 | 5,889.72 | |
| 5331 | Variety stores | 58.51 | 3,266.88 | |
| 4121 | Taxi-cabs and limousines | 56.22 | 1,099.61 | |
| 6211 | Securities brokers and dealers | 55.96 | 44,593.96 | |
| 5311 | Department stores | 55.02 | 3,673.15 | |
| 5412 | Purchase of digital gold | 53.13 | 813.93 | |
| Others | 1,883.17 | 2,35,371.55 | ||
| Total | 10,066.74 | 5,90,083.74 | ||
| State-wise UPI Product Statistics* (Feb'25) | |||||
|---|---|---|---|---|---|
| Sr. No. | State / Union Territory | Volume (in Mn ) | Volume Contribution (%) | Value (in Cr.) | Value Contribution (%) |
| 1 | MAHARASHTRA | 1,892.66 | 11.75% | 2,19,913.73 | 10.01% |
| 2 | KARNATAKA | 974.07 | 6.05% | 1,32,442.52 | 6.03% |
| 3 | UTTAR PRADESH | 852.17 | 5.29% | 1,22,496.48 | 5.58% |
| 4 | TELANGANA | 703.40 | 4.37% | 1,11,063.09 | 5.06% |
| 5 | TAMIL NADU | 651.15 | 4.04% | 99,837.67 | 4.55% |
| 6 | ANDHRA PRADESH | 463.16 | 2.88% | 81,827.59 | 3.73% |
| 7 | RAJASTHAN | 460.58 | 2.86% | 71,687.84 | 3.26% |
| 8 | GUJARAT | 416.26 | 2.58% | 62,967.52 | 2.87% |
| 9 | MADHYA PRADESH | 389.67 | 2.42% | 53,550.10 | 2.44% |
| 10 | WEST BENGAL | 361.07 | 2.24% | 56,774.96 | 2.58% |
| 11 | DELHI | 359.92 | 2.23% | 46,373.85 | 2.11% |
| 12 | BIHAR | 357.22 | 2.22% | 56,338.15 | 2.56% |
| 13 | KERALA | 329.57 | 2.05% | 45,039.43 | 2.05% |
| 14 | HARYANA | 302.23 | 1.88% | 44,342.88 | 2.02% |
| 15 | ODISHA | 249.75 | 1.55% | 34,812.97 | 1.58% |
| 16 | PUNJAB | 166.68 | 1.03% | 29,146.47 | 1.33% |
| 17 | ASSAM | 161.35 | 1.00% | 20,021.98 | 0.91% |
| 18 | JHARKHAND | 142.33 | 0.88% | 19,879.81 | 0.91% |
| 19 | CHHATTISGARH | 111.86 | 0.69% | 15,520.81 | 0.71% |
| 20 | UTTARAKHAND | 89.78 | 0.56% | 11,561.18 | 0.53% |
| 21 | JAMMU AND KASHMIR | 60.94 | 0.38% | 8,287.11 | 0.38% |
| 22 | HIMACHAL PRADESH | 46.84 | 0.29% | 5,949.44 | 0.27% |
| 23 | GOA | 29.53 | 0.18% | 4,063.02 | 0.18% |
| 24 | CHANDIGARH | 21.37 | 0.13% | 2,680.50 | 0.12% |
| 25 | ARUNACHAL PRADESH | 15.28 | 0.09% | 2,142.10 | 0.10% |
| 26 | PUDUCHERRY | 15.15 | 0.09% | 2,116.13 | 0.10% |
| 27 | TRIPURA | 11.48 | 0.07% | 1,676.35 | 0.08% |
| 28 | MEGHALAYA | 10.88 | 0.07% | 1,615.02 | 0.07% |
| 29 | MANIPUR | 10.19 | 0.06% | 2,353.44 | 0.11% |
| 30 | DADRA & NAGAR HAVELI & DAMAN & DIU | 9.32 | 0.06% | 967.59 | 0.04% |
| 31 | MIZORAM | 8.60 | 0.05% | 1,449.75 | 0.07% |
| 32 | NAGALAND | 8.57 | 0.05% | 1,502.04 | 0.07% |
| 33 | SIKKIM | 6.31 | 0.04% | 861.53 | 0.04% |
| 34 | ANDAMAN & NICOBAR | 3.23 | 0.02% | 533.96 | 0.02% |
| 35 | LADAKH | 2.16 | 0.01% | 374.76 | 0.02% |
| 36 | LAKSHADWEEP | 0.48 | 0.00% | 55.10 | 0.00% |
| 37 | UNCLASSIFIED# | 6,410.98 | 39.80% | 8,24,254.84 | 37.53% |
| UPI Remitter Members - Top 50 Members (Jan'25) | |||||||
|---|---|---|---|---|---|---|---|
| Sr. No. | UPI Remitter Members (Jan-2025) | Total Volume (In Mn) | Approved % | BD % | TD% | Total Debit Reversal Count (In Mn) | Debit Reversal Success % |
| 1 | State Bank of India | 4,664.49 | 91.22% | 7.93% | 0.84% | 15.63 | 97.06% |
| 2 | HDFC Bank Ltd. | 1,419.33 | 93.64% | 6.28% | 0.08% | 4.12 | 98.91% |
| 3 | Bank of Baroda | 1,159.99 | 91.22% | 8.50% | 0.28% | 3.31 | 97.33% |
| 4 | Union Bank of India | 1,086.26 | 91.25% | 8.07% | 0.68% | 5.11 | 56.75% |
| 5 | Punjab National Bank | 976.62 | 89.56% | 10.31% | 0.13% | 2.99 | 98.61% |
| 6 | Kotak Mahindra Bank | 889.41 | 89.73% | 10.22% | 0.06% | 2.24 | 89.54% |
| 7 | Canara Bank | 835.68 | 91.83% | 7.80% | 0.37% | 3.08 | 79.91% |
| 8 | Axis Bank Ltd. | 821.68 | 93.47% | 6.51% | 0.02% | 1.83 | 95.14% |
| 9 | ICICI Bank Ltd. | 692.71 | 94.98% | 4.96% | 0.06% | 1.36 | 98.36% |
| 10 | Bank Of India | 556.22 | 92.58% | 7.05% | 0.37% | 2.28 | 72.53% |
| 11 | Airtel Payments Bank Limited | 553.22 | 85.84% | 13.72% | 0.45% | 2.47 | 93.68% |
| 12 | Indian Bank | 539.83 | 91.90% | 8.04% | 0.06% | 1.33 | 93.95% |
| 13 | India Post Payments Bank Ltd. | 496.43 | 83.69% | 14.80% | 1.51% | 2.60 | 57.91% |
| 14 | Indian Overseas Bank | 264.20 | 92.14% | 7.55% | 0.31% | 0.74 | 97.00% |
| 15 | Federal Bank Ltd. | 250.01 | 91.29% | 8.47% | 0.24% | 0.50 | 99.71% |
| 16 | Central Bank of India | 246.28 | 85.69% | 13.46% | 0.85% | 1.18 | 75.51% |
| 17 | UCO Bank | 231.83 | 90.85% | 8.99% | 0.16% | 0.80 | 89.97% |
| 18 | Bank of Maharashtra | 194.89 | 92.30% | 7.61% | 0.09% | 0.56 | 89.99% |
| 19 | Indusind Bank Ltd. | 191.69 | 87.62% | 12.19% | 0.19% | 0.75 | 76.62% |
| 20 | IDBI Bank Ltd. | 188.22 | 92.26% | 7.49% | 0.25% | 0.60 | 89.76% |
| 21 | Fino Payments Bank Ltd. | 185.40 | 91.80% | 8.05% | 0.14% | 0.75 | 92.17% |
| 22 | Yes Bank Ltd. | 168.50 | 84.22% | 15.59% | 0.19% | 0.51 | 56.27% |
| 23 | Karnataka Bank | 136.62 | 90.20% | 9.67% | 0.14% | 0.40 | 74.39% |
| 24 | IDFC Bank Ltd. | 104.47 | 90.66% | 9.31% | 0.03% | 0.26 | 95.79% |
| 25 | Karur Vysya Bank | 84.10 | 92.02% | 7.64% | 0.34% | 0.26 | 72.72% |
| 26 | The Jammu & Kashmir Bank Limited | 82.35 | 93.48% | 6.31% | 0.21% | 0.39 | 81.26% |
| 27 | Tri O Tech Solutions Private Limited | 78.71 | 100.00% | 0.00% | 0.00% | - | 0.00% |
| 28 | Bandhan Bank limited | 78.53 | 92.71% | 5.28% | 2.01% | 0.42 | 89.00% |
| 29 | AU Small Finance Bank | 69.84 | 86.60% | 12.25% | 1.15% | 0.48 | 60.62% |
| 30 | The South Indian Bank Limited | 67.76 | 94.10% | 5.64% | 0.26% | 0.16 | 86.88% |
| 31 | Punjab and Sind Bank | 50.26 | 90.33% | 9.39% | 0.28% | 0.23 | 88.46% |
| 32 | City Union Bank | 49.76 | 91.73% | 8.11% | 0.16% | 0.10 | 97.37% |
| 33 | Ujjivan Small Finance Bank Limited | 49.30 | 94.68% | 4.95% | 0.38% | 0.17 | 88.78% |
| 34 | Tamilnad Mercantile Bank Limited | 47.41 | 91.51% | 8.31% | 0.18% | 0.10 | 85.73% |
| 35 | Kerala Gramin Bank | 41.85 | 91.60% | 7.39% | 1.01% | 0.23 | 68.36% |
| 36 | JIO Payments Bank Ltd | 38.84 | 86.01% | 12.36% | 1.63% | 0.22 | 89.24% |
| 37 | Baroda U.P. Bank | 35.83 | 90.54% | 6.23% | 3.23% | 0.44 | 32.52% |
| 38 | Karnataka Gramin Bank | 33.43 | 86.15% | 9.39% | 4.46% | 0.52 | 72.43% |
| 39 | Rajasthan Marudhara Gramin Bank | 31.82 | 81.68% | 12.90% | 5.43% | 0.51 | 29.98% |
| 40 | Maharashtra Gramin Bank | 31.62 | 86.20% | 12.11% | 1.69% | 0.12 | 69.86% |
| 41 | Equitas Small Finance Bank | 31.07 | 90.38% | 9.51% | 0.10% | 0.09 | 98.66% |
| 42 | DBS Bank India Limited | 30.85 | 92.01% | 7.92% | 0.07% | 0.08 | 96.10% |
| 43 | ESAF Small Finance Bank Ltd | 30.15 | 95.22% | 4.46% | 0.31% | 0.09 | 96.73% |
| 44 | RBL Bank Ltd. | 29.51 | 91.90% | 7.73% | 0.37% | 0.10 | 66.25% |
| 45 | NSDL Payments Bank Limited | 29.28 | 74.94% | 20.06% | 5.00% | 0.47 | 34.88% |
| 46 | Saraswat Co-operative Bank | 28.32 | 93.24% | 6.42% | 0.34% | 0.10 | 67.53% |
| 47 | Standard Chartered Bank | 26.87 | 95.22% | 4.22% | 0.56% | 0.06 | 82.54% |
| 48 | Telangana Grameena Bank | 26.64 | 79.06% | 15.81% | 5.13% | 0.58 | 41.27% |
| 49 | Andhra Pragathi Grameena Bank | 25.58 | 76.03% | 11.90% | 12.07% | 0.98 | 30.56% |
| 50 | Sarva Haryana Gramin Bank | 21.26 | 94.63% | 4.63% | 0.73% | 0.12 | 69.44% |
| UPI Beneficiary Members - Top 50 Members (Jan'25) | |||||||
|---|---|---|---|---|---|---|---|
| Sr.No. | UPI Beneficiary Members (Jan-2025) | Total Volume (In Mn) | Approved % | BD% | TD% | Deemed Approved % | |
| 1 | Yes Bank Ltd. | 6,739.84 | 99.99% | 0.01% | 0.00% | 0.00% | |
| 2 | Axis Bank Ltd. | 1,730.16 | 99.90% | 0.10% | 0.00% | 0.01% | |
| 3 | State Bank of India | 1,713.51 | 99.56% | 0.13% | 0.31% | 0.31% | |
| 4 | HDFC Bank Ltd. | 807.76 | 99.20% | 0.75% | 0.04% | 0.04% | |
| 5 | ICICI Bank Ltd. | 624.34 | 99.55% | 0.37% | 0.08% | 0.03% | |
| 6 | Bank of Baroda | 464.01 | 99.79% | 0.06% | 0.14% | 0.13% | |
| 7 | Canara Bank | 462.95 | 99.39% | 0.41% | 0.20% | 0.15% | |
| 8 | Union Bank of India | 428.05 | 99.48% | 0.10% | 0.42% | 0.18% | |
| 9 | Federal Bank Ltd. | 403.79 | 99.81% | 0.15% | 0.03% | 0.00% | |
| 10 | Airtel Payments Bank Limited | 394.02 | 98.61% | 0.47% | 0.93% | 0.09% | |
| 11 | Punjab National Bank | 389.95 | 99.54% | 0.40% | 0.06% | 0.06% | |
| 12 | Kotak Mahindra Bank | 331.14 | 98.83% | 1.11% | 0.06% | 0.03% | |
| 13 | Indian Bank | 244.02 | 99.70% | 0.25% | 0.05% | 0.03% | |
| 14 | Bank Of India | 240.70 | 98.88% | 0.87% | 0.25% | 0.13% | |
| 15 | India Post Payments Bank Ltd. | 212.25 | 98.44% | 0.86% | 0.70% | 0.51% | |
| 16 | Indusind Bank Ltd. | 163.47 | 99.61% | 0.30% | 0.08% | 0.05% | |
| 17 | Indian Overseas Bank | 137.06 | 99.30% | 0.58% | 0.11% | 0.18% | |
| 18 | Central Bank of India | 114.31 | 98.69% | 0.54% | 0.77% | 0.34% | |
| 19 | Fino Payments Bank Ltd. | 111.51 | 98.39% | 1.51% | 0.10% | 0.03% | |
| 20 | UCO Bank | 101.81 | 99.39% | 0.48% | 0.13% | 0.03% | |
| 21 | Bank of Maharashtra | 87.68 | 99.66% | 0.23% | 0.11% | 0.03% | |
| 22 | IDBI Bank Ltd. | 82.81 | 99.62% | 0.26% | 0.12% | 0.07% | |
| 23 | RBL Bank Ltd. | 76.23 | 99.47% | 0.23% | 0.30% | 0.18% | |
| 24 | Karnataka Bank | 64.93 | 99.20% | 0.71% | 0.09% | 0.05% | |
| 25 | One Mobikwik Systems Limited | 47.73 | 99.98% | 0.01% | 0.01% | 0.00% | |
| 26 | Bandhan Bank limited | 45.82 | 97.63% | 0.22% | 2.15% | 0.11% | |
| 27 | IDFC Bank Ltd. | 44.02 | 98.94% | 1.03% | 0.03% | 0.01% | |
| 28 | The Jammu & Kashmir Bank Limited | 43.36 | 99.37% | 0.56% | 0.07% | 0.12% | |
| 29 | The South Indian Bank Limited | 42.61 | 99.76% | 0.10% | 0.14% | 0.03% | |
| 30 | Karur Vysya Bank | 40.43 | 99.55% | 0.23% | 0.22% | 0.07% | |
| 31 | Tri O Tech Solutions Private Limited | 38.46 | 96.19% | 3.72% | 0.09% | 0.04% | |
| 32 | AU Small Finance Bank | 33.08 | 98.79% | 0.45% | 0.76% | 0.26% | |
| 33 | Tamilnad Mercantile Bank Limited | 32.69 | 99.77% | 0.08% | 0.15% | 0.03% | |
| 34 | City Union Bank | 27.07 | 99.39% | 0.50% | 0.11% | 0.01% | |
| 35 | Ujjivan Small Finance Bank Limited | 25.12 | 99.48% | 0.28% | 0.24% | 0.21% | |
| 36 | Punjab and Sind Bank | 24.91 | 97.21% | 2.54% | 0.25% | 0.05% | |
| 37 | JIO Payments Bank Ltd | 24.79 | 98.66% | 0.99% | 0.35% | 0.20% | |
| 38 | Kerala Gramin Bank | 22.91 | 98.65% | 0.70% | 0.64% | 0.41% | |
| 39 | NSDL Payments Bank Limited | 21.12 | 92.36% | 3.75% | 3.89% | 0.47% | |
| 40 | Citi Bank | 20.11 | 99.53% | 0.37% | 0.10% | 0.06% | |
| 41 | Suryoday Small Finance Bank Limited | 18.64 | 97.87% | 1.11% | 1.02% | 0.51% | |
| 42 | Baroda U.P. Bank | 17.85 | 97.60% | 0.28% | 2.13% | 0.72% | |
| 43 | Karnataka Gramin Bank | 15.31 | 96.43% | 0.41% | 3.15% | 1.03% | |
| 44 | Equitas Small Finance Bank | 14.64 | 96.36% | 3.53% | 0.11% | 0.05% | |
| 45 | ESAF Small Finance Bank Ltd | 14.11 | 99.59% | 0.20% | 0.22% | 0.01% | |
| 46 | Maharashtra Gramin Bank | 13.84 | 98.68% | 0.19% | 1.12% | 0.13% | |
| 47 | Rajasthan Marudhara Gramin Bank | 13.16 | 95.99% | 0.69% | 3.31% | 0.98% | |
| 48 | Telangana Grameena Bank | 11.82 | 95.55% | 0.71% | 3.74% | 0.97% | |
| 49 | Andhra Pragathi Grameena Bank | 11.77 | 92.70% | 0.22% | 7.07% | 1.16% | |
| 50 | Unity Small Finance Bank Limited | 11.67 | 99.66% | 0.11% | 0.23% | 0.16% | |
| UPI Apps (Jan'25) | |||||||||
|---|---|---|---|---|---|---|---|---|---|
| Sr.No. | Application Name | Customer Initiated Transactions | B2C Transactions | B2B Transactions | Total | ||||
| Volume (Mn) | Value (Cr) | Volume (Mn) | Value (Cr) | Volume (Mn) | Value (Cr) | Volume (Mn) | Value (Cr) | ||
| 1 | Phone Pe # | 8,102.44 | 11,91,303.98 | 0.00 | 0.00 | 0.00 | 0.00 | 8,102.44 | 11,91,303.98 |
| 2 | Google Pay # | 6,183.91 | 8,26,845.07 | 0.00 | 0.00 | 0.00 | 0.00 | 6,183.91 | 8,26,845.07 |
| 3 | Paytm # | 1,152.34 | 1,26,313.45 | 0.00 | 0.00 | 0.00 | 0.00 | 1,152.34 | 1,26,313.45 |
| 4 | Navi # | 242.83 | 13,221.33 | 0.00 | 0.00 | 0.00 | 0.00 | 242.83 | 13,221.33 |
| 5 | Cred # | 137.44 | 49,482.95 | 0.00 | 0.00 | 0.00 | 0.00 | 137.44 | 49,482.95 |
| 6 | Axis Bank Apps | 18.90 | 4,804.76 | 107.71 | 2,961.58 | 0.01 | 2.83 | 126.62 | 7,769.17 |
| 7 | super.money # | 124.83 | 4,565.57 | 0.00 | 0.00 | 0.00 | 0.00 | 124.83 | 4,565.57 |
| 8 | Amazon Pay # | 99.95 | 9,843.47 | 0.00 | 0.00 | 0.00 | 0.00 | 99.95 | 9,843.47 |
| 9 | FamApp by Trio # | 79.01 | 896.25 | 0.00 | 0.00 | 0.00 | 0.00 | 79.01 | 896.25 |
| 10 | Whatsapp # | 60.99 | 4,550.41 | 0.00 | 0.00 | 0.00 | 0.00 | 60.99 | 4,550.41 |
| 11 | ICICI Bank Apps | 56.13 | 17,185.89 | 0.01 | 11.03 | 2.10 | 1,731.71 | 58.23 | 18,928.62 |
| 12 | Kotak Mahindra Bank Apps | 53.71 | 7,489.75 | 0.00 | 0.00 | 0.00 | 0.00 | 53.71 | 7,489.75 |
| 13 | HDFC Bank Apps | 40.42 | 11,081.87 | 9.17 | 3.86 | 0.01 | 0.69 | 49.60 | 11,086.42 |
| 14 | Yes Bank Apps | 41.18 | 8,859.55 | 0.00 | 0.00 | 0.38 | 17.71 | 41.57 | 8,877.26 |
| 15 | BHIM # | 33.88 | 9,333.77 | 0.00 | 0.00 | 0.00 | 0.00 | 33.88 | 9,333.77 |
| 16 | Mobikwik # | 23.66 | 3,811.43 | 0.00 | 0.00 | 0.00 | 0.00 | 23.66 | 3,811.43 |
| 17 | Airtel Payments Bank Apps | 20.96 | 1,498.77 | 0.00 | 0.00 | 0.00 | 0.05 | 20.96 | 1,498.83 |
| 18 | Groww # | 15.40 | 11,200.31 | 0.00 | 0.00 | 0.00 | 0.00 | 15.40 | 11,200.31 |
| 19 | India Post Payments Bank Apps | 12.57 | 1,509.59 | 0.00 | 0.00 | 0.00 | 0.00 | 12.57 | 1,509.59 |
| 20 | State Bank of India Apps | 12.49 | 3,515.63 | 0.00 | 0.00 | 0.00 | 0.00 | 12.49 | 3,515.63 |
| 21 | IDFC Bank Apps | 11.77 | 2,283.02 | 0.00 | 0.00 | 0.00 | 0.02 | 11.77 | 2,283.04 |
| 22 | RBL Bank Apps | 8.50 | 1,411.19 | 0.00 | 0.00 | 0.12 | 6.95 | 8.62 | 1,418.15 |
| 23 | Samsung Pay # | 8.57 | 608.41 | 0.00 | 0.00 | 0.00 | 0.00 | 8.57 | 608.41 |
| 24 | Bajaj Finserv # | 8.19 | 1,649.36 | 0.00 | 0.00 | 0.00 | 0.00 | 8.19 | 1,649.36 |
| 25 | Pop Club # | 8.10 | 431.96 | 0.00 | 0.00 | 0.00 | 0.00 | 8.10 | 431.96 |
| 26 | Slice # | 7.88 | 569.95 | 0.00 | 0.00 | 0.00 | 0.00 | 7.88 | 569.95 |
| 27 | Flipkart UPI # | 7.58 | 393.64 | 0.00 | 0.00 | 0.00 | 0.00 | 7.58 | 393.64 |
| 28 | Jupiter Money # | 6.31 | 913.95 | 0.00 | 0.00 | 0.00 | 0.00 | 6.31 | 913.95 |
| 29 | Federal Bank Apps | 4.30 | 744.89 | 0.00 | 0.00 | 0.00 | 0.00 | 4.30 | 744.89 |
| 30 | Jio Payments Bank Apps | 3.66 | 293.42 | 0.00 | 0.00 | 0.00 | 0.00 | 3.66 | 293.42 |
| 31 | Punjab National Bank Apps | 3.45 | 864.80 | 0.00 | 0.00 | 0.00 | 0.00 | 3.45 | 864.80 |
| 32 | Canara Bank Apps | 3.36 | 884.57 | 0.00 | 0.00 | 0.00 | 0.00 | 3.36 | 884.57 |
| 33 | Deutsche Bank Apps | 3.31 | 322.65 | 0.00 | 0.00 | 0.00 | 0.10 | 3.32 | 322.75 |
| 34 | Fi Money # | 3.25 | 401.64 | 0.00 | 0.00 | 0.00 | 0.00 | 3.25 | 401.64 |
| 35 | Indian Bank Apps | 0.62 | 174.94 | 0.00 | 0.00 | 0.00 | 0.00 | 0.62 | 174.94 |
| 36 | Timepay # | 1.80 | 22.39 | 0.00 | 0.00 | 0.00 | 0.00 | 1.80 | 22.39 |
| 37 | Suryoday Bank Apps | 1.72 | 320.78 | 0.00 | 0.00 | 0.02 | 2.94 | 1.74 | 323.72 |
| 38 | Jammu and Kashmir Bank Apps | 1.62 | 212.89 | 0.00 | 0.00 | 0.00 | 0.00 | 1.62 | 212.89 |
| 39 | Omni Card | 1.49 | 96.00 | 0.00 | 0.00 | 0.00 | 0.00 | 1.49 | 96.00 |
| 40 | Central Bank of India Apps | 1.34 | 237.42 | 0.00 | 0.00 | 0.00 | 0.00 | 1.34 | 237.42 |
| 41 | Bank of Baroda Apps | 1.23 | 442.03 | 0.00 | 0.00 | 0.00 | 0.00 | 1.23 | 442.03 |
| 42 | DBS Digibank Apps | 1.12 | 224.40 | 0.00 | 0.00 | 0.01 | 1.09 | 1.13 | 225.49 |
| 43 | Aditya Birla Capital Digital # | 0.93 | 39.03 | 0.00 | 0.00 | 0.00 | 0.00 | 0.93 | 39.03 |
| 44 | Kiwi # | 0.82 | 141.60 | 0.00 | 0.00 | 0.00 | 0.00 | 0.82 | 141.60 |
| 45 | HSBC Bank Apps | 0.82 | 201.55 | 0.00 | 0.08 | 0.00 | 0.17 | 0.82 | 201.79 |
| 46 | Union Bank Apps | 0.75 | 257.23 | 0.00 | 0.00 | 0.00 | 0.00 | 0.75 | 257.23 |
| 47 | One Card # | 0.70 | 799.37 | 0.00 | 0.00 | 0.00 | 0.00 | 0.70 | 799.37 |
| 48 | South Indian Bank Apps | 0.65 | 192.73 | 0.00 | 0.00 | 0.00 | 0.00 | 0.65 | 192.73 |
| 49 | Digikhata | 0.64 | 194.07 | 0.00 | 0.00 | 0.00 | 0.00 | 0.64 | 194.07 |
| 50 | Ind Money # | 0.63 | 293.14 | 0.00 | 0.00 | 0.00 | 0.00 | 0.63 | 293.14 |
| 51 | Shri Ram One # | 0.60 | 63.97 | 0.00 | 0.00 | 0.00 | 0.00 | 0.60 | 63.97 |
| 52 | Fino Payments Bank Apps | 0.59 | 78.97 | 0.00 | 0.00 | 0.00 | 0.00 | 0.59 | 78.97 |
| 53 | AU Small Finance Bank Apps | 0.50 | 154.34 | 0.00 | 0.00 | 0.00 | 0.01 | 0.50 | 154.35 |
| 54 | UCO Bank Apps | 0.34 | 85.35 | 0.00 | 0.00 | 0.00 | 0.00 | 0.34 | 85.35 |
| 55 | Tata Neu # | 0.30 | 89.22 | 0.00 | 0.00 | 0.00 | 0.00 | 0.30 | 89.22 |
| 56 | IndusInd Bank Apps | 1.71 | 320.32 | 0.00 | 0.00 | 0.00 | 0.00 | 1.71 | 320.32 |
| 57 | Indian Overseas Bank Apps | 0.25 | 66.56 | 0.00 | 0.00 | 0.00 | 0.00 | 0.25 | 66.56 |
| 58 | Karnataka Bank Apps | 0.25 | 52.98 | 0.00 | 0.00 | 0.00 | 0.00 | 0.25 | 52.98 |
| 59 | ESAF Small Finance Bank Apps | 0.24 | 26.70 | 0.00 | 0.00 | 0.00 | 0.00 | 0.24 | 26.70 |
| 60 | Bank of India Apps | 0.24 | 78.25 | 0.00 | 0.00 | 0.00 | 0.00 | 0.24 | 78.25 |
| 61 | True Balance | 0.23 | 9.01 | 0.00 | 0.00 | 0.00 | 0.00 | 0.23 | 9.01 |
| 62 | Bharat Pe # | 0.21 | 19.64 | 0.00 | 0.00 | 0.00 | 0.00 | 0.21 | 19.64 |
| 63 | Standard Chartered Bank Apps | 0.19 | 123.84 | 0.00 | 0.00 | 0.00 | 0.05 | 0.20 | 123.89 |
| 64 | Salary Se # | 0.16 | 7.76 | 0.00 | 0.00 | 0.00 | 0.00 | 0.16 | 7.76 |
| 65 | Dhani | 0.15 | 7.72 | 0.00 | 0.00 | 0.00 | 0.00 | 0.15 | 7.72 |
| 66 | Money View # | 0.12 | 9.77 | 0.00 | 0.00 | 0.00 | 0.00 | 0.12 | 9.77 |
| 67 | Rapipay | 0.11 | 13.96 | 0.00 | 0.00 | 0.00 | 0.00 | 0.11 | 13.96 |
| 68 | IDBI Bank Apps | 0.11 | 41.84 | 0.00 | 0.00 | 0.00 | 0.00 | 0.11 | 41.84 |
| 69 | Niyo Global # | 0.10 | 48.75 | 0.00 | 0.00 | 0.00 | 0.00 | 0.10 | 48.75 |
| 70 | Ultracash # | 0.09 | 6.74 | 0.00 | 0.00 | 0.00 | 0.00 | 0.09 | 6.74 |
| 71 | Kredit.Pe # | 0.09 | 11.04 | 0.00 | 0.00 | 0.00 | 0.00 | 0.09 | 11.04 |
| 72 | City Union Bank Apps | 0.08 | 29.52 | 0.00 | 0.00 | 0.00 | 0.00 | 0.08 | 29.52 |
| 73 | Karur Vysya Bank Apps | 0.08 | 29.32 | 0.00 | 0.00 | 0.00 | 0.00 | 0.08 | 29.32 |
| 74 | Tamilnad Mercantile Bank Apps | 0.08 | 26.96 | 0.00 | 0.00 | 0.00 | 0.00 | 0.08 | 26.96 |
| 75 | Spice Money | 0.08 | 7.67 | 0.00 | 0.00 | 0.00 | 0.00 | 0.08 | 7.67 |
| 76 | NSDL Payments Bank Apps | 0.07 | 8.35 | 0.00 | 0.00 | 0.00 | 0.00 | 0.07 | 8.35 |
| 77 | Genwise # | 0.05 | 29.81 | 0.00 | 0.00 | 0.00 | 0.00 | 0.05 | 29.81 |
| 78 | Bank of Maharashtra Apps | 0.04 | 15.22 | 0.00 | 0.00 | 0.00 | 0.00 | 0.04 | 15.22 |
| 79 | Equitas Small Finance Bank Apps | 0.04 | 28.47 | 0.00 | 0.00 | 0.00 | 0.00 | 0.04 | 28.47 |
| 80 | Cheq | 0.03 | 2.39 | 0.00 | 0.00 | 0.00 | 0.00 | 0.03 | 2.39 |
| 81 | Punjab Sind Bank Apps | 0.03 | 11.60 | 0.00 | 0.00 | 0.00 | 0.00 | 0.03 | 11.60 |
| 82 | Freo # | 0.02 | 1.55 | 0.00 | 0.00 | 0.00 | 0.00 | 0.02 | 1.55 |
| 83 | Others | 8.51 | 1,366.16 | 0.00 | 0.00 | 0.16 | 7.01 | 8.66 | 1,373.16 |
Note:-
| UPI P2P and P2M Transactions | ||||||
|---|---|---|---|---|---|---|
| Month | Total | P2P | P2M | |||
| Volume (Mn) | Value (Cr) | Volume (Mn) | Value (Cr) | Volume (Mn) | Value (Cr) | |
| Jan-25 | 16,996.00 | 23,48,037.12 | 6,426.25 | 17,03,333.03 | 10,569.75 | 6,44,704.09 |


| UPI Payer PSP Performance (January'25) | |||||
|---|---|---|---|---|---|
| Sr. No. | Payer PSP | Total Volume (In Mn) | Approved % | BD % | TD % |
| 1 | Axis Bank Ltd. | 5,954.78 | 92.28% | 7.41% | 0.31% |
| 2 | Yes Bank Ltd. | 5,406.59 | 88.09% | 11.69% | 0.23% |
| 3 | ICICI Bank Ltd. | 3,268.27 | 91.07% | 8.70% | 0.23% |
| 4 | HDFC Bank Ltd. | 1,880.42 | 93.82% | 6.06% | 0.12% |
| 5 | State Bank of India | 1,787.72 | 94.63% | 5.08% | 0.29% |
| 6 | Tri O Tech Solutions Private Limited | 78.71 | 100.00% | 0.00% | 0.00% |
| 7 | Kotak Mahindra Bank | 54.08 | 100.00% | 0.00% | 0.00% |
| 8 | BHIM | 41.96 | 93.25% | 6.45% | 0.31% |
| 9 | Airtel Payments Bank Limited | 21.89 | 95.81% | 4.06% | 0.13% |
| 10 | RBL Bank Ltd. | 17.47 | 97.38% | 2.48% | 0.14% |
| 11 | IDFC Bank Ltd. | 12.61 | 99.70% | 0.30% | 0.00% |
| 12 | India Post Payments Bank Limited | 12.57 | 100.00% | 0.00% | 0.00% |
| 13 | One Mobikwik Systems Limited | 9.80 | 100.00% | 0.00% | 0.00% |
| 14 | Federal Bank Ltd. | 7.79 | 98.68% | 1.27% | 0.06% |
| 15 | North East Small Finance Bank Acquirer | 6.96 | 96.03% | 3.83% | 0.14% |
| UPI Payee PSP Performance (January'25) | |||||
|---|---|---|---|---|---|
| Sr. No. | Payee PSP | Total Volume (In Mn) | Approved % | BD % | TD % |
| 1 | Yes Bank Ltd. | 9,744.80 | 88.81% | 10.96% | 0.24% |
| 2 | Axis Bank Ltd. | 3,353.68 | 94.17% | 5.57% | 0.26% |
| 3 | ICICI Bank Ltd. | 1,709.15 | 93.43% | 6.31% | 0.26% |
| 4 | HDFC Bank Ltd. | 1,053.52 | 93.67% | 6.09% | 0.23% |
| 5 | State Bank of India | 977.23 | 94.64% | 5.06% | 0.30% |
| 6 | Federal Bank Ltd. | 330.41 | 96.78% | 2.97% | 0.25% |
| 7 | Airtel Payments Bank Limited | 156.81 | 94.53% | 5.28% | 0.20% |
| 8 | Canara Bank | 151.47 | 94.91% | 4.85% | 0.24% |
| 9 | Indusind Bank Ltd. | 107.35 | 92.41% | 7.37% | 0.22% |
| 10 | RBL Bank Ltd. | 77.80 | 91.78% | 7.98% | 0.24% |
| 11 | Kotak Mahindra Bank | 61.33 | 91.94% | 7.84% | 0.21% |
| 12 | Fino Payments Bank Ltd. | 50.16 | 89.92% | 9.80% | 0.29% |
| 13 | One Mobikwik Systems Limited | 49.43 | 96.48% | 3.33% | 0.19% |
| 14 | Tri O Tech Solutions Private Limited | 39.67 | 92.97% | 6.72% | 0.30% |
| 15 | Indian Overseas Bank | 29.99 | 94.13% | 5.65% | 0.23% |
| UPI Merchant Category-wise Classification - January'25 (Arranged by Volume) | ||||
|---|---|---|---|---|
| Type | MCC | Description | Volume (in Mn) | Value (in Cr.) |
| High Transacting Categories | 5411 | Groceries and supermarkets | 2,421.74 | 56,040.86 |
| 5814 | Fast food restaurants | 1,116.13 | 13,324.51 | |
| 5812 | Eating places and restaurants | 1,004.01 | 16,271.84 | |
| 4814 | Telecommunication services, including local and long distance calls, credit card calls, calls through use of magnetic stripe reading telephones and faxes | 827.32 | 19,568.10 | |
| 5541 | Service stations (with or without ancillary services) | 510.96 | 30,520.41 | |
| 5816 | Digital Goods: Games | 321.59 | 10,138.84 | |
| 5993 | Cigar shops and stands | 258.97 | 1,600.98 | |
| 5912 | Drug stores and pharmacies | 246.13 | 9,634.51 | |
| 5462 | Bakeries | 231.41 | 3,439.06 | |
| 4900 | Utilities electric, gas, water and sanitary | 161.92 | 17,723.22 | |
| Medium Transacting Categories | 5451 | Dairies | 139.33 | 3,662.14 |
| 7322 | Debt collection agencies | 128.18 | 75,855.43 | |
| 5422 | Freezer and locker meat provisioners | 93.36 | 3,027.02 | |
| 5921 | Package shops beer, wine and liquor | 91.97 | 3,928.91 | |
| 5813 | Drinking places (alcoholic beverages) bars, taverns, night-clubs, cocktail lounges and discothques | 88.33 | 3,323.28 | |
| 5441 | Candy, nut and confectionery shops | 82.42 | 1,622.92 | |
| 9399 | Government services not elsewhere classified | 78.26 | 8,306.26 | |
| 5691 | Mens and womens clothing shops | 70.70 | 9,055.62 | |
| 5137 | Mens, womens and childrens uniforms and commercial clothing | 70.44 | 6,771.85 | |
| 4112 | Passenger railways | 70.40 | 3,523.29 | |
| All Other Categories | 6211 | Securities brokers and dealers | 69.67 | 63,749.83 |
| 7230 | Beauty and barber shops | 67.94 | 1,964.33 | |
| 7622 | Electronics repair shops | 67.57 | 2,041.08 | |
| 5732 | Electronics shops | 67.55 | 8,401.88 | |
| 5262 | Online Marketplaces | 64.84 | 4,964.60 | |
| 5311 | Department stores | 61.74 | 4,044.30 | |
| 4121 | Taxi-cabs and limousines | 58.94 | 1,184.44 | |
| 5331 | Variety stores | 57.42 | 3,359.23 | |
| 5412 | Purchase of digital gold | 50.93 | 761.60 | |
| Others | 1,989.57 | 2,56,893.73 | ||
| Total | 10,569.75 | 6,44,704.10 | ||
| State-wise UPI Product Statistics* (Jan'25) | |||||
|---|---|---|---|---|---|
| Sr. No. | State / Union Territory | Volume (in Mn ) | Volume Contribution (%) | Value (in Cr.) | Value Contribution (%) |
| 1 | MAHARASHTRA | 2,126.33 | 12.51% | 2,52,411.00 | 10.75% |
| 2 | KARNATAKA | 1,133.57 | 6.67% | 1,55,521.00 | 6.62% |
| 3 | UTTAR PRADESH | 952.10 | 5.60% | 1,33,054.00 | 5.67% |
| 4 | TELANGANA | 800.24 | 4.71% | 1,28,255.00 | 5.46% |
| 5 | TAMIL NADU | 715.49 | 4.21% | 1,08,619.00 | 4.63% |
| 6 | ANDHRA PRADESH | 551.81 | 3.25% | 98,020.00 | 4.17% |
| 7 | RAJASTHAN | 543.59 | 3.20% | 85,277.00 | 3.63% |
| 8 | GUJARAT | 482.44 | 2.84% | 75,270.23 | 3.21% |
| 9 | MADHYA PRADESH | 476.41 | 2.80% | 65,025.01 | 2.77% |
| 10 | WEST BENGAL | 427.10 | 2.51% | 67,764.00 | 2.89% |
| 11 | BIHAR | 415.40 | 2.44% | 63,434.86 | 2.70% |
| 12 | DELHI | 410.65 | 2.42% | 52,720.00 | 2.25% |
| 13 | KERALA | 373.18 | 2.20% | 51,570.00 | 2.20% |
| 14 | HARYANA | 339.78 | 2.00% | 50,647.00 | 2.16% |
| 15 | ODISHA | 302.73 | 1.78% | 41,451.00 | 1.77% |
| 16 | ASSAM | 187.71 | 1.10% | 23,159.08 | 0.99% |
| 17 | PUNJAB | 185.78 | 1.09% | 33,047.11 | 1.41% |
| 18 | JHARKHAND | 165.90 | 0.98% | 22,976.00 | 0.98% |
| 19 | CHHATTISGARH | 134.18 | 0.79% | 18,521.36 | 0.79% |
| 20 | UTTARAKHAND | 99.47 | 0.59% | 12,991.82 | 0.55% |
| 21 | JAMMU AND KASHMIR | 68.04 | 0.40% | 9,399.84 | 0.40% |
| 22 | HIMACHAL PRADESH | 52.98 | 0.31% | 7,024.65 | 0.30% |
| 23 | GOA | 35.15 | 0.21% | 5,030.00 | 0.21% |
| 24 | CHANDIGARH | 24.30 | 0.14% | 3,114.00 | 0.13% |
| 25 | ARUNACHAL PRADESH | 16.97 | 0.10% | 2,371.65 | 0.10% |
| 26 | PUDUCHERRY | 16.83 | 0.10% | 2,360.06 | 0.10% |
| 27 | TRIPURA | 12.56 | 0.07% | 1,860.53 | 0.08% |
| 28 | MANIPUR | 11.37 | 0.07% | 2,648.55 | 0.11% |
| 29 | MEGHALAYA | 10.99 | 0.06% | 1,672.86 | 0.07% |
| 30 | DADRA & NAGAR HAVELI & DAMAN & DIU | 10.77 | 0.06% | 1,116.37 | 0.05% |
| 31 | NAGALAND | 9.03 | 0.05% | 1,636.33 | 0.07% |
| 32 | MIZORAM | 8.72 | 0.05% | 1,467.61 | 0.06% |
| 33 | SIKKIM | 6.60 | 0.04% | 958.74 | 0.04% |
| 34 | ANDAMAN & NICOBAR | 3.73 | 0.02% | 629.14 | 0.03% |
| 35 | LADAKH | 2.40 | 0.01% | 443.79 | 0.02% |
| 36 | LAKSHADWEEP | 0.54 | 0.00% | 62.42 | 0.00% |
| 37 | UNCLASSIFIED# | 5,881.16 | 34.60% | 7,66,506.14 | 32.64% |
| UPI Remitter Members - Top 50 Members (Dec'24) | |||||||
|---|---|---|---|---|---|---|---|
| Sr. No. | UPI Remitter Members (Dec-2024) | Total Volume (In Mn) | Approved % | BD % | TD% | Total Debit Reversal Count (In Mn) | Debit Reversal Success % |
| 1 | State Bank of India | 4,540.13 | 92.94% | 6.58% | 0.48% | 13.76 | 93.82% |
| 2 | HDFC Bank Ltd. | 1,403.46 | 93.89% | 6.02% | 0.09% | 4.40 | 99.79% |
| 3 | Bank of Baroda | 1,125.93 | 91.71% | 8.19% | 0.10% | 3.32 | 98.96% |
| 4 | Union Bank of India | 1,070.69 | 91.91% | 7.96% | 0.13% | 3.40 | 83.49% |
| 5 | Punjab National Bank | 954.15 | 89.81% | 9.28% | 0.91% | 3.59 | 88.47% |
| 6 | Kotak Mahindra Bank | 872.07 | 90.25% | 9.70% | 0.05% | 2.31 | 93.59% |
| 7 | Canara Bank | 818.65 | 91.70% | 7.62% | 0.68% | 3.60 | 68.86% |
| 8 | Axis Bank Ltd. | 810.01 | 93.80% | 6.17% | 0.03% | 1.93 | 98.02% |
| 9 | ICICI Bank Ltd. | 700.67 | 95.17% | 4.72% | 0.11% | 1.69 | 94.66% |
| 10 | Bank Of India | 540.44 | 93.08% | 6.82% | 0.11% | 1.75 | 92.16% |
| 11 | Indian Bank | 524.93 | 92.51% | 7.36% | 0.13% | 1.91 | 82.89% |
| 12 | Airtel Payments Bank Limited | 521.02 | 87.15% | 12.67% | 0.18% | 2.05 | 97.38% |
| 13 | India Post Payments Bank Ltd. | 459.83 | 82.62% | 13.15% | 4.22% | 4.54 | 32.85% |
| 14 | Indian Overseas Bank | 257.21 | 92.36% | 6.99% | 0.65% | 0.97 | 95.86% |
| 15 | Federal Bank Ltd. | 245.26 | 91.87% | 8.07% | 0.06% | 0.56 | 98.82% |
| 16 | Central Bank of India | 244.52 | 85.92% | 13.64% | 0.43% | 0.84 | 93.32% |
| 17 | UCO Bank | 225.35 | 91.63% | 8.24% | 0.12% | 0.80 | 88.67% |
| 18 | Bank of Maharashtra | 188.42 | 92.05% | 7.48% | 0.48% | 0.76 | 69.76% |
| 19 | IDBI Bank Ltd. | 186.20 | 92.96% | 6.78% | 0.26% | 0.67 | 79.53% |
| 20 | Indusind Bank Ltd. | 185.78 | 88.29% | 11.53% | 0.18% | 0.73 | 79.14% |
| 21 | Fino Payments Bank Ltd. | 175.75 | 92.78% | 7.14% | 0.08% | 0.69 | 93.93% |
| 22 | Yes Bank Ltd. | 167.84 | 83.65% | 15.97% | 0.37% | 0.60 | 54.97% |
| 23 | Karnataka Bank | 132.76 | 92.27% | 7.65% | 0.08% | 0.36 | 98.50% |
| 24 | IDFC Bank Ltd. | 100.59 | 90.89% | 9.08% | 0.03% | 0.27 | 95.77% |
| 25 | Karur Vysya Bank | 83.14 | 92.16% | 7.44% | 0.39% | 0.24 | 87.62% |
| 26 | The Jammu & Kashmir Bank Limited | 81.64 | 90.33% | 5.78% | 3.89% | 1.36 | 51.28% |
| 27 | Bandhan Bank limited | 76.61 | 92.36% | 5.30% | 2.34% | 0.66 | 63.34% |
| 28 | Tri O Tech Solutions Private Limited | 75.47 | 100.00% | 0.00% | 0.00% | - | 0.00% |
| 29 | AU Small Finance Bank | 74.62 | 85.93% | 13.75% | 0.32% | 0.33 | 69.12% |
| 30 | The South Indian Bank Limited | 66.90 | 94.45% | 5.46% | 0.09% | 0.15 | 98.66% |
| 31 | Punjab and Sind Bank | 49.27 | 90.85% | 8.92% | 0.23% | 0.23 | 91.75% |
| 32 | City Union Bank | 48.89 | 92.29% | 7.58% | 0.13% | 0.10 | 99.74% |
| 33 | Ujjivan Small Finance Bank Limited | 48.39 | 94.34% | 4.94% | 0.72% | 0.23 | 67.99% |
| 34 | Tamilnad Mercantile Bank Limited | 46.51 | 92.08% | 7.65% | 0.27% | 0.12 | 82.67% |
| 35 | Kerala Gramin Bank | 41.21 | 88.28% | 6.77% | 4.95% | 0.67 | 56.93% |
| 36 | JIO Payments Bank Ltd | 33.99 | 87.33% | 11.83% | 0.83% | 0.18 | 97.31% |
| 37 | Baroda U.P. Bank | 33.15 | 91.84% | 6.86% | 1.29% | 0.22 | 64.08% |
| 38 | Equitas Small Finance Bank | 32.91 | 91.17% | 8.77% | 0.06% | 0.10 | 97.59% |
| 39 | Karnataka Gramin Bank | 32.82 | 86.77% | 8.87% | 4.36% | 0.51 | 50.11% |
| 40 | DBS Bank India Limited | 30.61 | 92.52% | 7.38% | 0.10% | 0.08 | 96.48% |
| 41 | Andhra Pradesh Grameena Vikas Bank | 29.81 | 84.21% | 14.15% | 1.64% | 0.20 | 54.38% |
| 42 | ESAF Small Finance Bank Ltd | 29.55 | 95.40% | 4.57% | 0.03% | 0.08 | 98.59% |
| 43 | Maharashtra Gramin Bank | 29.54 | 84.90% | 12.07% | 3.03% | 0.16 | 53.16% |
| 44 | Rajasthan Marudhara Gramin Bank | 29.43 | 85.89% | 12.33% | 1.79% | 0.18 | 62.47% |
| 45 | RBL Bank Ltd. | 28.58 | 92.56% | 7.22% | 0.22% | 0.09 | 71.83% |
| 46 | NSDL Payments Bank Limited | 28.19 | 85.11% | 13.49% | 1.40% | 0.24 | 56.65% |
| 47 | Saraswat Co-operative Bank | 28.07 | 93.60% | 6.03% | 0.37% | 0.11 | 72.60% |
| 48 | Standard Chartered Bank | 27.55 | 94.79% | 3.92% | 1.30% | 0.07 | 84.70% |
| 49 | Andhra Pragathi Grameena Bank | 26.11 | 75.39% | 13.44% | 11.16% | 1.03 | 69.79% |
| 50 | Sarva Haryana Gramin Bank | 21.42 | 89.43% | 6.11% | 4.46% | 0.38 | 60.41% |
| UPI Beneficiary Members - Top 50 Members (Dec'24) | |||||||
|---|---|---|---|---|---|---|---|
| Sr.No. | UPI Beneficiary Members (Dec-2024) | Total Volume (In Mn) | Approved % | BD% | TD% | Deemed Approved % | |
| 1 | Yes Bank Ltd. | 6,652.85 | 99.99% | 0.01% | 0.00% | 0.00% | |
| 2 | Axis Bank Ltd. | 1,702.85 | 99.84% | 0.15% | 0.01% | 0.01% | |
| 3 | State Bank of India | 1,701.49 | 99.49% | 0.13% | 0.38% | 0.10% | |
| 4 | HDFC Bank Ltd. | 796.13 | 99.09% | 0.85% | 0.06% | 0.04% | |
| 5 | ICICI Bank Ltd. | 627.57 | 99.60% | 0.35% | 0.05% | 0.03% | |
| 6 | Bank of Baroda | 454.56 | 99.89% | 0.06% | 0.05% | 0.07% | |
| 7 | Canara Bank | 449.07 | 99.17% | 0.32% | 0.51% | 0.21% | |
| 8 | Union Bank of India | 427.07 | 99.85% | 0.10% | 0.05% | 0.04% | |
| 9 | Federal Bank Ltd. | 409.53 | 99.82% | 0.15% | 0.03% | 0.00% | |
| 10 | Punjab National Bank | 383.19 | 99.31% | 0.31% | 0.38% | 0.36% | |
| 11 | Airtel Payments Bank Limited | 370.89 | 99.25% | 0.46% | 0.29% | 0.04% | |
| 12 | Kotak Mahindra Bank | 325.18 | 98.82% | 1.17% | 0.01% | 0.01% | |
| 13 | Indian Bank | 240.43 | 99.46% | 0.42% | 0.12% | 0.12% | |
| 14 | Bank Of India | 233.85 | 99.14% | 0.79% | 0.07% | 0.04% | |
| 15 | India Post Payment Bank | 201.40 | 96.06% | 0.92% | 3.01% | 0.39% | |
| 16 | Indusind Bank Ltd. | 158.75 | 99.60% | 0.30% | 0.10% | 0.05% | |
| 17 | Indian Overseas Bank | 131.63 | 99.12% | 0.59% | 0.29% | 0.33% | |
| 18 | Central Bank of India | 112.58 | 99.39% | 0.48% | 0.13% | 0.12% | |
| 19 | Fino Payments Bank Ltd. | 108.05 | 97.53% | 2.41% | 0.06% | 0.02% | |
| 20 | Bank of Maharashtra | 100.67 | 99.33% | 0.31% | 0.37% | 0.14% | |
| 21 | UCO Bank | 100.39 | 99.53% | 0.41% | 0.05% | 0.02% | |
| 22 | IDBI Bank Ltd. | 80.48 | 99.56% | 0.26% | 0.18% | 0.09% | |
| 23 | RBL Bank Ltd. | 64.54 | 99.61% | 0.27% | 0.13% | 0.09% | |
| 24 | Karnataka Bank | 63.01 | 99.22% | 0.67% | 0.11% | 0.01% | |
| 25 | One Mobikwik Systems Limited | 47.10 | 99.98% | 0.01% | 0.01% | 0.00% | |
| 26 | Bandhan Bank limited | 45.22 | 97.37% | 0.21% | 2.41% | 0.58% | |
| 27 | The Jammu & Kashmir Bank Limited | 44.08 | 98.29% | 0.46% | 1.25% | 0.56% | |
| 28 | IDFC Bank Ltd. | 43.59 | 99.14% | 0.81% | 0.05% | 0.01% | |
| 29 | The South Indian Bank Limited | 42.13 | 99.84% | 0.11% | 0.05% | 0.01% | |
| 30 | Karur Vysya Bank | 40.67 | 99.26% | 0.38% | 0.36% | 0.03% | |
| 31 | Tri O Tech Solutions Private Limited | 36.48 | 95.97% | 4.02% | 0.00% | 0.00% | |
| 32 | AU Small Finance Bank | 35.71 | 99.01% | 0.74% | 0.26% | 0.09% | |
| 33 | Tamilnad Mercantile Bank Limited | 32.23 | 99.70% | 0.08% | 0.22% | 0.11% | |
| 34 | City Union Bank | 27.19 | 99.46% | 0.44% | 0.11% | 0.00% | |
| 35 | Ujjivan Small Finance Bank | 24.91 | 99.33% | 0.22% | 0.45% | 0.33% | |
| 36 | Jio Payments Bank | 24.55 | 99.12% | 0.63% | 0.25% | 0.15% | |
| 37 | Punjab and Sind Bank | 23.93 | 97.65% | 2.14% | 0.21% | 0.03% | |
| 38 | Kerala Gramin Bank | 23.08 | 95.51% | 0.95% | 3.54% | 1.44% | |
| 39 | CITI Bank | 19.75 | 99.49% | 0.42% | 0.09% | 0.05% | |
| 40 | Baroda U.P. Bank | 16.63 | 98.84% | 0.32% | 0.84% | 0.22% | |
| 41 | Karnataka Gramin Bank | 15.17 | 96.52% | 0.74% | 2.74% | 1.28% | |
| 42 | Equitas Bank | 14.75 | 96.50% | 3.07% | 0.42% | 0.03% | |
| 43 | Andhra Pradesh Grameena Vikas Bank | 14.14 | 93.69% | 0.30% | 6.01% | 0.30% | |
| 44 | ESAF Small Finance Bank Ltd. | 13.83 | 99.77% | 0.18% | 0.05% | 0.01% | |
| 45 | Maharashtra Gramin Bank | 13.00 | 97.09% | 0.25% | 2.66% | 0.25% | |
| 46 | Rajasthan Marudhara Gramin Bank | 12.41 | 99.01% | 0.31% | 0.68% | 0.27% | |
| 47 | Andhra Pragathi Grameena Bank | 11.85 | 92.80% | 0.42% | 6.78% | 0.12% | |
| 48 | NSDL Payments Bank Limited | 11.85 | 97.96% | 1.18% | 0.86% | 0.33% | |
| 49 | Suryodaya Small Finance Bank Limited | 11.30 | 97.38% | 1.89% | 0.73% | 0.47% | |
| 50 | DBS Bank India Limited | 11.28 | 98.75% | 1.16% | 0.09% | 0.04% | |
| UPI Apps (Dec'24) | |||||||||
|---|---|---|---|---|---|---|---|---|---|
| Sr.No. | Application Name | Customer Initiated Transactions | B2C Transactions | B2B Transactions | Total | ||||
| Volume (Mn) | Value (Cr) | Volume (Mn) | Value (Cr) | Volume (Mn) | Value (Cr) | Volume (Mn) | Value (Cr) | ||
| 1 | PhonePe # | 7,984.05 | 11,76,300.32 | 0.00 | 0.00 | 0.00 | 0.00 | 7,984.05 | 11,76,300.32 |
| 2 | Google Pay # | 6,140.47 | 8,22,598.36 | 0.00 | 0.00 | 0.00 | 0.00 | 6,140.47 | 8,22,598.36 |
| 3 | Paytm # | 1,150.96 | 1,25,739.66 | 0.00 | 0.00 | 0.00 | 0.00 | 1,150.96 | 1,25,739.66 |
| 4 | Navi # | 202.53 | 11,317.09 | 0.00 | 0.00 | 0.00 | 0.00 | 202.53 | 11,317.09 |
| 5 | Cred # | 143.07 | 50,979.94 | 0.00 | 0.00 | 0.00 | 0.00 | 143.07 | 50,979.94 |
| 6 | Axis Bank Apps | 21.96 | 4,515.13 | 106.39 | 1,642.74 | 0.01 | 2.02 | 128.36 | 6,159.90 |
| 7 | super.money # | 101.81 | 3,866.39 | 0.00 | 0.00 | 0.00 | 0.00 | 101.81 | 3,866.39 |
| 8 | Amazon Pay # | 91.94 | 9,330.97 | 0.00 | 0.00 | 0.00 | 0.00 | 91.94 | 9,330.97 |
| 9 | FamApp by Trio # | 75.74 | 870.68 | 0.00 | 0.00 | 0.00 | 0.00 | 75.74 | 870.68 |
| 10 | ICICI Bank Apps | 59.52 | 19,670.88 | 0.01 | 10.54 | 2.33 | 2,223.13 | 61.86 | 21,904.55 |
| 11 | Whatsapp # | 57.85 | 4,348.19 | 0.00 | 0.00 | 0.00 | 0.00 | 57.85 | 4,348.19 |
| 12 | Kotak Mahindra Bank Apps | 52.06 | 7,286.24 | 0.00 | 0.00 | 0.00 | 0.00 | 52.06 | 7,286.24 |
| 13 | HDFC Bank Apps | 41.47 | 12,525.39 | 0.36 | 0.40 | 0.01 | 0.79 | 41.84 | 12,526.57 |
| 14 | Yes Bank Apps | 40.63 | 9,201.80 | 0.00 | 0.00 | 0.35 | 15.16 | 40.98 | 9,216.96 |
| 15 | BHIM # | 30.22 | 9,170.75 | 0.00 | 0.00 | 0.00 | 0.00 | 30.22 | 9,170.75 |
| 16 | Airtel Payments Bank Apps | 20.29 | 1,497.28 | 0.00 | 0.01 | 0.00 | 0.04 | 20.29 | 1,497.32 |
| 17 | Mobikwik # | 20.26 | 3,478.58 | 0.00 | 0.00 | 0.00 | 0.00 | 20.26 | 3,478.58 |
| 18 | Groww # | 13.78 | 9,341.27 | 0.00 | 0.00 | 0.00 | 0.00 | 13.78 | 9,341.27 |
| 19 | Flipkart UPI # | 12.75 | 606.35 | 0.00 | 0.00 | 0.00 | 0.00 | 12.75 | 606.35 |
| 20 | Slice # | 12.06 | 882.04 | 0.00 | 0.00 | 0.00 | 0.00 | 12.06 | 882.04 |
| 21 | State Bank of India Apps | 12.05 | 3,411.38 | 0.00 | 0.00 | 0.00 | 0.00 | 12.05 | 3,411.38 |
| 22 | India Post Payments Bank Apps | 10.76 | 1,337.10 | 0.00 | 0.00 | 0.00 | 0.00 | 10.76 | 1,337.10 |
| 23 | IDFC Bank Apps | 9.27 | 2,103.11 | 0.00 | 0.00 | 0.01 | 0.48 | 9.27 | 2,103.60 |
| 24 | Samsung Pay # | 8.59 | 614.74 | 0.00 | 0.00 | 0.00 | 0.00 | 8.59 | 614.74 |
| 25 | Bajaj Finserv # | 8.55 | 1,652.53 | 0.00 | 0.00 | 0.00 | 0.00 | 8.55 | 1,652.53 |
| 26 | RBL Bank Apps | 8.29 | 1,504.80 | 0.00 | 0.00 | 0.08 | 6.63 | 8.37 | 1,511.43 |
| 27 | Jupiter Money # | 6.41 | 910.03 | 0.00 | 0.00 | 0.00 | 0.00 | 6.41 | 910.03 |
| 28 | Pop Club # | 6.20 | 391.63 | 0.00 | 0.00 | 0.00 | 0.00 | 6.20 | 391.63 |
| 29 | Federal Bank Apps | 3.94 | 673.09 | 0.00 | 0.00 | 0.00 | 0.00 | 3.94 | 673.09 |
| 30 | Jio Payments Bank Apps | 3.46 | 287.81 | 0.00 | 0.00 | 0.00 | 0.00 | 3.46 | 287.81 |
| 31 | Deutsche Bank Apps | 3.37 | 296.77 | 0.00 | 0.00 | 0.00 | 0.10 | 3.37 | 296.88 |
| 32 | Punjab National Bank Apps | 3.32 | 792.81 | 0.00 | 0.00 | 0.00 | 0.00 | 3.32 | 792.81 |
| 33 | Fi Money # | 3.32 | 412.10 | 0.00 | 0.00 | 0.00 | 0.00 | 3.32 | 412.10 |
| 34 | Canara Bank Apps | 3.20 | 848.14 | 0.00 | 0.00 | 0.00 | 0.00 | 3.20 | 848.14 |
| 35 | Indian Bank Apps | 2.21 | 435.17 | 0.00 | 0.00 | 0.00 | 0.00 | 2.21 | 435.17 |
| 36 | Omni Card | 1.45 | 85.46 | 0.00 | 0.00 | 0.00 | 0.00 | 1.45 | 85.46 |
| 37 | Central Bank of India Apps | 1.25 | 221.54 | 0.00 | 0.00 | 0.00 | 0.00 | 1.25 | 221.54 |
| 38 | Jammu and Kashmir Bank Apps | 1.13 | 169.43 | 0.00 | 0.00 | 0.00 | 0.00 | 1.13 | 169.43 |
| 39 | Bank of Baroda Apps | 1.12 | 431.50 | 0.00 | 0.00 | 0.00 | 0.00 | 1.12 | 431.50 |
| 40 | DBS Digibank Apps | 1.06 | 218.50 | 0.00 | 0.00 | 0.01 | 1.15 | 1.07 | 219.66 |
| 41 | Timepay # | 1.01 | 13.49 | 0.00 | 0.00 | 0.00 | 0.00 | 1.01 | 13.49 |
| 42 | Suryoday Bank Apps | 0.88 | 85.71 | 0.00 | 0.00 | 0.02 | 0.62 | 0.90 | 86.33 |
| 43 | Aditya Birla Capital Digital # | 0.83 | 37.24 | 0.00 | 0.00 | 0.00 | 0.00 | 0.83 | 37.24 |
| 44 | Kiwi # | 0.81 | 134.02 | 0.00 | 0.00 | 0.00 | 0.00 | 0.81 | 134.02 |
| 45 | Union Bank Apps | 0.76 | 255.63 | 0.00 | 0.00 | 0.00 | 0.00 | 0.76 | 255.63 |
| 46 | HSBC Bank Apps | 0.73 | 194.81 | 0.00 | 0.08 | 0.00 | 0.12 | 0.74 | 195.01 |
| 47 | South Indian Bank Apps | 0.63 | 181.57 | 0.00 | 0.00 | 0.00 | 0.00 | 0.63 | 181.57 |
| 48 | Shri Ram One # | 0.61 | 57.11 | 0.00 | 0.00 | 0.00 | 0.00 | 0.61 | 57.11 |
| 49 | Digikhata | 0.56 | 170.77 | 0.00 | 0.00 | 0.00 | 0.00 | 0.56 | 170.77 |
| 50 | Fino Payments Bank Apps | 0.55 | 72.04 | 0.00 | 0.00 | 0.00 | 0.00 | 0.55 | 72.04 |
| 51 | One Card # | 0.50 | 549.10 | 0.00 | 0.00 | 0.00 | 0.00 | 0.50 | 549.10 |
| 52 | AU Small Finance Bank Apps | 0.49 | 151.24 | 0.00 | 0.00 | 0.00 | 0.00 | 0.49 | 151.24 |
| 53 | True Balance | 0.41 | 21.49 | 0.00 | 0.00 | 0.00 | 0.00 | 0.41 | 21.49 |
| 54 | IndusInd Bank Apps | 0.34 | 85.71 | 0.00 | 0.00 | 0.00 | 1.34 | 0.34 | 87.05 |
| 55 | UCO Bank Apps | 0.32 | 76.33 | 0.00 | 0.00 | 0.00 | 0.00 | 0.32 | 76.33 |
| 56 | Tata Neu # | 0.30 | 81.20 | 0.00 | 0.00 | 0.00 | 0.00 | 0.30 | 81.20 |
| 57 | Indian Overseas Bank Apps | 0.23 | 59.70 | 0.00 | 0.00 | 0.00 | 0.00 | 0.23 | 59.70 |
| 58 | Bank of India Apps | 0.22 | 68.38 | 0.00 | 0.00 | 0.00 | 0.00 | 0.22 | 68.38 |
| 59 | Karnataka Bank Apps | 0.22 | 47.38 | 0.00 | 0.00 | 0.00 | 0.00 | 0.22 | 47.38 |
| 60 | Standard Chartered Bank Apps | 0.20 | 123.15 | 0.00 | 0.00 | 0.00 | 0.04 | 0.20 | 123.19 |
| 61 | ESAF Small Finance Bank Apps | 0.19 | 20.50 | 0.00 | 0.00 | 0.00 | 0.00 | 0.19 | 20.50 |
| 62 | Dhani | 0.14 | 12.18 | 0.00 | 0.00 | 0.00 | 0.00 | 0.14 | 12.18 |
| 63 | Bharat Pe # | 0.11 | 13.25 | 0.00 | 0.00 | 0.00 | 0.00 | 0.11 | 13.25 |
| 64 | Rapipay | 0.10 | 12.52 | 0.00 | 0.00 | 0.00 | 0.00 | 0.10 | 12.52 |
| 65 | Niyo Global # | 0.10 | 56.00 | 0.00 | 0.00 | 0.00 | 0.00 | 0.10 | 56.00 |
| 66 | IDBI Bank Apps | 0.10 | 35.31 | 0.00 | 0.00 | 0.00 | 0.00 | 0.10 | 35.31 |
| 67 | Salary Se # | 0.10 | 4.80 | 0.00 | 0.00 | 0.00 | 0.00 | 0.10 | 4.80 |
| 68 | Ultracash # | 0.09 | 6.16 | 0.00 | 0.00 | 0.00 | 0.00 | 0.09 | 6.16 |
| 69 | Ind Money # | 0.08 | 28.50 | 0.00 | 0.00 | 0.00 | 0.00 | 0.08 | 28.50 |
| 70 | City Union Bank Apps | 0.08 | 28.56 | 0.00 | 0.00 | 0.00 | 0.00 | 0.08 | 28.56 |
| 71 | Tamilnad Mercantile Bank Apps | 0.08 | 25.95 | 0.00 | 0.00 | 0.00 | 0.00 | 0.08 | 25.95 |
| 72 | Karur Vysya Bank Apps | 0.07 | 24.98 | 0.00 | 0.00 | 0.00 | 0.00 | 0.07 | 24.98 |
| 73 | NSDL Payments Bank Apps | 0.07 | 8.36 | 0.00 | 0.00 | 0.00 | 0.00 | 0.07 | 8.36 |
| 74 | Spice Money | 0.06 | 5.97 | 0.00 | 0.00 | 0.00 | 0.00 | 0.06 | 5.97 |
| 75 | Money View # | 0.06 | 4.42 | 0.00 | 0.00 | 0.00 | 0.00 | 0.06 | 4.42 |
| 76 | Kredit.Pe # | 0.05 | 6.27 | 0.00 | 0.00 | 0.00 | 0.00 | 0.05 | 6.27 |
| 77 | Equitas Small Finance Bank Apps | 0.04 | 28.67 | 0.00 | 0.00 | 0.00 | 0.00 | 0.04 | 28.67 |
| 78 | Bank of Maharashtra Apps | 0.04 | 12.79 | 0.00 | 0.00 | 0.00 | 0.00 | 0.04 | 12.79 |
| 79 | Genwise # | 0.03 | 31.68 | 0.00 | 0.00 | 0.00 | 0.00 | 0.03 | 31.68 |
| 80 | Cheq | 0.03 | 2.43 | 0.00 | 0.00 | 0.00 | 0.00 | 0.03 | 2.43 |
| 81 | Freo # | 0.02 | 1.72 | 0.00 | 0.00 | 0.00 | 0.00 | 0.02 | 1.72 |
| 82 | Punjab Sind Bank Apps | 0.02 | 7.78 | 0.00 | 0.00 | 0.00 | 0.00 | 0.02 | 7.78 |
| 83 | Others | 3.23 | 483.55 | 0.00 | 0.00 | 0.15 | 6.71 | 3.39 | 490.26 |
Note:-
| UPI P2P and P2M Transactions | ||||||
|---|---|---|---|---|---|---|
| Month | Total | P2P | P2M | |||
| Volume (Mn) | Value (Cr) | Volume (Mn) | Value (Cr) | Volume (Mn) | Value (Cr) | |
| Dec-24 | 16,730.01 | 23,24,699.91 | 6,335.63 | 16,92,632.54 | 10,394.38 | 6,32,067.37 |
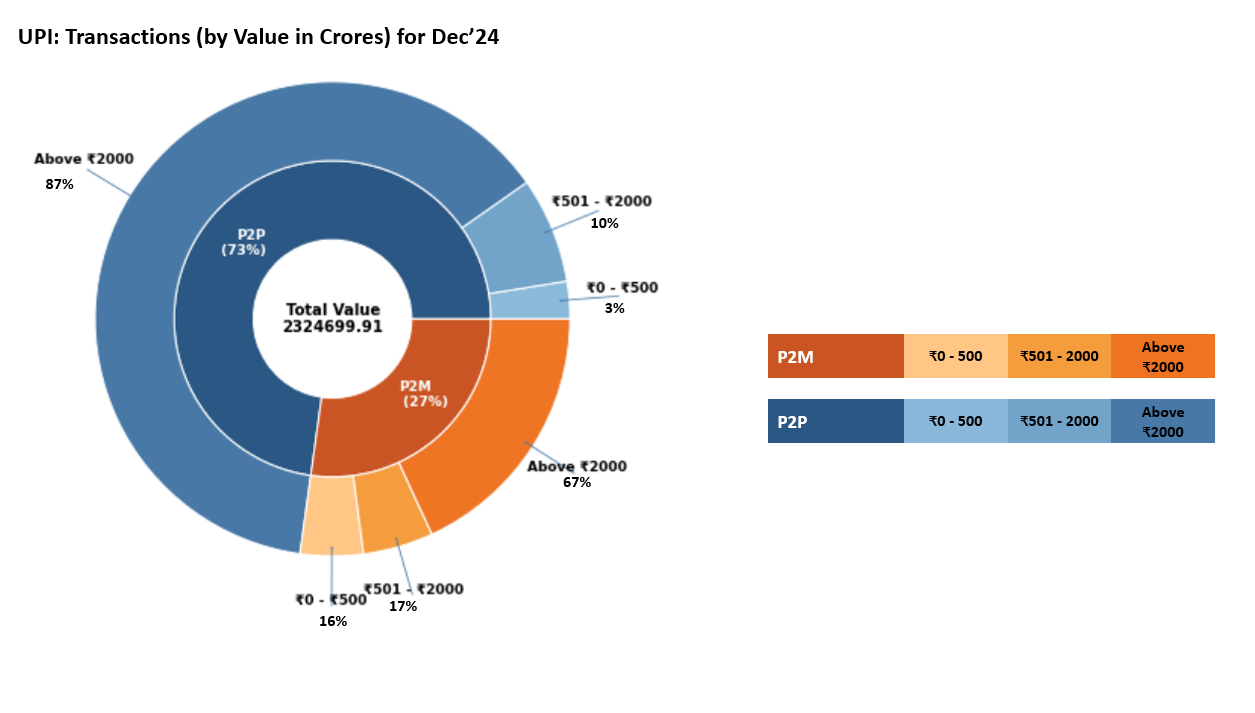
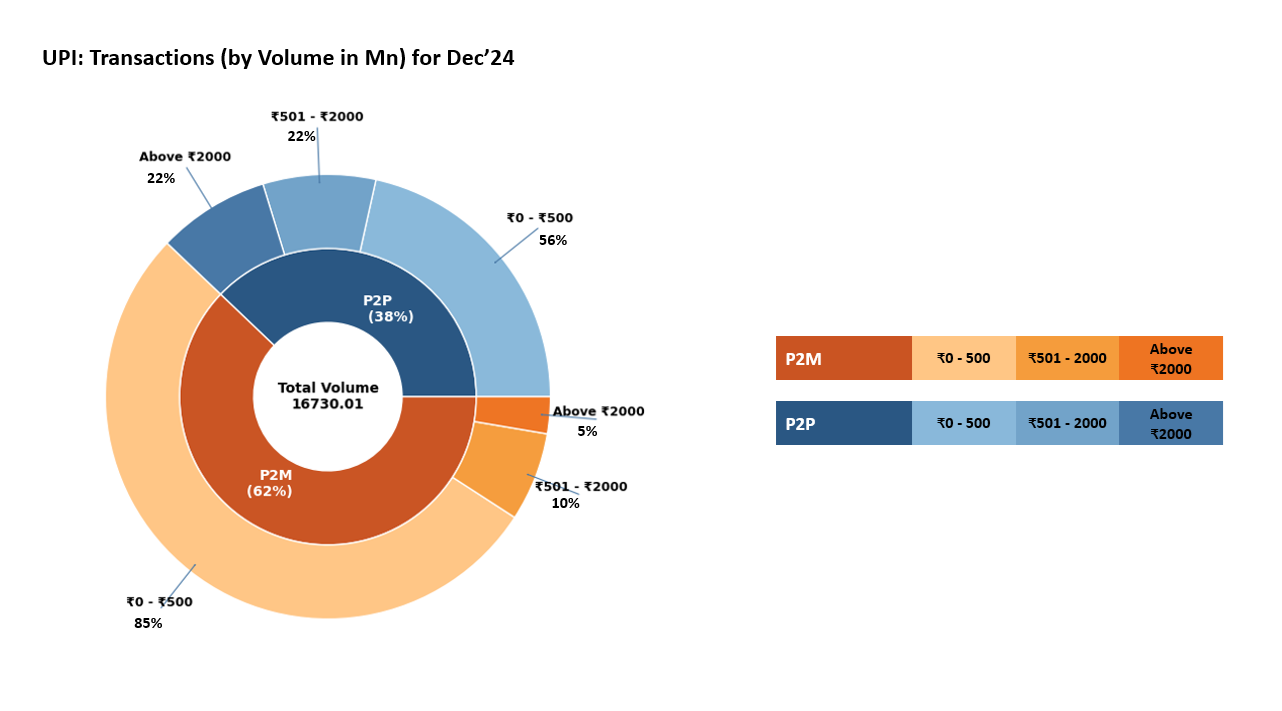
| UPI Payer PSP Performance (December'24) | |||||
|---|---|---|---|---|---|
| Sr. No. | Payer PSP | Total Volume (In Mn) | Approved % | BD % | TD % |
| 1 | Axis Bank Ltd. | 6,025.68 | 93.20% | 6.64% | 0.16% |
| 2 | Yes Bank Ltd. | 4,945.56 | 88.57% | 11.30% | 0.12% |
| 3 | ICICI Bank Ltd. | 3,082.57 | 91.84% | 8.01% | 0.15% |
| 4 | State Bank of India | 1,939.67 | 95.46% | 4.38% | 0.16% |
| 5 | HDFC Bank Ltd. | 1,876.39 | 94.19% | 5.70% | 0.11% |
| 6 | Tri O Tech Solutions Private Limited | 75.47 | 100.00% | 0.00% | 0.00% |
| 7 | Kotak Mahindra Bank | 52.43 | 100.00% | 0.00% | 0.00% |
| 8 | BHIM | 36.21 | 93.34% | 6.42% | 0.24% |
| 9 | Airtel Payments Bank Limited | 21.12 | 96.14% | 3.77% | 0.09% |
| 10 | RBL Bank Ltd. | 16.71 | 97.50% | 2.41% | 0.09% |
| 11 | India Post Payments Bank Limited | 10.76 | 100.00% | 0.00% | 0.00% |
| 12 | IDFC Bank Ltd. | 10.09 | 99.61% | 0.38% | 0.00% |
| 13 | One Mobikwik Systems Limited | 8.59 | 100.00% | 0.00% | 0.00% |
| 14 | Federal Bank Ltd. | 7.49 | 98.69% | 1.28% | 0.03% |
| 15 | Amazon | 5.76 | 100.00% | 0.00% | 0.00% |
| UPI Payee PSP Performance (December'24) | |||||
|---|---|---|---|---|---|
| Sr. No. | Payee PSP | Total Volume (In Mn) | Approved % | BD % | TD % |
| 1 | Yes Bank Ltd. | 9,422.57 | 89.88% | 9.98% | 0.14% |
| 2 | Axis Bank Ltd. | 3,353.86 | 94.59% | 5.26% | 0.15% |
| 3 | ICICI Bank Ltd. | 1,698.86 | 93.95% | 5.89% | 0.15% |
| 4 | HDFC Bank Ltd. | 1,030.36 | 94.25% | 5.61% | 0.14% |
| 5 | State Bank of India | 967.93 | 95.17% | 4.66% | 0.16% |
| 6 | Federal Bank Ltd. | 335.98 | 97.00% | 2.86% | 0.14% |
| 7 | Canara Bank | 140.46 | 95.19% | 4.67% | 0.14% |
| 8 | Airtel Payments Bank Limited | 141.75 | 95.03% | 4.85% | 0.12% |
| 9 | Indusind Bank Ltd. | 103.60 | 92.34% | 7.49% | 0.17% |
| 10 | RBL Bank Ltd. | 64.53 | 92.88% | 6.96% | 0.16% |
| 11 | Kotak Mahindra Bank | 55.88 | 92.88% | 6.98% | 0.14% |
| 12 | Fino Payments Bank Ltd. | 49.66 | 90.00% | 9.82% | 0.18% |
| 13 | One Mobikwik Systems Limited | 48.69 | 96.67% | 3.21% | 0.12% |
| 14 | Tri O Tech Solutions Private Limited | 37.29 | 93.61% | 6.20% | 0.19% |
| 15 | Bank of Maharashtra | 33.55 | 93.46% | 6.40% | 0.14% |
| UPI Merchant Category-wise Classification - December'24 (Arranged by Volume) | ||||
|---|---|---|---|---|
| Type | MCC | Description | Volume (in Mn) | Value (in Cr.) |
| High Transacting Categories | 5411 | Groceries and supermarkets | 2,382.60 | 56,221.19 |
| 5814 | Fast food restaurants | 1,118.70 | 13,664.52 | |
| 5812 | Eating places and restaurants | 992.78 | 16,592.06 | |
| 4814 | Telecommunication services, including local and long distance calls, credit card calls, calls through use of magnetic stripe reading telephones and faxes | 800.77 | 19,110.23 | |
| 5541 | Service stations (with or without ancillary services) | 506.46 | 30,717.58 | |
| 5816 | Digital Goods: Games | 282.52 | 9,272.84 | |
| 5993 | Cigar shops and stands | 252.00 | 1,561.39 | |
| 5912 | Drug stores and pharmacies | 241.63 | 9,573.50 | |
| 5462 | Bakeries | 234.15 | 3,646.54 | |
| 4900 | Utilities electric, gas, water and sanitary | 151.34 | 18,156.71 | |
| Medium Transacting Categories | 5451 | Dairies | 136.72 | 3,616.78 |
| 7322 | Debt collection agencies | 119.33 | 72,498.72 | |
| 5921 | Package shops beer, wine and liquor | 92.74 | 4,044.77 | |
| 5422 | Freezer and locker meat provisioners | 92.44 | 2,995.46 | |
| 5813 | Drinking places (alcoholic beverages) bars, taverns, night-clubs, cocktail lounges and discothques | 92.39 | 3,584.59 | |
| 5441 | Candy, nut and confectionery shops | 81.77 | 1,606.04 | |
| 5691 | Mens and womens clothing shops | 73.56 | 9,385.21 | |
| 5137 | Mens, womens and childrens uniforms and commercial clothing | 72.91 | 7,013.51 | |
| 9399 | Government services not elsewhere classified | 71.05 | 7,717.59 | |
| 7622 | Electronics repair shops | 68.45 | 2,106.12 | |
| All Other Categories | 4112 | Passenger railways | 67.77 | 3,313.16 |
| 7230 | Beauty and barber shops | 67.70 | 2,042.32 | |
| 5732 | Electronics shops | 66.31 | 8,083.42 | |
| 6211 | Securities brokers and dealers | 66.00 | 54,436.45 | |
| 5262 | Online Marketplaces | 62.42 | 4,848.69 | |
| 4121 | Taxi-cabs and limousines | 57.81 | 1,255.48 | |
| 5311 | Department stores | 56.98 | 3,985.59 | |
| 5331 | Variety stores | 55.45 | 3,261.84 | |
| 7011 | Lodging hotels, motels and resorts | 49.11 | 3,901.93 | |
| Others | 1,980.52 | 2,53,853.13 | ||
| Total | 10,394.38 | 6,32,067.37 | ||
| State-wise UPI Product Statistics* (Dec'24) | |||||
|---|---|---|---|---|---|
| Sr. No. | State / Union Territory | Volume (in Mn ) | Volume Contribution (%) | Value (in Cr.) | Value Contribution (%) |
| 1 | MAHARASHTRA | 2,231.00 | 13.34% | 2,73,245.11 | 11.75% |
| 2 | KARNATAKA | 1,294.78 | 7.74% | 1,75,534.51 | 7.55% |
| 3 | UTTAR PRADESH | 1,105.66 | 6.61% | 1,52,791.39 | 6.57% |
| 4 | TELANGANA | 993.83 | 5.94% | 1,59,350.81 | 6.85% |
| 5 | TAMIL NADU | 746.07 | 4.46% | 1,11,759.26 | 4.81% |
| 6 | RAJASTHAN | 668.56 | 4.00% | 1,02,952.49 | 4.43% |
| 7 | ANDHRA PRADESH | 638.46 | 3.82% | 1,09,740.45 | 4.72% |
| 8 | MADHYA PRADESH | 576.28 | 3.44% | 76,689.59 | 3.30% |
| 9 | BIHAR | 542.86 | 3.24% | 81,316.39 | 3.50% |
| 10 | GUJARAT | 513.73 | 3.07% | 80,180.10 | 3.45% |
| 11 | WEST BENGAL | 501.77 | 3.00% | 79,252.88 | 3.41% |
| 12 | DELHI | 487.57 | 2.91% | 60,484.71 | 2.60% |
| 13 | ODISHA | 375.25 | 2.24% | 47,492.30 | 2.04% |
| 14 | HARYANA | 372.39 | 2.23% | 54,975.91 | 2.36% |
| 15 | KERALA | 369.76 | 2.21% | 50,206.18 | 2.16% |
| 16 | ASSAM | 217.00 | 1.30% | 26,381.26 | 1.13% |
| 17 | PUNJAB | 193.15 | 1.15% | 34,024.27 | 1.46% |
| 18 | JHARKHAND | 191.78 | 1.15% | 26,267.62 | 1.13% |
| 19 | CHHATTISGARH | 154.78 | 0.93% | 20,357.81 | 0.88% |
| 20 | UTTARAKHAND | 114.11 | 0.68% | 14,712.65 | 0.63% |
| 21 | JAMMU AND KASHMIR | 74.38 | 0.44% | 10,532.87 | 0.45% |
| 22 | HIMACHAL PRADESH | 57.01 | 0.34% | 7,459.08 | 0.32% |
| 23 | GOA | 38.15 | 0.23% | 5,427.06 | 0.23% |
| 24 | CHANDIGARH | 27.53 | 0.16% | 3,623.79 | 0.16% |
| 25 | ARUNACHAL PRADESH | 17.76 | 0.11% | 2,488.91 | 0.11% |
| 26 | PUDUCHERRY | 16.13 | 0.10% | 2,217.22 | 0.10% |
| 27 | MEGHALAYA | 14.09 | 0.08% | 2,184.57 | 0.09% |
| 28 | TRIPURA | 12.49 | 0.07% | 1,886.49 | 0.08% |
| 29 | DADRA & NAGAR HAVELI & DAMAN & DIU | 11.07 | 0.07% | 1,132.38 | 0.05% |
| 30 | NAGALAND | 10.99 | 0.07% | 2,024.30 | 0.09% |
| 31 | MANIPUR | 9.68 | 0.06% | 2,442.36 | 0.11% |
| 32 | MIZORAM | 9.49 | 0.06% | 1,711.09 | 0.07% |
| 33 | SIKKIM | 7.47 | 0.04% | 1,115.33 | 0.05% |
| 34 | ANDAMAN & NICOBAR | 3.80 | 0.02% | 634.86 | 0.03% |
| 35 | LADAKH | 2.68 | 0.02% | 517.94 | 0.02% |
| 36 | LAKSHADWEEP | 0.50 | 0.00% | 55.51 | 0.00% |
| 37 | UNCLASSIFIED# | 4,128.03 | 24.67% | 5,41,530.44 | 23.29% |
| UPI Remitter Members - Top 50 Members (Nov'24) | |||||||
|---|---|---|---|---|---|---|---|
| Sr. No. | UPI Remitter Members (Nov-2024) | Total Volume (In Mn) | Approved % | BD % | TD% | Total Debit Reversal Count (In Mn) | Debit Reversal Success % |
| 1 | State Bank of India | 4,182.13 | 93.11% | 6.32% | 0.57% | 11.62 | 95.24% |
| 2 | HDFC Bank Ltd. | 1,305.92 | 94.07% | 5.83% | 0.09% | 3.64 | 98.16% |
| 3 | Bank of Baroda | 1,035.67 | 92.10% | 7.85% | 0.04% | 2.98 | 97.92% |
| 4 | Union Bank Of India | 990.08 | 92.48% | 7.29% | 0.23% | 3.33 | 79.15% |
| 5 | Punjab national Bank | 881.89 | 91.05% | 8.85% | 0.10% | 2.69 | 98.84% |
| 6 | Kotak Mahindra Bank | 804.07 | 90.49% | 9.28% | 0.23% | 2.31 | 90.77% |
| 7 | Axis Bank Ltd. | 764.59 | 94.20% | 5.78% | 0.01% | 1.93 | 98.27% |
| 8 | Canara Bank | 760.29 | 92.32% | 7.25% | 0.43% | 2.87 | 79.06% |
| 9 | ICICI Bank Ltd. | 651.55 | 95.26% | 4.56% | 0.18% | 1.65 | 96.03% |
| 10 | Bank Of India | 497.26 | 91.80% | 6.55% | 1.65% | 3.73 | 46.64% |
| 11 | Indian Bank | 484.60 | 92.78% | 7.05% | 0.17% | 1.58 | 84.18% |
| 12 | Airtel Payments Bank Ltd. | 471.39 | 87.28% | 11.79% | 0.93% | 2.74 | 82.86% |
| 13 | India Post Payments Bank Ltd. | 410.33 | 86.44% | 11.98% | 1.58% | 1.80 | 68.20% |
| 14 | Indian Overseas Bank | 232.93 | 93.11% | 6.67% | 0.22% | 0.88 | 91.20% |
| 15 | Federal Bank Ltd. | 230.20 | 91.80% | 8.01% | 0.19% | 0.57 | 97.78% |
| 16 | Central Bank of India | 223.46 | 86.59% | 12.34% | 1.07% | 0.90 | 80.64% |
| 17 | UCO Bank | 206.37 | 91.88% | 8.02% | 0.10% | 0.68 | 89.84% |
| 18 | Indusind Bank Ltd. | 172.82 | 88.99% | 10.73% | 0.29% | 0.64 | 88.52% |
| 19 | IDBI Bank Ltd. | 171.56 | 93.05% | 6.79% | 0.16% | 0.57 | 91.58% |
| 20 | Bank of Maharashtra | 167.64 | 92.54% | 7.31% | 0.15% | 0.49 | 89.66% |
| 21 | Fino Payments Bank Ltd. | 161.47 | 92.82% | 7.06% | 0.12% | 0.69 | 90.58% |
| 22 | YES Bank Ltd. | 155.30 | 83.24% | 16.36% | 0.40% | 0.52 | 58.31% |
| 23 | Karnataka Bank | 122.37 | 91.67% | 7.33% | 1.01% | 0.56 | 66.08% |
| 24 | IDFC Bank Ltd. | 93.14 | 91.39% | 8.41% | 0.20% | 0.16 | 0.29% |
| 25 | The Jammu & Kashmir Bank Limited | 76.44 | 90.29% | 5.42% | 4.29% | 1.42 | 17.72% |
| 26 | Karur Vysya Bank | 76.29 | 92.70% | 7.11% | 0.19% | 0.21 | 95.76% |
| 27 | Bandhan Bank limited | 70.96 | 93.36% | 5.09% | 1.55% | 0.39 | 88.49% |
| 28 | AU Small Finance Bank | 70.55 | 88.57% | 11.23% | 0.20% | 0.22 | 97.17% |
| 29 | Tri O Tech Solutions Private Limited | 67.20 | 100.00% | 0.00% | 0.00% | #N/A | #N/A |
| 30 | The South Indian Bank Limited | 62.85 | 94.65% | 5.28% | 0.07% | 0.13 | 99.31% |
| 31 | Punjab and Sind Bank | 45.44 | 91.51% | 8.40% | 0.10% | 0.18 | 97.14% |
| 32 | Ujjivan Small Finance Bank Limited | 45.21 | 94.64% | 4.99% | 0.38% | 0.17 | 81.70% |
| 33 | City Union Bank | 44.74 | 92.56% | 7.28% | 0.16% | 0.10 | 99.52% |
| 34 | Tamilnad Mercantile Bank Limited | 42.47 | 91.84% | 7.70% | 0.46% | 0.13 | 75.60% |
| 35 | Kerala Gramin Bank | 39.89 | 87.74% | 6.37% | 5.89% | 0.74 | 64.31% |
| 36 | Equitas Small Finance Bank | 31.78 | 91.99% | 7.98% | 0.03% | 0.10 | 98.07% |
| 37 | Andhra Pradesh Grameena Vikas Bank | 31.66 | 82.74% | 11.59% | 5.67% | 0.36 | 65.41% |
| 38 | Karnataka Gramin Bank | 30.31 | 88.07% | 8.52% | 3.41% | 0.38 | 72.85% |
| 39 | Baroda U.P. Bank | 29.74 | 91.65% | 6.65% | 1.69% | 0.28 | 44.05% |
| 40 | JIO Payments Bank Ltd | 28.80 | 87.77% | 10.99% | 1.24% | 0.21 | 99.25% |
| 41 | DBS Bank India Limited | 28.24 | 92.03% | 7.53% | 0.44% | 0.11 | 71.54% |
| 42 | ESAF Small Finance Bank Ltd | 27.19 | 95.50% | 4.39% | 0.11% | 0.08 | 98.12% |
| 43 | Rajasthan Marudhara Gramin Bank | 26.47 | 85.94% | 11.80% | 2.26% | 0.11 | 81.31% |
| 44 | Standard Chartered Bank | 25.87 | 95.57% | 3.79% | 0.64% | 0.08 | 81.38% |
| 45 | Maharashtra Gramin Bank | 25.80 | 86.35% | 12.55% | 1.09% | 0.11 | 64.26% |
| 46 | Saraswat Co-operative Bank | 25.49 | 93.87% | 5.99% | 0.14% | 0.08 | 87.37% |
| 47 | NSDL Payments Bank Limited | 24.28 | 86.08% | 12.61% | 1.31% | 0.20 | 6.11% |
| 48 | RBL Bank Ltd. | 23.47 | 91.69% | 7.95% | 0.35% | 0.09 | 63.63% |
| 49 | Andhra Pragathi Grameena Bank | 21.61 | 83.33% | 10.78% | 5.89% | 0.38 | 53.99% |
| 50 | Sarva Haryana Gramin Bank | 20.09 | 93.42% | 6.14% | 0.44% | 0.11 | 68.48% |
| UPI Beneficiary Members - Top 50 Members (Nov'24) | |||||||
|---|---|---|---|---|---|---|---|
| Sr.No. | UPI Beneficiary Members (Nov-2024) | Total Volume (In Mn) | Approved % | BD% | TD% | Deemed Approved % | |
| 1 | Yes Bank Ltd | 6,213.24 | 99.99% | 0.01% | 0.01% | 0.00% | |
| 2 | State Bank of India | 1,566.68 | 99.50% | 0.13% | 0.38% | 0.14% | |
| 3 | Axis Bank | 1,561.95 | 99.92% | 0.07% | 0.01% | 0.01% | |
| 4 | HDFC Bank | 740.76 | 98.78% | 0.97% | 0.25% | 0.02% | |
| 5 | ICICI Bank | 591.09 | 99.49% | 0.41% | 0.10% | 0.05% | |
| 6 | Canara Bank | 427.61 | 99.27% | 0.32% | 0.33% | 0.15% | |
| 7 | Bank of Baroda | 417.34 | 99.86% | 0.06% | 0.07% | 0.04% | |
| 8 | Union Bank Of India | 395.19 | 99.73% | 0.10% | 0.17% | 0.06% | |
| 9 | Federal Bank | 387.11 | 99.73% | 0.21% | 0.06% | 0.00% | |
| 10 | Punjab national Bank | 356.82 | 99.71% | 0.27% | 0.01% | 0.11% | |
| 11 | Airtel Payments Bank | 319.58 | 99.19% | 0.29% | 0.51% | 0.21% | |
| 12 | Kotak Mahindra Bank | 294.25 | 98.52% | 1.29% | 0.18% | 0.11% | |
| 13 | Indian Bank | 220.32 | 99.14% | 0.71% | 0.12% | 0.08% | |
| 14 | Bank Of India | 215.19 | 97.84% | 0.78% | 1.38% | 0.48% | |
| 15 | India Post Payment Bank | 183.87 | 98.71% | 0.37% | 0.91% | 0.18% | |
| 16 | Indusind Bank | 152.52 | 99.40% | 0.32% | 0.28% | 0.17% | |
| 17 | Indian Overseas Bank | 122.51 | 99.27% | 0.62% | 0.10% | 0.26% | |
| 18 | Central Bank of India | 105.60 | 98.43% | 1.01% | 0.55% | 0.60% | |
| 19 | Fino Payments Bank Limited | 93.78 | 95.72% | 4.12% | 0.16% | 0.06% | |
| 20 | UCO Bank | 92.37 | 99.10% | 0.39% | 0.51% | 0.03% | |
| 21 | Bank of Maharashtra | 85.17 | 99.63% | 0.24% | 0.13% | 0.03% | |
| 22 | IDBI Bank | 73.44 | 99.61% | 0.27% | 0.12% | 0.04% | |
| 23 | Karnataka Bank | 57.56 | 97.80% | 0.69% | 1.51% | 0.18% | |
| 24 | RBL Bank Limited | 52.00 | 99.46% | 0.43% | 0.11% | 0.06% | |
| 25 | One Mobikwik Systems Limited | 44.12 | 99.96% | 0.01% | 0.03% | 0.00% | |
| 26 | The Jammu & Kashmir Bank Limited | 41.98 | 98.49% | 0.23% | 1.27% | 1.12% | |
| 27 | Bandhan Bank limited | 41.87 | 98.54% | 0.21% | 1.26% | 0.19% | |
| 28 | IDFC First Bank Ltd | 40.46 | 99.07% | 0.89% | 0.04% | 0.01% | |
| 29 | The South Indian Bank Limited | 39.73 | 99.86% | 0.11% | 0.04% | 0.01% | |
| 30 | Karur Vysya Bank | 37.20 | 99.62% | 0.25% | 0.13% | 0.02% | |
| 31 | AU small Finance Bank | 34.50 | 99.18% | 0.69% | 0.13% | 0.05% | |
| 32 | Tri O Tech Solutions Private Limited | 31.76 | 96.11% | 3.88% | 0.01% | 0.00% | |
| 33 | Tamilnad Mercantile Bank Limited | 28.98 | 99.53% | 0.09% | 0.39% | 0.10% | |
| 34 | City Union Bank | 24.61 | 99.41% | 0.40% | 0.19% | 0.01% | |
| 35 | Ujjivan Small Finance Bank | 23.21 | 99.54% | 0.20% | 0.26% | 0.16% | |
| 36 | Kerala Gramin Bank | 21.94 | 95.27% | 0.93% | 3.80% | 1.49% | |
| 37 | Punjab and Sind Bank | 21.92 | 97.62% | 2.28% | 0.10% | 0.01% | |
| 38 | Jio Payments Bank | 19.35 | 99.04% | 0.55% | 0.41% | 0.35% | |
| 39 | CITI Bank | 18.46 | 99.41% | 0.47% | 0.13% | 0.13% | |
| 40 | Baroda UP Gramin Bank | 15.14 | 98.54% | 0.28% | 1.18% | 0.54% | |
| 41 | Andhra Pradesh Grameena Vikas Bank | 14.47 | 96.09% | 0.30% | 3.61% | 0.26% | |
| 42 | Pragathi Krishna Gramin Bank | 13.99 | 97.27% | 0.99% | 1.74% | 1.10% | |
| 43 | Equitas Bank | 13.26 | 98.22% | 1.46% | 0.32% | 0.00% | |
| 44 | ESAF Small Finance Bank Ltd. | 12.77 | 99.70% | 0.18% | 0.12% | 0.04% | |
| 45 | Maharashtra Gramin Bank | 11.55 | 98.92% | 0.14% | 0.95% | 0.10% | |
| 46 | Rajasthan Marudhara Gramin Bank | 11.16 | 99.11% | 0.33% | 0.56% | 0.08% | |
| 47 | NSDL Payments Bank Limited | 11.06 | 98.08% | 1.19% | 0.73% | 0.31% | |
| 48 | DBS Bank India Limited | 10.59 | 98.35% | 1.14% | 0.50% | 0.13% | |
| 49 | Andhra Pragathi Grameena Bank | 10.41 | 95.63% | 0.24% | 4.12% | 0.27% | |
| 50 | Sarva Haryana Gramin Bank | 8.65 | 99.32% | 0.36% | 0.32% | 0.15% | |
| UPI Apps (Nov'24) | |||||||||
|---|---|---|---|---|---|---|---|---|---|
| Sr.No. | Application Name | Customer Initiated Transactions | B2C Transactions | B2B Transactions | Total | ||||
| Volume (Mn) | Value (Cr) | Volume (Mn) | Value (Cr) | Volume (Mn) | Value (Cr) | Volume (Mn) | Value (Cr) | ||
| 1 | PhonePe # | 7,401.93 | 10,88,635.03 | 0.00 | 0.00 | 0.00 | 0.00 | 7,401.93 | 10,88,635.03 |
| 2 | Google Pay # | 5,739.12 | 7,64,639.66 | 0.00 | 0.00 | 0.00 | 0.00 | 5,739.12 | 7,64,639.66 |
| 3 | Paytm (OCL) # | 1,075.09 | 1,18,004.06 | 0.00 | 0.00 | 0.00 | 0.00 | 1,075.09 | 1,18,004.06 |
| 4 | Navi # | 152.95 | 8,806.45 | 0.00 | 0.00 | 0.00 | 0.00 | 152.95 | 8,806.45 |
| 5 | Cred # | 138.24 | 50,560.48 | 0.00 | 0.00 | 0.00 | 0.00 | 138.24 | 50,560.48 |
| 6 | Axis Bank Apps | 22.20 | 4,151.71 | 108.14 | 2,184.35 | 0.01 | 1.78 | 130.36 | 6,337.84 |
| 7 | super.money # | 78.49 | 3,130.10 | 0.00 | 0.00 | 0.00 | 0.00 | 78.49 | 3,130.10 |
| 8 | Amazon Pay # | 71.60 | 7,914.87 | 0.00 | 0.00 | 0.00 | 0.00 | 71.60 | 7,914.87 |
| 9 | FamApp by Trio # | 67.41 | 777.46 | 0.00 | 0.00 | 0.00 | 0.00 | 67.41 | 777.46 |
| 10 | ICICI Bank Apps | 51.13 | 18,538.92 | 0.01 | 8.18 | 2.57 | 2,951.05 | 53.71 | 21,498.14 |
| 11 | Whatsapp # | 51.76 | 3,890.10 | 0.00 | 0.00 | 0.00 | 0.00 | 51.76 | 3,890.10 |
| 12 | Kotak Mahindra Bank Apps | 47.35 | 6,583.09 | 0.00 | 0.00 | 0.00 | 0.00 | 47.35 | 6,583.09 |
| 13 | HDFC Bank Apps | 36.67 | 10,416.41 | 0.16 | 0.34 | 0.01 | 0.52 | 36.84 | 10,417.27 |
| 14 | Yes Bank Apps | 35.35 | 9,201.05 | 0.00 | 0.03 | 0.33 | 14.02 | 35.69 | 9,215.09 |
| 15 | BHIM # | 27.05 | 8,210.65 | 0.00 | 0.00 | 0.00 | 0.00 | 27.05 | 8,210.65 |
| 16 | Airtel Payments Bank Apps | 18.60 | 1,389.67 | 0.00 | 0.00 | 0.00 | 0.05 | 18.60 | 1,389.73 |
| 17 | Mobikwik # | 16.63 | 2,942.38 | 0.00 | 0.00 | 0.00 | 0.00 | 16.63 | 2,942.38 |
| 18 | Flipkart UPI # | 13.25 | 636.91 | 0.00 | 0.00 | 0.00 | 0.00 | 13.25 | 636.91 |
| 19 | Groww # | 13.22 | 8,479.87 | 0.00 | 0.00 | 0.00 | 0.00 | 13.22 | 8,479.87 |
| 20 | Slice # | 11.54 | 845.13 | 0.00 | 0.00 | 0.00 | 0.00 | 11.54 | 845.13 |
| 21 | State Bank of India Apps | 10.46 | 3,035.13 | 0.00 | 0.00 | 0.00 | 0.00 | 10.46 | 3,035.13 |
| 22 | India Post Payments Bank Apps | 8.91 | 1,131.95 | 0.00 | 0.00 | 0.00 | 0.00 | 8.91 | 1,131.95 |
| 23 | IDFC Bank Apps | 8.59 | 1,931.32 | 0.00 | 0.00 | 0.01 | 1.00 | 8.60 | 1,932.32 |
| 24 | Bajaj Finserv # | 8.10 | 1,584.15 | 0.00 | 0.00 | 0.00 | 0.00 | 8.10 | 1,584.15 |
| 25 | Samsung Pay # | 7.90 | 578.99 | 0.00 | 0.00 | 0.00 | 0.00 | 7.90 | 578.99 |
| 26 | Jupiter Money # | 6.02 | 825.36 | 0.00 | 0.00 | 0.00 | 0.00 | 6.02 | 825.36 |
| 27 | RBL Bank Apps | 4.99 | 908.57 | 0.00 | 0.00 | 0.04 | 5.71 | 5.03 | 914.28 |
| 28 | Pop Club # | 4.00 | 267.15 | 0.00 | 0.00 | 0.00 | 0.00 | 4.00 | 267.15 |
| 29 | Federal Bank Apps | 3.36 | 578.23 | 0.00 | 0.00 | 0.00 | 0.00 | 3.36 | 578.23 |
| 30 | Punjab National Bank Apps | 3.31 | 753.10 | 0.00 | 0.00 | 0.00 | 0.00 | 3.31 | 753.10 |
| 31 | Jio Payments Bank Apps | 3.18 | 263.81 | 0.00 | 0.00 | 0.00 | 0.00 | 3.18 | 263.81 |
| 32 | Fi Money # | 3.07 | 373.29 | 0.00 | 0.00 | 0.00 | 0.00 | 3.07 | 373.29 |
| 33 | Canara Bank Apps | 3.01 | 802.16 | 0.00 | 0.00 | 0.00 | 0.00 | 3.01 | 802.16 |
| 34 | Deutsche Bank Apps | 2.68 | 400.97 | 0.00 | 0.00 | 0.00 | 0.07 | 2.68 | 401.03 |
| 35 | Indian Bank Apps | 0.48 | 134.27 | 0.00 | 0.00 | 0.00 | 0.00 | 0.48 | 134.27 |
| 36 | Timepay # | 1.72 | 19.88 | 0.00 | 0.00 | 0.00 | 0.00 | 1.72 | 19.88 |
| 37 | Omni Card | 1.35 | 100.86 | 0.00 | 0.00 | 0.00 | 0.00 | 1.35 | 100.86 |
| 38 | Central Bank of India Apps | 1.06 | 197.17 | 0.00 | 0.00 | 0.00 | 0.00 | 1.06 | 197.17 |
| 39 | Bank of Baroda Apps | 1.01 | 389.10 | 0.00 | 0.00 | 0.00 | 0.00 | 1.01 | 389.10 |
| 40 | Jammu and Kashmir Bank Apps | 0.79 | 135.44 | 0.00 | 0.00 | 0.00 | 0.00 | 0.79 | 135.44 |
| 41 | Union Bank Apps | 0.73 | 238.56 | 0.00 | 0.00 | 0.00 | 0.00 | 0.73 | 238.56 |
| 42 | Kiwi # | 0.69 | 106.42 | 0.00 | 0.00 | 0.00 | 0.00 | 0.69 | 106.42 |
| 43 | HSBC Bank Apps | 0.68 | 176.26 | 0.00 | 0.10 | 0.00 | 0.09 | 0.68 | 176.45 |
| 44 | Aditya Birla Capital Digital | 0.66 | 30.09 | 0.00 | 0.00 | 0.00 | 0.00 | 0.66 | 30.09 |
| 45 | South Indian Bank Apps | 0.59 | 167.92 | 0.00 | 0.00 | 0.00 | 0.00 | 0.59 | 167.92 |
| 46 | DBS Digibank Apps | 0.57 | 190.59 | 0.00 | 0.00 | 0.00 | 1.14 | 0.57 | 191.73 |
| 47 | Fino Payments Bank Apps | 0.51 | 64.81 | 0.00 | 0.00 | 0.00 | 0.00 | 0.51 | 64.81 |
| 48 | Digikhata | 0.46 | 156.43 | 0.00 | 0.00 | 0.00 | 0.00 | 0.46 | 156.43 |
| 49 | AU Small Finance Bank Apps | 0.45 | 134.47 | 0.00 | 0.00 | 0.00 | 0.00 | 0.45 | 134.47 |
| 50 | Shri Ram One # | 0.38 | 39.72 | 0.00 | 0.00 | 0.00 | 0.00 | 0.38 | 39.72 |
| 51 | IndusInd Bank Apps | 2.07 | 368.24 | 0.00 | 0.00 | 0.00 | 0.00 | 2.07 | 368.24 |
| 52 | One Card # | 0.36 | 356.22 | 0.00 | 0.00 | 0.00 | 0.00 | 0.36 | 356.22 |
| 53 | Tata Neu # | 0.30 | 78.83 | 0.00 | 0.00 | 0.00 | 0.00 | 0.30 | 78.83 |
| 54 | True Balance | 0.29 | 33.18 | 0.00 | 0.00 | 0.00 | 0.00 | 0.29 | 33.18 |
| 55 | UCO Bank Apps | 0.28 | 66.32 | 0.00 | 0.00 | 0.00 | 0.00 | 0.28 | 66.32 |
| 56 | Bank of India Apps | 0.20 | 55.80 | 0.00 | 0.00 | 0.00 | 0.00 | 0.20 | 55.80 |
| 57 | Standard Chartered Bank Apps | 0.18 | 114.58 | 0.00 | 0.00 | 0.00 | 0.00 | 0.18 | 114.58 |
| 58 | Indian Overseas Bank Apps | 0.18 | 49.21 | 0.00 | 0.00 | - | - | 0.18 | 49.21 |
| 59 | Karnataka Bank Apps | 0.18 | 38.31 | 0.00 | 0.00 | 0.00 | 0.00 | 0.18 | 38.31 |
| 60 | Dhani | 0.13 | 13.25 | 0.00 | 0.00 | 0.00 | 0.00 | 0.13 | 13.25 |
| 61 | ESAF Small Finance Bank Apps | 0.12 | 14.69 | 0.00 | 0.00 | 0.00 | 0.00 | 0.12 | 14.69 |
| 62 | Niyo Global # | 0.09 | 52.41 | 0.00 | 0.00 | 0.00 | 0.00 | 0.09 | 52.41 |
| 63 | Rapipay | 0.09 | 11.70 | 0.00 | 0.00 | 0.00 | 0.00 | 0.09 | 11.70 |
| 64 | Suryoday Bank Apps | 0.08 | 0.22 | 0.00 | 0.00 | 0.00 | 0.01 | 0.08 | 0.23 |
| 65 | IDBI Bank Apps | 0.08 | 30.01 | 0.00 | 0.00 | 0.00 | 0.00 | 0.08 | 30.01 |
| 66 | Ultracash # | 0.08 | 5.71 | 0.00 | 0.00 | 0.00 | 0.00 | 0.08 | 5.71 |
| 67 | NSDL Payments Bank Apps | 0.08 | 9.73 | 0.00 | 0.00 | 0.00 | 0.00 | 0.08 | 9.73 |
| 68 | City Union Bank Apps | 0.07 | 26.24 | 0.00 | 0.00 | 0.00 | 0.00 | 0.07 | 26.24 |
| 69 | Bharat Pe # | 0.07 | 8.29 | 0.00 | 0.00 | 0.00 | 0.00 | 0.07 | 8.29 |
| 70 | Tamilnad Mercantile Bank Apps | 0.07 | 23.33 | 0.00 | 0.00 | 0.00 | 0.00 | 0.07 | 23.33 |
| 71 | Salary Se # | 0.07 | 3.75 | 0.00 | 0.00 | 0.00 | 0.00 | 0.07 | 3.75 |
| 72 | Genwise # | 0.06 | 22.84 | 0.00 | 0.00 | 0.00 | 0.00 | 0.06 | 22.84 |
| 73 | Karur Vysya Bank Apps | 0.05 | 17.82 | 0.00 | 0.00 | 0.00 | 0.00 | 0.05 | 17.82 |
| 74 | Equitas Small Finance Bank Apps | 0.03 | 25.69 | 0.00 | 0.00 | 0.00 | 0.00 | 0.03 | 25.69 |
| 75 | Freo # | 0.03 | 1.80 | 0.00 | 0.00 | 0.00 | 0.00 | 0.03 | 1.80 |
| 76 | Cheq | 0.03 | 1.84 | 0.00 | 0.00 | 0.00 | 0.00 | 0.03 | 1.84 |
| 77 | Money View # | 0.02 | 2.77 | 0.00 | 0.00 | 0.00 | 0.00 | 0.02 | 2.77 |
| 78 | Punjab Sind Bank Apps | 0.02 | 10.76 | 0.00 | 0.00 | 0.00 | 0.00 | 0.02 | 10.76 |
| 79 | Spice Money | 0.02 | 2.73 | 0.00 | 0.00 | 0.00 | 0.00 | 0.02 | 2.73 |
| 80 | Kredit.Pe # | 0.02 | 2.67 | 0.00 | 0.00 | 0.00 | 0.00 | 0.02 | 2.67 |
| 81 | Others | 1.52 | 219.56 | 0.00 | 0.00 | 0.13 | 5.62 | 1.65 | 225.18 |
Note:-
| UPI P2P and P2M Transactions | ||||||
|---|---|---|---|---|---|---|
| Month | Total | P2P | P2M | |||
| Volume (Mn) | Value (Cr) | Volume (Mn) | Value (Cr) | Volume (Mn) | Value (Cr) | |
| Nov-24 | 15,482.02 | 21,55,187.40 | 5,833.16 | 15,56,010.77 | 9,648.87 | 5,99,176.63 |
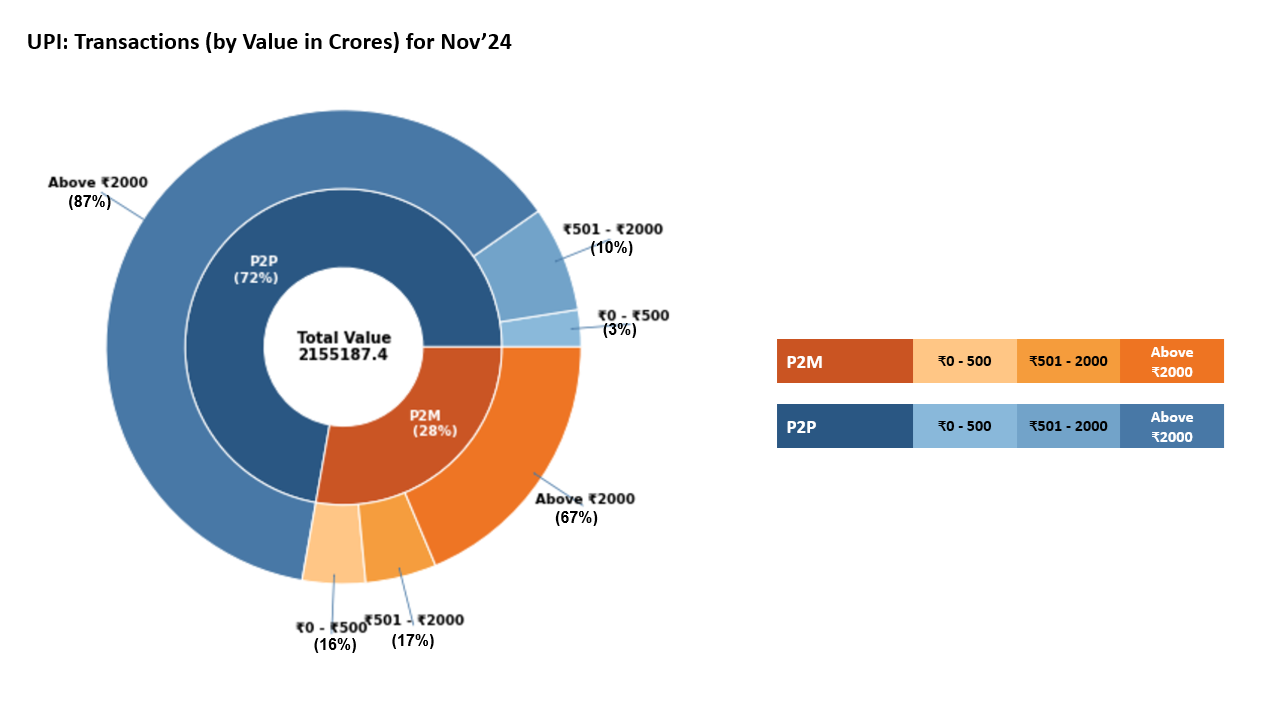
| UPI Payer PSP Performance (November'24) | |||||
|---|---|---|---|---|---|
| Sr. No. | Payer PSP | Total Volume (In Mn) | Approved % | BD % | TD % |
| 1 | Axis Bank Ltd. | 5,366.04 | 93.50% | 6.33% | 0.17% |
| 2 | Yes Bank Ltd. | 4,838.62 | 89.34% | 10.51% | 0.15% |
| 3 | ICICI Bank Ltd. | 2,839.45 | 92.32% | 7.54% | 0.14% |
| 4 | State Bank of India | 1,738.04 | 95.72% | 4.12% | 0.16% |
| 5 | HDFC Bank Ltd. | 1,699.60 | 94.50% | 5.40% | 0.10% |
| 6 | Tri O Tech Solutions Private Limited | 67.21 | 100.00% | 0.00% | 0.00% |
| 7 | Kotak Mahindra Bank | 47.66 | 100.00% | 0.00% | 0.00% |
| 8 | BHIM | 32.01 | 93.36% | 6.40% | 0.23% |
| 9 | Airtel Payments Bank Limited | 19.34 | 96.20% | 3.70% | 0.10% |
| 10 | RBL Bank Ltd. | 11.84 | 97.09% | 2.81% | 0.10% |
| 11 | IDFC Bank Ltd. | 9.25 | 99.60% | 0.39% | 0.00% |
| 12 | India Post Payments Bank Limited | 8.91 | 100.00% | 0.00% | 0.00% |
| 13 | One Mobikwik Systems Limited | 7.23 | 100.00% | 0.00% | 0.00% |
| 14 | Federal Bank Ltd. | 6.64 | 98.46% | 1.50% | 0.04% |
| 15 | Citibank Corporate | 6.19 | 100.00% | 0.00% | 0.00% |
| UPI Payee PSP Performance (November'24) | |||||
|---|---|---|---|---|---|
| Sr. No. | Payee PSP | Total Volume (In Mn) | Approved % | BD % | TD % |
| 1 | Yes Bank Ltd. | 8,805.07 | 90.47% | 9.38% | 0.15% |
| 2 | Axis Bank Ltd. | 3,020.55 | 94.77% | 5.08% | 0.15% |
| 3 | ICICI Bank Ltd. | 1,565.44 | 94.16% | 5.69% | 0.15% |
| 4 | HDFC Bank Ltd. | 941.31 | 94.55% | 5.31% | 0.13% |
| 5 | State Bank of India | 875.91 | 95.35% | 4.50% | 0.15% |
| 6 | Federal Bank Ltd. | 317.06 | 97.06% | 2.79% | 0.15% |
| 7 | Canara Bank | 141.79 | 95.23% | 4.61% | 0.16% |
| 8 | Airtel Payments Bank Limited | 107.19 | 95.05% | 4.81% | 0.13% |
| 9 | Indusind Bank Ltd. | 101.97 | 92.11% | 7.74% | 0.15% |
| 10 | RBL Bank Ltd. | 51.03 | 93.58% | 6.24% | 0.18% |
| 11 | Kotak Mahindra Bank | 46.50 | 93.47% | 6.38% | 0.15% |
| 12 | One Mobikwik Systems Limited | 45.61 | 96.65% | 3.22% | 0.12% |
| 13 | Fino Payments Bank Ltd. | 39.72 | 90.08% | 9.71% | 0.21% |
| 14 | Tri O Tech Solutions Private Limited | 32.41 | 93.92% | 5.89% | 0.19% |
| 15 | Indian Overseas Bank | 27.56 | 94.73% | 5.12% | 0.15% |
| UPI Merchant Category-wise Classification - November'24 (Arranged by Volume) | ||||
|---|---|---|---|---|
| Type | MCC | Description | Volume (in Mn) | Value (in Cr.) |
| High Transacting Categories | 5411 | Groceries and supermarkets | 2,184.81 | 51,777.65 |
| 5814 | Fast food restaurants | 1,014.92 | 12,425.19 | |
| 5812 | Eating places and restaurants | 911.05 | 15,303.29 | |
| 4814 | Telecommunication services, including local and long distance calls, credit card calls, calls through use of magnetic stripe reading telephones and faxes | 751.68 | 17,493.22 | |
| 5541 | Service stations (with or without ancillary services) | 489.90 | 29,856.68 | |
| 5816 | Digital Goods: Games | 279.25 | 8,883.18 | |
| 5912 | Drug stores and pharmacies | 237.27 | 9,269.28 | |
| 5993 | Cigar shops and stands | 227.59 | 1,417.14 | |
| 5462 | Bakeries | 209.03 | 3,135.49 | |
| 4900 | Utilities electric, gas, water and sanitary | 155.35 | 19,397.02 | |
| Medium Transacting Categories | 5451 | Dairies | 126.75 | 3,466.95 |
| 7322 | Debt collection agencies | 107.95 | 68,979.14 | |
| 5813 | Drinking places (alcoholic beverages) bars, taverns, night-clubs, cocktail lounges and discothques | 85.15 | 3,241.00 | |
| 5921 | Package shops beer, wine and liquor | 81.79 | 3,471.46 | |
| 5422 | Freezer and locker meat provisioners | 78.56 | 2,530.09 | |
| 5441 | Candy, nut and confectionery shops | 76.93 | 1,569.08 | |
| 5137 | Mens, womens and childrens uniforms and commercial clothing | 72.91 | 7,343.25 | |
| 5691 | Mens and womens clothing shops | 66.02 | 8,743.58 | |
| 4112 | Passenger railways | 64.80 | 3,343.03 | |
| 7622 | Electronics repair shops | 64.54 | 2,053.90 | |
| All Other Categories | 6211 | Securities brokers and dealers | 63.94 | 51,931.40 |
| 9399 | Government services not elsewhere classified | 62.60 | 6,623.67 | |
| 5732 | Electronics shops | 61.49 | 8,090.52 | |
| 7230 | Beauty and barber shops | 61.42 | 1,928.54 | |
| 5262 | Online Marketplaces | 56.12 | 4,372.54 | |
| 5311 | Department stores | 53.54 | 3,925.50 | |
| 4121 | Taxi-cabs and limousines | 53.43 | 1,159.77 | |
| 5331 | Variety stores | 52.55 | 3,138.28 | |
| 7011 | Lodging hotels, motels and resorts | 45.23 | 3,536.64 | |
| Others | 1,852.31 | 2,40,770.20 | ||
| Total | 9,648.87 | 5,99,176.63 | ||
| State-wise UPI Product Statistics* (Nov'24) | |||||
|---|---|---|---|---|---|
| Sr. No. | State / Union Territory | Volume (in Mn ) | Volume Contribution (%) | Value (in Cr.) | Value Contribution (%) |
| 1 | MAHARASHTRA | 1,967.07 | 12.71% | 2,43,220.45 | 11.29% |
| 2 | KARNATAKA | 1,204.97 | 7.78% | 1,63,394.20 | 7.58% |
| 3 | UTTAR PRADESH | 1,044.79 | 6.75% | 1,45,688.84 | 6.76% |
| 4 | TELANGANA | 938.62 | 6.06% | 1,45,611.57 | 6.76% |
| 5 | TAMIL NADU | 685.76 | 4.43% | 1,04,101.32 | 4.83% |
| 6 | RAJASTHAN | 621.05 | 4.01% | 95,807.51 | 4.45% |
| 7 | ANDHRA PRADESH | 588.66 | 3.80% | 1,00,931.78 | 4.68% |
| 8 | BIHAR | 535.28 | 3.46% | 78,776.84 | 3.66% |
| 9 | MADHYA PRADESH | 534.77 | 3.45% | 71,168.69 | 3.30% |
| 10 | WEST BENGAL | 460.40 | 2.97% | 71,880.33 | 3.34% |
| 11 | GUJARAT | 447.82 | 2.89% | 65,671.33 | 3.05% |
| 12 | DELHI | 441.99 | 2.85% | 55,291.59 | 2.57% |
| 13 | ODISHA | 354.18 | 2.29% | 44,116.28 | 2.05% |
| 14 | HARYANA | 346.02 | 2.23% | 51,552.80 | 2.39% |
| 15 | KERALA | 343.35 | 2.22% | 46,483.04 | 2.16% |
| 16 | ASSAM | 196.97 | 1.27% | 23,338.48 | 1.08% |
| 17 | PUNJAB | 184.09 | 1.19% | 32,257.61 | 1.50% |
| 18 | JHARKHAND | 182.02 | 1.18% | 24,110.49 | 1.12% |
| 19 | CHHATTISGARH | 139.98 | 0.90% | 17,873.50 | 0.83% |
| 20 | UTTARAKHAND | 112.61 | 0.73% | 14,691.68 | 0.68% |
| 21 | JAMMU AND KASHMIR | 70.00 | 0.45% | 10,163.69 | 0.47% |
| 22 | HIMACHAL PRADESH | 52.29 | 0.34% | 6,997.02 | 0.32% |
| 23 | GOA | 31.72 | 0.20% | 4,419.48 | 0.21% |
| 24 | CHANDIGARH | 25.13 | 0.16% | 3,289.62 | 0.15% |
| 25 | ARUNACHAL PRADESH | 16.09 | 0.10% | 2,166.79 | 0.10% |
| 26 | PUDUCHERRY | 15.08 | 0.10% | 2,069.73 | 0.10% |
| 27 | MEGHALAYA | 12.36 | 0.08% | 1,769.21 | 0.08% |
| 28 | TRIPURA | 11.72 | 0.08% | 1,727.38 | 0.08% |
| 29 | DADRA & NAGAR HAVELI & DAMAN & DIU | 10.38 | 0.07% | 1,053.99 | 0.05% |
| 30 | NAGALAND | 10.26 | 0.07% | 1,791.99 | 0.08% |
| 31 | MIZORAM | 9.03 | 0.06% | 1,574.35 | 0.07% |
| 32 | MANIPUR | 7.88 | 0.05% | 1,952.61 | 0.09% |
| 33 | SIKKIM | 6.36 | 0.04% | 908.47 | 0.04% |
| 34 | ANDAMAN & NICOBAR | 3.40 | 0.02% | 564.94 | 0.03% |
| 35 | LADAKH | 2.79 | 0.02% | 535.36 | 0.02% |
| 36 | LAKSHADWEEP | 0.45 | 0.00% | 51.53 | 0.00% |
| 37 | UNCLASSIFIED# | 3,866.68 | 24.98% | 5,18,182.93 | 24.04% |
| UPI Remitter Members - Top 50 Members (Oct'24) | |||||||
|---|---|---|---|---|---|---|---|
| Sr. No. | UPI Remitter Members (Oct-2024) | Total Volume (In Mn) | Approved % | BD % | TD% | Total Debit Reversal Count (In Mn) | Debit Reversal Success % |
| 1 | State Bank Of India | 4,478.41 | 92.10% | 6.29% | 1.61% | 17.29 | 97.03% |
| 2 | HDFC BANK LTD. | 1,409.32 | 94.74% | 5.24% | 0.02% | 4.26 | 99.84% |
| 3 | Bank of Baroda | 1,116.59 | 92.54% | 7.41% | 0.06% | 3.50 | 97.90% |
| 4 | Union Bank of India | 1,043.89 | 93.16% | 6.69% | 0.15% | 3.77 | 86.01% |
| 5 | Punjab National Bank | 955.82 | 90.92% | 8.90% | 0.18% | 3.29 | 96.59% |
| 6 | Kotak Mahindra Bank | 863.59 | 91.32% | 8.58% | 0.10% | 2.81 | 87.86% |
| 7 | Axis Bank Ltd. | 827.97 | 94.82% | 5.13% | 0.06% | 2.30 | 95.70% |
| 8 | Canara Bank | 795.21 | 92.55% | 7.16% | 0.29% | 3.31 | 89.26% |
| 9 | ICICI Bank Ltd. | 709.27 | 95.76% | 4.20% | 0.04% | 1.91 | 98.23% |
| 10 | Bank of India | 538.24 | 93.54% | 5.93% | 0.54% | 2.50 | 77.09% |
| 11 | Indian Bank | 513.28 | 93.41% | 6.42% | 0.18% | 1.87 | 87.20% |
| 12 | Airtel Payments Bank Limited | 500.76 | 89.46% | 10.35% | 0.19% | 2.20 | 97.31% |
| 13 | India Post Payments Bank Limited | 434.48 | 87.51% | 11.24% | 1.25% | 1.84 | 81.21% |
| 14 | Indian Overseas Bank | 244.05 | 91.68% | 6.13% | 2.19% | 1.74 | 87.54% |
| 15 | Central Bank Of India | 241.37 | 86.85% | 12.22% | 0.92% | 1.10 | 84.13% |
| 16 | Federal Bank Ltd. | 238.16 | 92.59% | 7.10% | 0.31% | 0.69 | 97.63% |
| 17 | UCO Bank | 220.30 | 92.16% | 7.68% | 0.16% | 0.85 | 90.84% |
| 18 | Bank of Maharashtra | 187.72 | 92.94% | 6.64% | 0.42% | 0.76 | 76.93% |
| 19 | IDBI Bank Ltd. | 186.35 | 93.67% | 6.15% | 0.18% | 0.71 | 92.38% |
| 20 | INDUSIND BANK Ltd. | 184.41 | 90.46% | 9.32% | 0.22% | 0.77 | 90.97% |
| 21 | Fino Payments Bank Ltd. | 173.06 | 92.76% | 7.17% | 0.07% | 0.79 | 94.78% |
| 22 | Yes Bank Ltd. | 165.55 | 85.65% | 14.14% | 0.21% | 0.54 | 69.34% |
| 23 | Karnataka Bank | 126.09 | 92.63% | 6.87% | 0.50% | 0.48 | 84.10% |
| 24 | IDFC Bank Ltd. | 99.72 | 92.41% | 7.14% | 0.44% | 0.71 | 42.29% |
| 25 | Karur Vysya Bank | 79.62 | 92.99% | 6.72% | 0.29% | 0.31 | 93.92% |
| 26 | The Jammu & Kashmir Bank Limited | 78.02 | 89.55% | 5.02% | 5.43% | 1.82 | 13.78% |
| 27 | AU small Finance Bank | 76.76 | 90.05% | 9.88% | 0.07% | 0.29 | 94.71% |
| 28 | Bandhan Bank Limited | 74.83 | 93.87% | 5.29% | 0.84% | 0.34 | 94.37% |
| 29 | Tri O Tech Solutions Private Limited | 69.79 | 100.00% | 0.00% | 0.00% | #N/A | #N/A |
| 30 | The South Indian Bank Limited | 64.32 | 94.61% | 5.25% | 0.14% | 0.18 | 98.72% |
| 31 | Ujjivan Small Finance Bank Limited | 48.67 | 94.65% | 4.98% | 0.37% | 0.19 | 86.84% |
| 32 | Punjab and Sind Bank | 47.91 | 91.97% | 7.83% | 0.20% | 0.22 | 92.65% |
| 33 | City Union Bank | 47.69 | 93.04% | 6.83% | 0.14% | 0.13 | 99.75% |
| 34 | Tamilnad Mercantile Bank Limited | 44.76 | 92.22% | 7.41% | 0.38% | 0.16 | 77.33% |
| 35 | Kerala Gramin Bank | 38.22 | 92.47% | 6.68% | 0.85% | 0.23 | 86.93% |
| 36 | Equitas Small Finance Bank | 34.50 | 92.52% | 7.45% | 0.03% | 0.12 | 97.83% |
| 37 | Andhra Pradesh Grameena Vikas Bank | 32.92 | 85.99% | 12.62% | 1.39% | 0.04 | 0.00% |
| 38 | Baroda UP Gramin Bank | 31.14 | 92.41% | 6.10% | 1.48% | 0.00 | 0.00% |
| 39 | Karnataka Gramin Bank | 30.87 | 89.60% | 8.27% | 2.13% | 0.36 | 79.23% |
| 40 | DBS Bank India Limited | 30.17 | 92.60% | 7.25% | 0.15% | 0.11 | 87.46% |
| 41 | Maharashtra Gramin Bank | 29.85 | 85.61% | 12.12% | 2.27% | 0.18 | 53.89% |
| 42 | Rajasthan Marudhara Gramin Bank | 29.28 | 84.14% | 10.95% | 4.91% | 0.37 | 26.64% |
| 43 | Saraswat Co-operative Bank | 28.50 | 94.07% | 5.72% | 0.21% | 0.10 | 88.12% |
| 44 | Jio Payments Bank Ltd | 28.23 | 88.59% | 10.18% | 1.23% | 0.26 | 99.35% |
| 45 | Standard Chartered Bank | 27.97 | 95.45% | 3.31% | 1.24% | 0.17 | 53.65% |
| 46 | ESAF Small Finance Bank Ltd | 27.91 | 95.35% | 4.55% | 0.10% | 0.10 | 96.78% |
| 47 | NSDL Payments Bank Limited | 24.07 | 84.64% | 11.55% | 3.81% | 0.37 | 3.94% |
| 48 | RBL Bank Ltd. | 23.06 | 92.36% | 7.33% | 0.31% | 0.10 | 76.65% |
| 49 | Andhra Pragathi Grameena Bank | 21.92 | 78.27% | 10.39% | 11.34% | 0.64 | 36.42% |
| 50 | Sarva Haryana Gramin Bank | 21.22 | 93.23% | 6.41% | 0.36% | 0.09 | 87.26% |
| UPI Beneficiary Members - Top 50 Members (Oct'24) | |||||||
|---|---|---|---|---|---|---|---|
| Sr.No. | UPI Beneficiary Members (Oct-2024) | Total Volume (In Mn) | Approved % | BD% | TD% | Deemed Approved % | |
| 1 | Yes Bank Ltd | 6,665.20 | 99.99% | 0.01% | 0.00% | 0.00% | |
| 2 | State Bank Of India | 1,667.62 | 99.11% | 0.12% | 0.77% | 0.37% | |
| 3 | Axis Bank Ltd. | 1,647.89 | 99.86% | 0.06% | 0.07% | 0.01% | |
| 4 | HDFC BANK LTD | 814.86 | 98.94% | 1.04% | 0.02% | 0.01% | |
| 5 | ICICI Bank | 637.79 | 99.48% | 0.49% | 0.03% | 0.02% | |
| 6 | Bank of Baroda | 472.15 | 99.90% | 0.06% | 0.03% | 0.06% | |
| 7 | Canara Bank | 449.55 | 99.26% | 0.56% | 0.18% | 0.13% | |
| 8 | Union Bank of India | 420.82 | 99.81% | 0.10% | 0.09% | 0.05% | |
| 9 | Federal Bank | 418.03 | 99.75% | 0.20% | 0.04% | 0.00% | |
| 10 | Punjab National Bank | 386.00 | 99.68% | 0.28% | 0.05% | 0.14% | |
| 11 | Airtel Payments Bank | 328.27 | 99.64% | 0.29% | 0.07% | 0.07% | |
| 12 | Kotak Mahindra Bank | 322.09 | 98.62% | 1.35% | 0.03% | 0.04% | |
| 13 | Bank of India | 235.92 | 98.61% | 0.85% | 0.54% | 0.16% | |
| 14 | Indian Bank | 234.79 | 99.05% | 0.80% | 0.15% | 0.04% | |
| 15 | India Post Payment Bank | 191.03 | 99.46% | 0.25% | 0.29% | 0.05% | |
| 16 | Indusind Bank Ltd. | 175.04 | 99.21% | 0.64% | 0.15% | 0.04% | |
| 17 | Indian Overseas Bank | 122.14 | 98.17% | 0.47% | 1.36% | 0.77% | |
| 18 | Central Bank Of India | 116.32 | 98.07% | 1.42% | 0.51% | 0.28% | |
| 19 | Fino Payments Bank Limited FIP | 102.43 | 96.33% | 3.56% | 0.11% | 0.03% | |
| 20 | UCO Bank | 99.30 | 99.41% | 0.47% | 0.12% | 0.02% | |
| 21 | Bank of Maharashtra | 81.90 | 99.18% | 0.25% | 0.57% | 0.18% | |
| 22 | IDBI Bank Limited | 79.09 | 99.62% | 0.27% | 0.11% | 0.05% | |
| 23 | RBL Bank Limited | 59.70 | 99.59% | 0.27% | 0.14% | 0.11% | |
| 24 | Karnataka Bank | 58.52 | 98.87% | 0.62% | 0.51% | 0.05% | |
| 25 | One Mobikwik Systems Pvt - Ltd | 51.06 | 99.96% | 0.03% | 0.02% | 0.00% | |
| 26 | Bandhan Bank | 43.86 | 98.76% | 0.23% | 1.01% | 0.06% | |
| 27 | IDFC First Bank Ltd | 43.61 | 98.88% | 1.09% | 0.03% | 0.01% | |
| 28 | Jammu and Kashmir Bank | 41.43 | 98.42% | 0.17% | 1.41% | 1.19% | |
| 29 | South Indian Bank | 40.76 | 99.32% | 0.63% | 0.05% | 0.01% | |
| 30 | Karur Vysya Bank | 39.62 | 98.98% | 0.81% | 0.21% | 0.04% | |
| 31 | AU small Finance Bank | 38.49 | 99.24% | 0.70% | 0.06% | 0.03% | |
| 32 | Tri O Tech Solutions Private Limited | 33.06 | 95.65% | 4.35% | 0.00% | 0.00% | |
| 33 | Tamilnad Mercantile Bank | 30.48 | 99.62% | 0.08% | 0.29% | 0.05% | |
| 34 | City Union Bank | 26.07 | 98.95% | 0.92% | 0.12% | 0.00% | |
| 35 | Ujjivan Small Finance Bank | 25.03 | 99.52% | 0.21% | 0.27% | 0.17% | |
| 36 | Punjab and Sind Bank | 22.43 | 99.12% | 0.71% | 0.18% | 0.03% | |
| 37 | Jio Payments Bank | 20.89 | 99.23% | 0.42% | 0.34% | 0.17% | |
| 38 | Kerala Gramin Bank | 20.67 | 98.60% | 0.93% | 0.47% | 0.31% | |
| 39 | CITI Bank | 18.98 | 99.39% | 0.55% | 0.05% | 0.02% | |
| 40 | Baroda UP Gramin Bank | 15.99 | 98.78% | 0.26% | 0.96% | 0.34% | |
| 41 | Andhra Pradesh Grameena Vikas Bank | 15.15 | 98.99% | 0.57% | 0.44% | 0.13% | |
| 42 | Pragathi Krishna Gramin Bank | 14.38 | 97.87% | 1.05% | 1.08% | 0.76% | |
| 43 | Equitas Bank | 14.34 | 98.67% | 1.18% | 0.15% | 0.01% | |
| 44 | Maharashtra Gramin Bank | 13.65 | 98.11% | 0.16% | 1.74% | 0.50% | |
| 45 | ESAF Small Finance Bank Ltd. | 13.14 | 99.06% | 0.83% | 0.11% | 0.02% | |
| 46 | NSDL Payments Bank | 12.62 | 97.33% | 1.05% | 1.62% | 0.64% | |
| 47 | Rajasthan Marudhara Gramin Bank | 12.62 | 96.18% | 0.48% | 3.34% | 0.57% | |
| 48 | DBS Bank India Limited | 11.70 | 98.41% | 1.32% | 0.27% | 0.05% | |
| 49 | Andhra Pragathi Grameena Bank | 10.42 | 92.29% | 0.83% | 6.88% | 0.08% | |
| 50 | Sarva Haryana Gramin Bank | 9.23 | 99.32% | 0.34% | 0.34% | 0.04% | |
| UPI Apps (Oct'24) | |||||||||
|---|---|---|---|---|---|---|---|---|---|
| Sr.No. | Application Name | Customer Initiated Transactions | B2C Transactions | B2B Transactions | Total | ||||
| Volume (Mn) | Value (Cr) | Volume (Mn) | Value (Cr) | Volume (Mn) | Value (Cr) | Volume (Mn) | Value (Cr) | ||
| 1 | PhonePe # | 7,905.54 | 11,69,290.03 | 0.00 | 0.00 | 0.00 | 0.00 | 7,905.54 | 11,69,290.03 |
| 2 | Google Pay # | 6,201.81 | 8,49,327.38 | 0.00 | 0.00 | 0.00 | 0.00 | 6,201.81 | 8,49,327.38 |
| 3 | Paytm (OCL) # | 1,165.01 | 1,29,584.98 | 0.00 | 0.00 | 0.00 | 0.00 | 1,165.01 | 1,29,584.98 |
| 4 | Navi # | 157.51 | 8,841.90 | 0.00 | 0.00 | 0.00 | 0.00 | 157.51 | 8,841.90 |
| 5 | Cred # | 152.28 | 55,202.12 | 0.00 | 0.00 | 0.00 | 0.00 | 152.28 | 55,202.12 |
| 6 | Axis Bank Apps | 21.97 | 4,527.19 | 117.70 | 2,300.48 | 0.01 | 1.86 | 139.68 | 6,829.53 |
| 7 | Amazon Pay # | 79.55 | 9,205.72 | 0.00 | 0.00 | 0.00 | 0.00 | 79.55 | 9,205.72 |
| 8 | FamApp by Trio # | 69.90 | 825.19 | 0.00 | 0.00 | 0.00 | 0.00 | 69.90 | 825.19 |
| 9 | ICICI Bank Apps | 54.77 | 20,505.95 | 0.01 | 10.00 | 2.76 | 3,171.01 | 57.54 | 23,686.95 |
| 10 | Whatsapp # | 55.07 | 4,137.17 | 0.00 | 0.00 | 0.00 | 0.00 | 55.07 | 4,137.17 |
| 11 | Kotak Mahindra Bank Apps | 51.92 | 7,565.22 | 0.00 | 0.00 | 0.00 | 0.00 | 51.92 | 7,565.22 |
| 12 | super.money # | 49.68 | 2,167.86 | 0.00 | 0.00 | 0.00 | 0.00 | 49.68 | 2,167.86 |
| 13 | HDFC Bank Apps | 39.13 | 10,426.92 | 0.27 | 0.39 | 0.01 | 0.67 | 39.41 | 10,427.97 |
| 14 | Yes Bank Apps | 36.37 | 10,230.68 | 0.00 | 0.01 | 0.42 | 14.79 | 36.79 | 10,245.47 |
| 15 | BHIM # | 29.90 | 10,170.60 | 0.00 | 0.00 | 0.00 | 0.00 | 29.90 | 10,170.60 |
| 16 | Airtel Payments Bank Apps | 20.03 | 1,504.27 | 0.00 | 0.00 | 0.00 | 0.08 | 20.03 | 1,504.36 |
| 17 | Mobikwik # | 17.20 | 2,995.42 | 0.00 | 0.00 | 0.00 | 0.00 | 17.20 | 2,995.42 |
| 18 | Groww # | 15.35 | 11,862.09 | 0.00 | 0.00 | 0.00 | 0.00 | 15.35 | 11,862.09 |
| 19 | Flipkart UPI # | 14.62 | 825.95 | 0.00 | 0.00 | 0.00 | 0.00 | 14.62 | 825.95 |
| 20 | Slice # | 12.19 | 907.37 | 0.00 | 0.00 | 0.00 | 0.00 | 12.19 | 907.37 |
| 21 | State Bank of India Apps | 11.73 | 3,527.88 | 0.00 | 0.00 | 0.00 | 0.00 | 11.73 | 3,527.88 |
| 22 | Bajaj Finserv # | 10.66 | 2,330.26 | 0.00 | 0.00 | 0.00 | 0.00 | 10.66 | 2,330.26 |
| 23 | India Post Payments Bank Apps | 10.11 | 1,507.56 | 0.00 | 0.00 | 0.00 | 0.00 | 10.11 | 1,507.56 |
| 24 | IDFC Bank Apps | 9.32 | 2,162.46 | 0.00 | 0.00 | 0.00 | 0.39 | 9.33 | 2,162.85 |
| 25 | Samsung Pay # | 8.56 | 664.70 | 0.00 | 0.00 | 0.00 | 0.00 | 8.56 | 664.70 |
| 26 | Jupiter Money # | 6.36 | 873.89 | 0.00 | 0.00 | 0.00 | 0.00 | 6.36 | 873.89 |
| 27 | Fi Money # | 3.44 | 421.40 | 0.00 | 0.00 | 0.00 | 0.00 | 3.44 | 421.40 |
| 28 | Punjab National Bank Apps | 3.31 | 785.24 | 0.00 | 0.00 | 0.00 | 0.00 | 3.31 | 785.24 |
| 29 | Canara Bank Apps | 3.27 | 898.89 | 0.00 | 0.00 | 0.00 | 0.00 | 3.27 | 898.89 |
| 30 | Jio Payments Bank Apps | 3.23 | 269.69 | 0.00 | 0.00 | 0.00 | 0.00 | 3.23 | 269.69 |
| 31 | Indian Bank Apps | 3.11 | 513.43 | 0.00 | 0.00 | 0.00 | 0.00 | 3.11 | 513.43 |
| 32 | Federal Bank Apps | 2.96 | 542.57 | 0.00 | 0.00 | 0.00 | 0.00 | 2.96 | 542.57 |
| 33 | Pop Club # | 2.93 | 209.84 | 0.00 | 0.00 | 0.00 | 0.00 | 2.93 | 209.84 |
| 34 | RBL Bank Apps | 2.85 | 718.17 | 0.00 | 0.01 | 0.03 | 4.97 | 2.88 | 723.15 |
| 35 | Deutsche Bank Apps | 2.58 | 395.26 | 0.00 | 0.00 | 0.00 | 0.06 | 2.58 | 395.32 |
| 36 | Timepay # | 2.15 | 18.60 | 0.00 | 0.00 | 0.00 | 0.00 | 2.15 | 18.60 |
| 37 | Omni Card | 1.49 | 96.52 | 0.00 | 0.00 | 0.00 | 0.00 | 1.49 | 96.52 |
| 38 | Bank of Baroda Apps | 1.16 | 499.63 | 0.00 | 0.00 | 0.00 | 0.00 | 1.16 | 499.63 |
| 39 | Central Bank of India Apps | 1.11 | 219.02 | 0.00 | 0.00 | 0.00 | 0.00 | 1.11 | 219.02 |
| 40 | Aditya Birla Capital Digital | 0.97 | 37.97 | 0.00 | 0.00 | 0.00 | 0.00 | 0.97 | 37.97 |
| 41 | Jammu and Kashmir Bank Apps | 0.83 | 144.00 | 0.00 | 0.00 | 0.00 | 0.00 | 0.83 | 144.00 |
| 42 | Union Bank Apps | 0.80 | 282.02 | 0.00 | 0.00 | 0.00 | 0.00 | 0.80 | 282.02 |
| 43 | HSBC Bank Apps | 0.68 | 179.22 | 0.00 | 0.12 | 0.00 | 0.01 | 0.68 | 179.35 |
| 44 | South Indian Bank Apps | 0.61 | 179.80 | 0.00 | 0.00 | 0.00 | 0.00 | 0.61 | 179.80 |
| 45 | DBS Digibank Apps | 0.61 | 213.96 | 0.00 | 0.00 | 0.00 | 0.86 | 0.61 | 214.82 |
| 46 | Fino Payments Bank Apps | 0.58 | 70.11 | 0.00 | 0.00 | 0.00 | 0.00 | 0.58 | 70.11 |
| 47 | AU Small Finance Bank Apps | 0.49 | 146.98 | 0.00 | 0.00 | 0.00 | 0.00 | 0.49 | 146.98 |
| 48 | Shri Ram One # | 0.47 | 47.25 | 0.00 | 0.00 | 0.00 | 0.00 | 0.47 | 47.25 |
| 49 | Digikhata | 0.46 | 166.18 | 0.00 | 0.00 | 0.00 | 0.00 | 0.46 | 166.18 |
| 50 | Kiwi # | 0.41 | 66.74 | 0.00 | 0.00 | 0.00 | 0.00 | 0.41 | 66.74 |
| 51 | IndusInd Bank Apps | 0.36 | 91.48 | 0.00 | 0.00 | 0.01 | 1.81 | 0.36 | 93.29 |
| 52 | UCO Bank Apps | 0.31 | 77.02 | 0.00 | 0.00 | 0.00 | 0.00 | 0.31 | 77.02 |
| 53 | Tata Neu # | 0.31 | 74.80 | 0.00 | 0.00 | 0.00 | 0.00 | 0.31 | 74.80 |
| 54 | One Card # | 0.29 | 261.08 | 0.00 | 0.00 | 0.00 | 0.00 | 0.29 | 261.08 |
| 55 | Suryoday Bank Apps | 0.26 | 0.05 | 0.00 | 0.00 | 0.00 | 0.00 | 0.26 | 0.05 |
| 56 | Bank of India Apps | 0.20 | 45.85 | 0.00 | 0.00 | 0.00 | 0.00 | 0.20 | 45.85 |
| 57 | Indian Overseas Bank Apps | 0.20 | 56.07 | 0.00 | 0.00 | 0.00 | 0.00 | 0.20 | 56.07 |
| 58 | Standard Chartered Bank Apps | 0.20 | 131.76 | 0.00 | 0.00 | 0.00 | 0.07 | 0.20 | 131.83 |
| 59 | Karnataka Bank Apps | 0.16 | 34.88 | 0.00 | 0.00 | 0.00 | 0.00 | 0.16 | 34.88 |
| 60 | Dhani | 0.13 | 14.62 | 0.00 | 0.00 | 0.00 | 0.00 | 0.13 | 14.62 |
| 61 | True Balance | 0.13 | 16.51 | 0.00 | 0.00 | 0.00 | 0.00 | 0.13 | 16.51 |
| 62 | Niyo Global # | 0.10 | 55.57 | 0.00 | 0.00 | 0.00 | 0.00 | 0.10 | 55.57 |
| 63 | NSDL Payments Bank Apps | 0.09 | 12.10 | 0.00 | 0.00 | 0.00 | 0.00 | 0.09 | 12.10 |
| 64 | Ultracash # | 0.09 | 5.94 | 0.00 | 0.00 | 0.00 | 0.00 | 0.09 | 5.94 |
| 65 | Rapipay | 0.08 | 11.38 | 0.00 | 0.00 | 0.00 | 0.00 | 0.08 | 11.38 |
| 66 | City Union Bank Apps | 0.08 | 29.97 | 0.00 | 0.00 | 0.00 | 0.00 | 0.08 | 29.97 |
| 67 | IDBI Bank Apps | 0.08 | 29.72 | 0.00 | 0.00 | 0.00 | 0.00 | 0.08 | 29.72 |
| 68 | Tamilnad Mercantile Bank Apps | 0.07 | 24.55 | 0.00 | 0.00 | 0.00 | 0.00 | 0.07 | 24.55 |
| 69 | Salary Se # | 0.07 | 3.95 | 0.00 | 0.00 | 0.00 | 0.00 | 0.07 | 3.95 |
| 70 | ESAF Small Finance Bank Apps | 0.06 | 8.57 | 0.00 | 0.00 | 0.00 | 0.00 | 0.06 | 8.57 |
| 71 | Bharat Pe # | 0.05 | 7.27 | 0.00 | 0.00 | 0.00 | 0.00 | 0.05 | 7.27 |
| 72 | Freo # | 0.05 | 2.70 | 0.00 | 0.00 | 0.00 | 0.00 | 0.05 | 2.70 |
| 73 | Karur Vysya Bank Apps | 0.05 | 18.40 | 0.00 | 0.00 | 0.00 | 0.00 | 0.05 | 18.40 |
| 74 | Equitas Small Finance Bank Apps | 0.04 | 29.70 | 0.00 | 0.00 | 0.00 | 0.00 | 0.04 | 29.70 |
| 75 | Punjab Sind Bank Apps | 0.03 | 16.46 | 0.00 | 0.00 | 0.00 | 0.00 | 0.03 | 16.46 |
| 76 | Cheq | 0.02 | 1.62 | 0.00 | 0.00 | 0.00 | 0.00 | 0.02 | 1.62 |
| 77 | Others | 1.63 | 219.31 | 0.00 | 0.00 | 0.13 | 5.53 | 1.76 | 224.84 |
Note:-
| UPI P2P and P2M Transactions | ||||||
|---|---|---|---|---|---|---|
| Month | Total | P2P | P2M | |||
| Volume (Mn) | Value (Cr) | Volume (Mn) | Value (Cr) | Volume (Mn) | Value (Cr) | |
| Oct-24 | 16,584.97 | 23,49,821.45 | 6,281.79 | 16,81,872.99 | 10,303.18 | 6,67,948.46 |
| UPI Payer PSP Performance (October'24) | |||||
|---|---|---|---|---|---|
| Sr. No. | Payer PSP | Total Volume (In Mn) | Approved % | BD % | TD % |
| 1 | Axis Bank Ltd. | 5,662.22 | 93.4% | 6.11% | 0.49% |
| 2 | Yes Bank Ltd. | 5,326.82 | 90.02% | 9.61% | 0.37% |
| 3 | ICICI Bank Ltd. | 3,063.68 | 92.73% | 6.96% | 0.31% |
| 4 | State Bank of India | 1,831.81 | 95.11% | 4.37% | 0.52% |
| 5 | HDFC Bank Ltd. | 1,746.61 | 94.68% | 5.16% | 0.16% |
| 6 | Tri O Tech Solutions Private Limited | 69.79 | 100.0% | 0.0% | 0.0% |
| 7 | Kotak Mahindra Bank | 52.23 | 100.0% | 0.0% | 0.0% |
| 8 | BHIM | 35.84 | 92.86% | 6.49% | 0.64% |
| 9 | Airtel Payments Bank Limited | 20.89 | 95.87% | 3.91% | 0.22% |
| 10 | RBL Bank Ltd. | 11.15 | 96.09% | 3.6% | 0.31% |
| 11 | INDIA POST PAYMENTS BANK LIMITED | 10.11 | 100.0% | 0.0% | 0.0% |
| 12 | IDFC Bank Ltd. | 9.99 | 99.54% | 0.44% | 0.01% |
| 13 | ONE MOBIKWIK SYSTEMS LIMITED | 7.19 | 100.0% | 0.0% | 0.0% |
| 14 | Federal Bank Ltd. | 6.6 | 98.23% | 1.66% | 0.11% |
| 15 | Garagepreneurs Internet Private Limited | 5.44 | 100.0% | 0.0% | 0.0% |
| UPI Payee PSP Performance (October'24) | |||||
|---|---|---|---|---|---|
| Sr. No. | Payee PSP | Total Volume (In Mn) | Approved % | BD % | TD % |
| 1 | Yes Bank Ltd. | 9,391.07 | 91.19% | 8.43% | 0.38% |
| 2 | Axis Bank Ltd. | 3,213.02 | 94.25% | 5.35% | 0.4% |
| 3 | ICICI Bank Ltd. | 1,700.90 | 93.61% | 5.96% | 0.43% |
| 4 | HDFC Bank Ltd. | 1035.39 | 94.2% | 5.36% | 0.44% |
| 5 | State Bank of India | 925.37 | 94.71% | 4.91% | 0.38% |
| 6 | Federal Bank Ltd. | 346.74 | 96.62% | 2.97% | 0.41% |
| 7 | Canara Bank | 148.39 | 94.73% | 4.95% | 0.32% |
| 8 | Indusind Bank Ltd. | 121.17 | 92.29% | 7.3% | 0.4% |
| 9 | Airtel Payments Bank Limited | 98.84 | 94.46% | 5.22% | 0.32% |
| 10 | RBL Bank Ltd. | 59.17 | 92.97% | 6.62% | 0.41% |
| 11 | ONE MOBIKWIK SYSTEMS LIMITED | 53.01 | 96.27% | 3.43% | 0.3% |
| 12 | Fino Payments Bank Ltd. | 45.72 | 89.71% | 9.95% | 0.35% |
| 13 | Kotak Mahindra Bank | 44.89 | 95.09% | 4.57% | 0.34% |
| 14 | Bank of Baroda | 39.53 | 94.62% | 5.04% | 0.35% |
| 15 | Tri O Tech Solutions Private Limited | 33.82 | 93.2% | 6.36% | 0.44% |
| UPI Merchant Category-wise Classification - October'24 (Arranged by Volume) | ||||
|---|---|---|---|---|
| Type | MCC | Description | Volume (in Mn) | Value (in Cr.) |
| High Transacting Categories | 5411 | Groceries and supermarkets | 2,366.12 | 58,098.95 |
| 5814 | Fast food restaurants | 1,075.16 | 13,450.52 | |
| 5812 | Eating places and restaurants | 968.95 | 16,392.86 | |
| 4814 | Telecommunication services, including local and long distance calls, credit card calls, calls through use of magnetic stripe reading telephones and faxes | 774.98 | 17,955.40 | |
| 5541 | Service stations (with or without ancillary services) | 509.39 | 29,699.46 | |
| 5816 | Digital Goods: Games | 289.82 | 9,768.65 | |
| 5912 | Drug stores and pharmacies | 244.70 | 9,422.72 | |
| 5993 | Cigar shops and stands | 244.04 | 1,546.57 | |
| 5462 | Bakeries | 221.89 | 3,508.90 | |
| 4900 | Utilities electric, gas, water and sanitary | 172.12 | 20,277.45 | |
| Medium Transacting Categories | 5451 | Dairies | 145.96 | 3,766.47 |
| 7322 | Debt collection agencies | 112.55 | 73,783.87 | |
| 5441 | Candy, nut and confectionery shops | 91.99 | 1,942.28 | |
| 5813 | Drinking places (alcoholic beverages) bars, taverns, night-clubs, cocktail lounges and discothques | 88.83 | 3,390.21 | |
| 5137 | Mens, womens and childrens uniforms and commercial clothing | 82.89 | 8,489.14 | |
| 5921 | Package shops beer, wine and liquor | 79.52 | 3,420.09 | |
| 5262 | Online Marketplaces | 78.15 | 6,563.69 | |
| 6211 | Securities brokers and dealers | 76.88 | 79,010.69 | |
| 5422 | Freezer and locker meat provisioners | 75.84 | 2,517.10 | |
| 7622 | Electronics repair shops | 71.59 | 2,308.65 | |
| All Other Categories | 5732 | Electronics shops | 71.42 | 9,720.10 |
| 9399 | Government services not elsewhere classified | 70.72 | 6,799.26 | |
| 5691 | Mens and womens clothing shops | 70.56 | 9,410.68 | |
| 7230 | Beauty and barber shops | 68.95 | 2,114.97 | |
| 4112 | Passenger railways | 64.45 | 3,329.04 | |
| 5311 | Department stores | 57.40 | 4,272.42 | |
| 5331 | Variety stores | 56.50 | 3,221.42 | |
| 4121 | Taxi-cabs and limousines | 54.29 | 1,173.04 | |
| 5651 | Family clothing shops | 49.29 | 4,809.43 | |
| Others | 1,968.22 | 2,57,783.69 | ||
| Total | 10,303.18 | 6,67,947.73 | ||
| State-wise UPI Product Statistics* (Oct'24) | |||||
|---|---|---|---|---|---|
| Sr. No. | State / Union Territory | Volume (in Mn ) | Volume Contribution (%) | Value (in Cr.) | Value Contribution (%) |
| 1 | MAHARASHTRA | 2,179.81 | 13.14% | 2,81,102.94 | 11.96% |
| 2 | KARNATAKA | 1,233.20 | 7.44% | 1,70,913.06 | 7.27% |
| 3 | UTTAR PRADESH | 1,054.58 | 6.36% | 1,43,596.48 | 6.11% |
| 4 | TELANGANA | 958.36 | 5.78% | 1,48,396.28 | 6.32% |
| 5 | TAMIL NADU | 716.36 | 4.32% | 1,12,218.72 | 4.78% |
| 6 | RAJASTHAN | 670.95 | 4.05% | 1,01,450.43 | 4.32% |
| 7 | ANDHRA PRADESH | 590.87 | 3.56% | 1,04,286.56 | 4.44% |
| 8 | MADHYA PRADESH | 571.11 | 3.44% | 76,062.12 | 3.24% |
| 9 | BIHAR | 526.07 | 3.17% | 75,323.70 | 3.21% |
| 10 | GUJARAT | 523.09 | 3.15% | 84,525.81 | 3.60% |
| 11 | WEST BENGAL | 478.37 | 2.88% | 74,530.28 | 3.17% |
| 12 | DELHI | 464.76 | 2.80% | 56,868.80 | 2.42% |
| 13 | HARYANA | 371.79 | 2.24% | 53,130.40 | 2.26% |
| 14 | ODISHA | 356.17 | 2.15% | 45,861.83 | 1.95% |
| 15 | KERALA | 345.60 | 2.08% | 46,868.53 | 1.99% |
| 16 | ASSAM | 194.50 | 1.17% | 23,299.91 | 0.99% |
| 17 | PUNJAB | 191.35 | 1.15% | 31,784.38 | 1.35% |
| 18 | JHARKHAND | 188.38 | 1.14% | 25,349.09 | 1.08% |
| 19 | CHHATTISGARH | 157.99 | 0.95% | 21,085.47 | 0.90% |
| 20 | UTTARAKHAND | 118.69 | 0.72% | 15,437.66 | 0.66% |
| 21 | JAMMU AND KASHMIR | 71.73 | 0.43% | 10,953.00 | 0.47% |
| 22 | HIMACHAL PRADESH | 56.14 | 0.34% | 7,815.12 | 0.33% |
| 23 | GOA | 31.08 | 0.19% | 4,357.60 | 0.19% |
| 24 | CHANDIGARH | 27.82 | 0.17% | 3,597.79 | 0.15% |
| 25 | PUDUCHERRY | 16.19 | 0.10% | 2,271.73 | 0.10% |
| 26 | ARUNACHAL PRADESH | 15.67 | 0.09% | 2,136.93 | 0.09% |
| 27 | TRIPURA | 11.68 | 0.07% | 1,721.97 | 0.07% |
| 28 | DADRA & NAGAR HAVELI & DAMAN & DIU | 11.26 | 0.07% | 1,182.64 | 0.05% |
| 29 | MEGHALAYA | 11.17 | 0.07% | 1,637.22 | 0.07% |
| 30 | MANIPUR | 10.71 | 0.06% | 2,472.36 | 0.11% |
| 31 | NAGALAND | 10.07 | 0.06% | 1,737.54 | 0.07% |
| 32 | MIZORAM | 8.29 | 0.05% | 1,434.50 | 0.06% |
| 33 | SIKKIM | 6.64 | 0.04% | 1,025.11 | 0.04% |
| 34 | ANDAMAN & NICOBAR | 3.36 | 0.02% | 567.76 | 0.02% |
| 35 | LADAKH | 3.21 | 0.02% | 680.84 | 0.03% |
| 36 | LAKSHADWEEP | 0.42 | 0.00% | 48.19 | 0.00% |
| 37 | UNCLASSIFIED# | 4,397.54 | 26.52% | 6,14,088.74 | 26.13% |
| UPI Remitter Members - Top 50 Members (Sep'24) | |||||||
|---|---|---|---|---|---|---|---|
| Sr. No. | UPI Remitter Members (Sep-2024) | Total Volume (In Mn) | Approved % | BD % | TD% | Total Debit Reversal Count (In Mn) | Debit Reversal Success % |
| 1 | State Bank Of India | 4,067.05 | 93.90% | 5.35% | 0.75% | 15.24 | 95.22% |
| 2 | HDFC BANK LTD | 1,267.31 | 95.36% | 4.62% | 0.02% | 3.28 | 99.66% |
| 3 | Bank of Baroda | 996.46 | 92.87% | 7.01% | 0.11% | 2.75 | 98.59% |
| 4 | Union Bank of India | 928.30 | 93.16% | 6.36% | 0.47% | 4.67 | 53.00% |
| 5 | Punjab National Bank | 851.00 | 92.20% | 7.69% | 0.11% | 2.70 | 95.21% |
| 6 | Kotak Mahindra Bank | 771.17 | 91.78% | 7.55% | 0.68% | 2.13 | 86.79% |
| 7 | Axis Bank Ltd. | 739.08 | 95.40% | 4.54% | 0.05% | 1.70 | 99.18% |
| 8 | Canara Bank | 724.35 | 93.23% | 6.32% | 0.44% | 2.50 | 91.72% |
| 9 | ICICI Bank Ltd. | 642.30 | 96.31% | 3.67% | 0.02% | 1.43 | 97.81% |
| 10 | Bank of India | 480.33 | 93.98% | 5.57% | 0.45% | 2.04 | 72.57% |
| 11 | Indian Bank | 466.01 | 94.03% | 5.87% | 0.11% | 1.44 | 89.97% |
| 12 | Airtel Payments Bank Ltd | 449.25 | 89.91% | 9.82% | 0.27% | 1.74 | 97.12% |
| 13 | India Post Payments Bank Ltd | 370.25 | 87.95% | 11.48% | 0.58% | 1.30 | 93.30% |
| 14 | Indian Overseas Bank | 221.41 | 91.62% | 5.67% | 2.71% | 2.53 | 83.77% |
| 15 | Federal Bank Ltd. | 220.03 | 94.15% | 5.81% | 0.04% | 0.58 | 99.00% |
| 16 | Central Bank Of India | 219.42 | 87.43% | 11.13% | 1.45% | 1.27 | 84.32% |
| 17 | UCO Bank | 202.25 | 91.83% | 7.48% | 0.70% | 0.81 | 74.19% |
| 18 | IDBI Bank | 167.82 | 93.46% | 5.98% | 0.55% | 0.75 | 80.34% |
| 19 | INDUSIND BANK Ltd. | 165.88 | 91.52% | 8.37% | 0.11% | 0.66 | 93.54% |
| 20 | Bank of Maharashtra | 165.00 | 93.33% | 6.37% | 0.30% | 0.60 | 72.66% |
| 21 | Fino Payments Bank Limited | 154.66 | 92.79% | 7.09% | 0.12% | 0.62 | 90.32% |
| 22 | Yes Bank Ltd. | 131.04 | 94.14% | 5.69% | 0.16% | 0.33 | 73.57% |
| 23 | Karnataka Bank | 117.35 | 93.35% | 6.47% | 0.18% | 0.35 | 89.55% |
| 24 | IDFC First Bank Ltd | 89.72 | 93.65% | 6.14% | 0.22% | 0.40 | 60.52% |
| 25 | Karur Vysya Bank | 73.53 | 92.19% | 6.56% | 1.25% | 0.37 | 81.06% |
| 26 | AU small Finance Bank | 69.23 | 91.09% | 8.74% | 0.17% | 0.18 | 90.37% |
| 27 | The Jammu & Kashmir Bank Limited | 69.03 | 92.85% | 5.24% | 1.90% | 0.76 | 28.28% |
| 28 | Bandhan Bank Limited | 68.05 | 92.88% | 5.45% | 1.67% | 0.40 | 76.70% |
| 29 | Tri O Tech Solutions Private Limited | 61.00 | 100.00% | 0.00% | 0.00% | #N/A | #N/A |
| 30 | The South Indian Bank Limited | 60.27 | 95.12% | 4.80% | 0.09% | 0.15 | 99.29% |
| 31 | Ujjivan Small Finance Bank Limited | 45.35 | 94.46% | 5.22% | 0.32% | 0.15 | 92.62% |
| 32 | City Union Bank | 44.30 | 92.88% | 6.54% | 0.58% | 0.16 | 90.24% |
| 33 | Punjab and Sind Bank | 43.54 | 91.88% | 7.47% | 0.65% | 0.24 | 77.00% |
| 34 | Tamilnad Mercantile Bank Limited | 41.41 | 92.63% | 7.01% | 0.36% | 0.14 | 78.15% |
| 35 | Kerala Gramin Bank | 35.02 | 91.51% | 6.35% | 2.15% | 0.31 | 80.81% |
| 36 | Equitas Small Finance Bank Ltd | 32.20 | 92.96% | 6.98% | 0.06% | 0.11 | 95.27% |
| 37 | Andhra Pradesh Grameena Vikas Bank | 29.88 | 86.57% | 12.21% | 1.23% | 0.13 | 63.57% |
| 38 | Pragathi Krishna Gramin Bank | 28.74 | 88.68% | 7.74% | 3.57% | 0.42 | 70.44% |
| 39 | DBS Bank India Limited | 27.93 | 93.71% | 6.27% | 0.02% | 0.08 | 98.09% |
| 40 | Baroda UP Gramin Bank | 26.48 | 92.16% | 7.56% | 0.28% | 0.10 | 91.42% |
| 41 | Maharashtra Gramin Bank | 25.95 | 86.61% | 12.16% | 1.23% | 0.10 | 76.44% |
| 42 | Rajasthan Marudhara Gramin Bank | 25.85 | 86.65% | 10.52% | 2.83% | 0.16 | 65.99% |
| 43 | ESAF Small Finance Bank Ltd. | 25.76 | 95.46% | 4.43% | 0.11% | 0.09 | 94.77% |
| 44 | Standard Chartered Bank | 25.65 | 96.49% | 2.95% | 0.56% | 0.14 | 51.96% |
| 45 | Saraswat Co-operative Bank | 24.88 | 94.11% | 5.24% | 0.66% | 0.10 | 64.81% |
| 46 | Jio Payments Bank Limited | 22.56 | 88.72% | 10.15% | 1.13% | 0.23 | 96.15% |
| 47 | NSDL Payments Bank Limited | 20.08 | 83.05% | 11.47% | 5.49% | 0.38 | 9.08% |
| 48 | Sarva Haryana Gramin Bank | 19.79 | 89.36% | 6.17% | 4.47% | 0.32 | 28.04% |
| 49 | Andhra Pragathi Grameena Bank | 18.96 | 83.63% | 11.69% | 4.68% | 0.27 | 27.01% |
| 50 | RBL Bank Limited | 18.87 | 91.45% | 8.10% | 0.44% | 0.08 | 67.16% |
| UPI Beneficiary Members - Top 50 Members (Sep'24) | |||||||
|---|---|---|---|---|---|---|---|
| Sr.No. | UPI Beneficiary Members (Sep-2024) | Total Volume (In Mn) | Approved % | BD% | TD% | Deemed Approved % | |
| 1 | Yes Bank Ltd | 6,069.82 | 99.99% | 0.01% | 0.00% | 0.00% | |
| 2 | State Bank Of India | 1,544.10 | 99.39% | 0.12% | 0.49% | 0.04% | |
| 3 | Axis Bank Ltd. | 1,469.29 | 99.93% | 0.06% | 0.00% | 0.01% | |
| 4 | HDFC BANK LTD | 734.28 | 99.05% | 0.94% | 0.01% | 0.01% | |
| 5 | ICICI Bank | 585.98 | 99.29% | 0.47% | 0.23% | 0.08% | |
| 6 | Bank of Baroda | 423.28 | 99.89% | 0.07% | 0.04% | 0.09% | |
| 7 | Federal Bank | 398.62 | 99.78% | 0.21% | 0.02% | 0.00% | |
| 8 | Union Bank of India | 376.52 | 98.88% | 0.10% | 1.01% | 0.23% | |
| 9 | Canara Bank | 376.48 | 98.87% | 0.81% | 0.32% | 0.07% | |
| 10 | Punjab National Bank | 342.49 | 99.65% | 0.27% | 0.07% | 0.09% | |
| 11 | Kotak Mahindra Bank | 289.36 | 99.08% | 0.26% | 0.66% | 0.47% | |
| 12 | Airtel Payments Bank | 272.92 | 99.58% | 0.29% | 0.12% | 0.05% | |
| 13 | Indian Bank | 217.43 | 99.10% | 0.84% | 0.06% | 0.05% | |
| 14 | Bank of India | 209.89 | 98.76% | 0.83% | 0.41% | 0.16% | |
| 15 | India Post Payment Bank | 165.82 | 99.62% | 0.26% | 0.12% | 0.02% | |
| 16 | Indusind Bank Ltd. | 150.60 | 99.67% | 0.30% | 0.04% | 0.01% | |
| 17 | Central Bank Of India | 125.25 | 96.10% | 3.21% | 0.69% | 0.52% | |
| 18 | Indian Overseas Bank | 108.08 | 98.30% | 0.17% | 1.53% | 0.98% | |
| 19 | Fino Payments Bank Ltd. | 92.64 | 96.41% | 3.38% | 0.21% | 0.04% | |
| 20 | UCO Bank | 91.36 | 98.27% | 0.44% | 1.29% | 0.10% | |
| 21 | IDBI Bank Limited | 70.98 | 99.33% | 0.29% | 0.39% | 0.17% | |
| 22 | Bank of Maharashtra | 70.68 | 99.46% | 0.24% | 0.30% | 0.11% | |
| 23 | RBL Bank Limited | 65.45 | 99.29% | 0.32% | 0.38% | 0.27% | |
| 24 | Karnataka Bank | 53.43 | 99.46% | 0.32% | 0.22% | 0.03% | |
| 25 | One Mobikwik Systems Pvt - Ltd | 47.98 | 99.80% | 0.04% | 0.16% | 0.01% | |
| 26 | Bandhan Bank | 39.33 | 98.09% | 0.29% | 1.61% | 0.24% | |
| 27 | IDFC First Bank Ltd | 39.31 | 98.84% | 1.11% | 0.05% | 0.01% | |
| 28 | South Indian Bank | 38.79 | 99.06% | 0.92% | 0.02% | 0.02% | |
| 29 | Karur Vysya Bank | 38.19 | 97.81% | 1.46% | 0.73% | 0.17% | |
| 30 | Jammu and Kashmir Bank | 38.05 | 99.35% | 0.17% | 0.48% | 0.46% | |
| 31 | AU small Finance Bank | 35.26 | 99.05% | 0.78% | 0.17% | 0.05% | |
| 32 | Tri O Tech Solutions Private Limited | 28.83 | 96.18% | 3.81% | 0.00% | 0.00% | |
| 33 | Tamilnad Mercantile Bank | 28.12 | 124.22% | 0.08% | 0.29% | 0.07% | |
| 34 | City Union Bank | 24.24 | 97.59% | 1.90% | 0.50% | 0.03% | |
| 35 | Ujjivan Small Finance Bank | 23.05 | 98.95% | 0.82% | 0.23% | 0.17% | |
| 36 | Punjab and Sind Bank | 21.60 | 99.16% | 0.38% | 0.45% | 0.15% | |
| 37 | Kerala Gramin Bank | 18.64 | 97.84% | 0.93% | 1.23% | 0.58% | |
| 38 | CITI Bank | 17.54 | 99.27% | 0.66% | 0.07% | 0.03% | |
| 39 | Jio Payments Bank | 17.18 | 99.25% | 0.37% | 0.38% | 0.21% | |
| 40 | Pragathi Krishna Gramin Bank | 13.73 | 96.95% | 1.24% | 1.81% | 1.02% | |
| 41 | Andhra Pradesh Grameena Vikas Bank | 13.71 | 98.92% | 0.40% | 0.68% | 0.15% | |
| 42 | Equitas Bank | 13.44 | 98.64% | 1.29% | 0.07% | 0.02% | |
| 43 | Baroda UP Gramin Bank | 13.13 | 99.48% | 0.32% | 0.21% | 0.06% | |
| 44 | ESAF Small Finance Bank Ltd. | 12.08 | 98.74% | 1.15% | 0.11% | 0.04% | |
| 45 | Maharashtra Gramin Bank | 12.02 | 97.96% | 0.20% | 1.84% | 0.18% | |
| 46 | Rajasthan Marudhara Gramin Bank | 11.31 | 97.58% | 0.46% | 1.97% | 0.14% | |
| 47 | DBS Bank India Limited | 11.13 | 98.39% | 1.36% | 0.26% | 0.01% | |
| 48 | Andhra Pragathi Grameena Bank | 9.63 | 94.93% | 0.22% | 4.84% | 0.40% | |
| 49 | Sarva Haryana Gramin Bank | 8.51 | 96.46% | 0.35% | 3.19% | 0.92% | |
| 50 | Sarva UP Gramin Bank | 8.11 | 96.43% | 0.51% | 3.07% | 0.96% | |
| UPI Apps (Sep'24) | |||||||||
|---|---|---|---|---|---|---|---|---|---|
| Sr.No. | Application Name | Customer Initiated Transactions | B2C Transactions | B2B Transactions | Total | ||||
| Volume (Mn) | Value (Cr) | Volume (Mn) | Value (Cr) | Volume (Mn) | Value (Cr) | Volume (Mn) | Value (Cr) | ||
| 1 | PhonePe # | 7,221.22 | 10,30,871.00 | 0.00 | 0.00 | 0.00 | 0.00 | 7,221.22 | 10,30,871.00 |
| 2 | Google Pay # | 5,625.22 | 7,46,690.05 | 0.00 | 0.00 | 0.00 | 0.00 | 5,625.22 | 7,46,690.05 |
| 3 | Paytm (OCL) # | 1,064.62 | 1,13,351.53 | 0.00 | 0.01 | 0.00 | 0.00 | 1,064.62 | 1,13,351.54 |
| 4 | Cred # | 140.00 | 47,982.71 | 0.00 | 0.00 | 0.00 | 0.00 | 140.00 | 47,982.71 |
| 5 | Navi # | 120.41 | 6,549.10 | 0.00 | 0.00 | 0.00 | 0.00 | 120.41 | 6,549.10 |
| 6 | Axis Bank Apps | 17.88 | 4,248.02 | 102.50 | 1,736.70 | 0.01 | 1.76 | 120.38 | 5,986.48 |
| 7 | Amazon Pay # | 70.98 | 7,845.04 | 0.00 | 0.00 | 0.00 | 0.00 | 70.98 | 7,845.04 |
| 8 | Fam App by Trio # | 61.05 | 714.29 | 0.00 | 0.00 | 0.00 | 0.00 | 61.05 | 714.29 |
| 9 | ICICI Bank Apps | 50.84 | 17,864.44 | 0.01 | 7.85 | 2.74 | 3,203.84 | 53.59 | 21,076.12 |
| 10 | WhatsApp # | 48.75 | 3,586.71 | 0.00 | 0.00 | 0.00 | 0.00 | 48.75 | 3,586.71 |
| 11 | Kotak Mahindra Bank Apps | 47.14 | 6,413.16 | 0.00 | 0.00 | 0.00 | 0.00 | 47.14 | 6,413.16 |
| 12 | HDFC Bank Apps | 35.84 | 8,995.98 | 0.29 | 0.53 | 0.01 | 0.60 | 36.14 | 8,997.11 |
| 13 | Yes Bank Apps | 30.61 | 9,747.12 | 0.00 | 0.02 | 0.66 | 30.35 | 31.27 | 9,777.48 |
| 14 | BHIM | 26.39 | 8,466.30 | 0.00 | 0.00 | 0.00 | 0.00 | 26.39 | 8,466.30 |
| 15 | super.money # | 25.75 | 1,131.59 | 0.00 | 0.00 | 0.00 | 0.00 | 25.75 | 1,131.59 |
| 16 | Airtel Payments Bank Apps | 17.41 | 1,278.37 | 0.00 | 0.01 | 0.00 | 0.06 | 17.41 | 1,278.38 |
| 17 | Mobikwik # | 16.07 | 2,964.08 | 0.00 | 0.00 | 0.00 | 0.00 | 16.07 | 2,964.08 |
| 18 | Groww # | 13.46 | 9,526.49 | 0.00 | 0.00 | 0.00 | 0.00 | 13.46 | 9,526.49 |
| 19 | Flipkart UPI # | 12.85 | 734.80 | 0.00 | 0.00 | 0.00 | 0.00 | 12.85 | 734.80 |
| 20 | Bajaj Finserv # | 11.15 | 2,711.55 | 0.00 | 0.00 | 0.00 | 0.00 | 11.15 | 2,711.55 |
| 21 | slice # | 10.62 | 792.06 | 0.00 | 0.00 | 0.00 | 0.00 | 10.62 | 792.06 |
| 22 | State Bank of India Apps | 9.80 | 2,883.41 | 0.00 | 0.00 | 0.00 | 0.00 | 9.80 | 2,883.42 |
| 23 | IDFC Bank Apps | 8.33 | 1,838.99 | 0.00 | 0.00 | 0.00 | 0.00 | 8.33 | 1,838.99 |
| 24 | Samsung Pay # | 7.33 | 564.50 | 0.00 | 0.00 | 0.00 | 0.00 | 7.33 | 564.50 |
| 25 | India Post Payments Bank Apps | 6.96 | 908.78 | 0.00 | 0.00 | 0.00 | 0.00 | 6.96 | 908.78 |
| 26 | Federal Bank Apps | 6.30 | 918.67 | 0.00 | 0.00 | 0.00 | 0.00 | 6.30 | 918.67 |
| 27 | Jupiter Money # | 6.13 | 810.01 | 0.00 | 0.00 | 0.00 | 0.00 | 6.13 | 810.01 |
| 28 | Deutsche Bank Apps | 3.05 | 348.84 | 0.00 | 0.00 | 0.00 | 0.06 | 3.05 | 348.90 |
| 29 | Canara Bank Apps | 3.04 | 799.52 | 0.00 | 0.00 | 0.00 | 0.00 | 3.04 | 799.52 |
| 30 | Jio Payments Bank Apps | 2.79 | 212.23 | 0.00 | 0.00 | 0.00 | 0.00 | 2.79 | 212.23 |
| 31 | Punjab National Bank Apps | 2.74 | 606.83 | 0.00 | 0.00 | 0.00 | 0.00 | 2.74 | 606.83 |
| 32 | Indian Bank Apps | 2.69 | 424.84 | 0.00 | 0.00 | 0.00 | 0.05 | 2.69 | 424.89 |
| 33 | Pop Club # | 1.81 | 131.20 | 0.00 | 0.00 | 0.00 | 0.00 | 1.81 | 131.20 |
| 34 | Timepay # | 1.74 | 15.26 | 0.00 | 0.00 | 0.00 | 0.00 | 1.74 | 15.26 |
| 35 | RBL Bank Apps | 1.64 | 599.18 | 0.00 | 0.00 | 0.01 | 4.26 | 1.66 | 603.44 |
| 36 | OmniCard | 1.31 | 74.96 | 0.00 | 0.00 | 0.00 | 0.00 | 1.31 | 74.96 |
| 37 | Bank of Baroda Apps | 1.12 | 452.89 | 0.00 | 0.00 | 0.00 | 0.00 | 1.12 | 452.89 |
| 38 | Central Bank of India Apps | 0.97 | 189.93 | 0.00 | 0.00 | 0.00 | 0.00 | 0.97 | 189.93 |
| 39 | Jammu and Kashmir Bank Apps | 0.77 | 118.94 | 0.00 | 0.00 | 0.00 | 0.00 | 0.77 | 118.94 |
| 40 | Aditya Birla Capital Digital | 0.72 | 32.26 | 0.00 | 0.00 | 0.00 | 0.00 | 0.72 | 32.26 |
| 41 | Union Bank Apps | 0.62 | 212.37 | 0.00 | 0.00 | 0.00 | 0.00 | 0.62 | 212.37 |
| 42 | South Indian Bank Apps | 0.60 | 169.06 | 0.00 | 0.00 | 0.00 | 0.00 | 0.60 | 169.06 |
| 43 | DBS Digibank Apps | 0.52 | 199.76 | 0.00 | 0.00 | 0.00 | 0.66 | 0.52 | 200.42 |
| 44 | HSBC Bank Apps | 0.50 | 153.35 | 0.00 | 0.10 | 0.00 | 0.09 | 0.51 | 153.54 |
| 45 | Fino Payments bank Apps | 0.49 | 57.89 | 0.00 | 0.00 | 0.00 | 0.00 | 0.49 | 57.89 |
| 46 | AU Small Finance Bank Apps | 0.46 | 136.87 | 0.00 | 0.00 | 0.00 | 0.00 | 0.46 | 136.87 |
| 47 | Digikhata | 0.38 | 122.41 | 0.00 | 0.00 | 0.00 | 0.00 | 0.38 | 122.41 |
| 48 | IndusInd Bank Apps | 0.35 | 88.40 | 0.00 | 0.00 | 0.01 | 2.17 | 0.36 | 90.58 |
| 49 | Shri Ram One # | 0.35 | 42.33 | 0.00 | 0.00 | 0.00 | 0.00 | 0.35 | 42.33 |
| 50 | Kiwi # | 0.29 | 44.31 | 0.00 | 0.00 | 0.00 | 0.00 | 0.29 | 44.31 |
| 51 | Suryoday Bank Apps | 0.29 | 0.03 | 0.00 | 0.00 | 0.00 | 0.00 | 0.29 | 0.03 |
| 52 | UCO Bank Apps | 0.26 | 59.89 | 0.00 | 0.00 | 0.00 | 0.00 | 0.26 | 59.89 |
| 53 | TataNeu # | 0.21 | 40.50 | 0.00 | 0.00 | 0.00 | 0.00 | 0.21 | 40.50 |
| 54 | Indian Overseas Bank Apps | 0.17 | 48.02 | 0.00 | 0.00 | 0.00 | 0.00 | 0.17 | 48.02 |
| 55 | Standard Chartered Bank Apps | 0.17 | 108.84 | 0.00 | 0.00 | 0.00 | 0.02 | 0.17 | 108.86 |
| 56 | Karnataka Bank Apps | 0.15 | 31.93 | 0.00 | 0.00 | 0.00 | 0.00 | 0.15 | 31.93 |
| 57 | Bank of India Apps | 0.15 | 35.33 | 0.00 | 0.00 | 0.00 | 0.00 | 0.15 | 35.33 |
| 58 | Dhani | 0.13 | 15.76 | 0.00 | 0.00 | 0.00 | 0.00 | 0.13 | 15.76 |
| 59 | Ultracash # | 0.12 | 8.71 | 0.00 | 0.00 | 0.00 | 0.00 | 0.12 | 8.71 |
| 60 | Niyo Global # | 0.09 | 49.74 | 0.00 | 0.00 | 0.00 | 0.00 | 0.09 | 49.74 |
| 61 | IDBI Bank Apps | 0.09 | 34.69 | 0.00 | 0.00 | 0.00 | 0.00 | 0.09 | 34.69 |
| 62 | NSDL Payments Bank Apps | 0.08 | 10.60 | 0.00 | 0.00 | 0.00 | 0.00 | 0.08 | 10.60 |
| 63 | City Union Bank Apps | 0.07 | 27.34 | 0.00 | 0.00 | 0.00 | 0.00 | 0.07 | 27.34 |
| 64 | Tamilnad Mercantile Bank Apps | 0.07 | 22.04 | 0.00 | 0.00 | 0.00 | 0.00 | 0.07 | 22.04 |
| 65 | Rapi Pay | 0.06 | 9.55 | 0.00 | 0.00 | 0.00 | 0.00 | 0.06 | 9.55 |
| 66 | Bharat Pe | 0.06 | 6.03 | 0.00 | 0.00 | 0.00 | 0.00 | 0.06 | 6.03 |
| 67 | True Balance | 0.05 | 6.37 | 0.00 | 0.00 | 0.00 | 0.00 | 0.05 | 6.37 |
| 68 | One Card # | 0.05 | 27.93 | 0.00 | 0.00 | 0.00 | 0.00 | 0.05 | 27.93 |
| 69 | Karur Vysya Bank Apps | 0.05 | 16.83 | 0.00 | 0.00 | 0.00 | 0.00 | 0.05 | 16.83 |
| 70 | Salary Se # | 0.04 | 1.78 | 0.00 | 0.00 | 0.00 | 0.00 | 0.04 | 1.78 |
| 71 | Freo Money # | 0.04 | 1.91 | 0.00 | 0.00 | 0.00 | 0.00 | 0.04 | 1.91 |
| 72 | Punjab Sind Bank Apps | 0.03 | 16.39 | 0.00 | 0.00 | 0.00 | 0.00 | 0.03 | 16.39 |
| 73 | Equitas Small Finance Bank Apps | 0.03 | 24.45 | 0.00 | 0.00 | 0.00 | 0.00 | 0.03 | 24.45 |
| 74 | Citi Bank Apps | 0.03 | 1.76 | 0.00 | 0.00 | 0.00 | 0.17 | 0.03 | 1.93 |
| 75 | Allahabad Bank Apps | 0.02 | 5.54 | 0.00 | 0.00 | 0.00 | 0.00 | 0.02 | 5.54 |
| 76 | Others | 1.71 | 203.30 | 0.00 | 0.00 | 0.15 | 5.06 | 1.86 | 208.36 |
Note:-
| UPI P2P and P2M Transactions | ||||||
|---|---|---|---|---|---|---|
| Month | Total | P2P | P2M | |||
| Volume (Mn) | Value (Cr) | Volume (Mn) | Value (Cr) | Volume (Mn) | Value (Cr) | |
| Sep-24 | 15,041.75 | 20,63,994.71 | 5,688.87 | 14,97,941.07 | 9,352.88 | 5,66,053.64 |

| UPI Payer PSP Performance (September'24) | |||||
|---|---|---|---|---|---|
| Sr. No. | Payer PSP | Total Volume (In Mn) | Approved % | BD % | TD % |
| 1 | AXIS Bank Ltd. | 4,933.71 | 94.09% | 5.75% | 0.16% |
| 2 | Yes bank Ltd. | 4,885.12 | 91.71% | 8.15% | 0.14% |
| 3 | ICICI Bank Ltd. | 2,819.10 | 93.52% | 6.35% | 0.13% |
| 4 | State Bank of India | 1,634.70 | 95.72% | 4.11% | 0.16% |
| 5 | HDFC Bank Ltd. | 1,568.06 | 95.01% | 4.88% | 0.11% |
| 6 | Tri O Tech Solutions Private Limited | 61.01 | 100.00% | 0.00% | 0.00% |
| 7 | Kotak Mahindra Bank Ltd | 47.42 | 100.00% | 0.00% | 0.00% |
| 8 | BHIM | 31.28 | 93.32% | 6.46% | 0.22% |
| 9 | Airtel Payments Bank Ltd | 18.16 | 95.91% | 4.01% | 0.08% |
| 10 | RBL Bank Ltd. | 9.13 | 95.71% | 4.16% | 0.14% |
| 11 | IDFC First Bank | 8.95 | 99.42% | 0.57% | 0.01% |
| 12 | India Post Payments Bank Ltd | 6.96 | 99.99% | 0.01% | 0.00% |
| 13 | Federal Bank Ltd. | 6.48 | 98.24% | 1.73% | 0.03% |
| 14 | One Mobikwik Systems Pvt - Ltd | 6.18 | 100.00% | 0.00% | 0.00% |
| 15 | Garagepreneurs Internet Private Limited | 4.83 | 100.00% | 0.00% | 0.00% |
| UPI Payee PSP Performance (September'24) | |||||
|---|---|---|---|---|---|
| Sr. No. | Payee PSP | Total Volume (In Mn) | Approved % | BD % | TD % |
| 1 | Yes bank Ltd. | 8,450.94 | 92.64% | 7.21% | 0.14% |
| 2 | AXIS Bank Ltd. | 2,830.55 | 94.67% | 5.18% | 0.15% |
| 3 | ICICI Bank Ltd. | 1,548.92 | 93.95% | 5.90% | 0.15% |
| 4 | HDFC Bank Ltd. | 930.08 | 94.44% | 5.42% | 0.14% |
| 5 | State Bank of India | 838.01 | 95.13% | 4.72% | 0.15% |
| 6 | Federal Bank Ltd. | 331.05 | 96.91% | 2.94% | 0.15% |
| 7 | Indusind Bank Ltd. | 104.81 | 92.33% | 7.52% | 0.15% |
| 8 | Canara Bank | 96.46 | 95.4% | 4.46% | 0.14% |
| 9 | Airtel Payments Bank Limited | 87.26 | 94.6% | 5.27% | 0.13% |
| 10 | RBL Bank Ltd. | 65.9 | 92.68% | 7.15% | 0.17% |
| 11 | ONE MOBIKWIK SYSTEMS LIMITED | 49.66 | 96.41% | 3.45% | 0.14% |
| 12 | Fino Payments Bank Ltd. | 41.86 | 89.98% | 9.85% | 0.17% |
| 13 | Kotak Mahindra Bank | 38.28 | 95.69% | 4.15% | 0.16% |
| 14 | Bank of Baroda | 37.98 | 94.88% | 4.99% | 0.13% |
| 15 | Tri O Tech Solutions Private Limited | 29.47 | 93.79% | 6.04% | 0.18% |
| UPI Merchant Category-wise Classification - September'24 (Arranged by Volume) | ||||
|---|---|---|---|---|
| Type | MCC | Description | Volume (in Mn) | Value (in Cr.) |
| High Transacting Categories | 5411 | Groceries and supermarkets | 2,132.28 | 48,518.73 |
| 5814 | Fast food restaurants | 991.40 | 11,636.71 | |
| 5812 | Eating places and restaurants | 886.69 | 14,244.65 | |
| 4814 | Telecommunication services, including local and long distance calls, credit card calls, calls through use of magnetic stripe reading telephones and faxes | 760.54 | 17,282.79 | |
| 5541 | Service stations (with or without ancillary services) | 461.46 | 25,724.69 | |
| 5816 | Digital Goods: Games | 264.47 | 9,245.22 | |
| 5912 | Drug stores and pharmacies | 235.82 | 9,065.51 | |
| 5462 | Bakeries | 207.96 | 2,975.85 | |
| 4900 | Utilities electric, gas, water and sanitary | 162.57 | 19,466.30 | |
| 5993 | Cigar shops and stands | 134.64 | 860.02 | |
| Medium Transacting Categories | 5451 | Dairies | 134.47 | 3,303.52 |
| 5311 | Department stores | 133.73 | 3,834.56 | |
| 7322 | Debt collection agencies | 103.64 | 66,775.70 | |
| 5813 | Drinking places (alcoholic beverages) bars, taverns, night-clubs, cocktail lounges and discothques | 87.80 | 3,295.43 | |
| 5441 | Candy, nut and confectionery shops | 80.97 | 1,444.78 | |
| 5422 | Freezer and locker meat provisioners | 75.00 | 2,353.11 | |
| 5921 | Package shops beer, wine and liquor | 73.79 | 3,070.56 | |
| 5262 | Online Marketplaces | 67.03 | 6,127.50 | |
| 6211 | Securities brokers and dealers | 66.47 | 57,662.80 | |
| 7622 | Electronics repair shops | 64.39 | 1,953.20 | |
| All Other Categories | 5732 | Electronics shops | 62.21 | 7,937.08 |
| 9399 | Government services not elsewhere classified | 61.08 | 6,307.81 | |
| 7230 | Beauty and barber shops | 60.41 | 1,706.80 | |
| 5137 | Mens, womens and childrens uniforms and commercial clothing | 59.16 | 5,181.19 | |
| 4112 | Passenger railways | 58.99 | 3,063.22 | |
| 5331 | Variety stores | 51.42 | 2,669.84 | |
| 5691 | Mens and womens clothing shops | 50.68 | 6,384.23 | |
| 4121 | Taxi-cabs and limousines | 50.04 | 1,066.90 | |
| 7011 | Lodging hotels, motels and resorts | 43.00 | 3,149.55 | |
| Others | 1,730.76 | 2,19,745.04 | ||
| Total | 9,352.88 | 5,66,053.30 | ||
| State-wise UPI Product Statistics* (Sep'24) | |||||
|---|---|---|---|---|---|
| Sr. No. | State / Union Territory | Volume (in Mn ) | Volume Contribution (%) | Value (in Cr.) | Value Contribution (%) |
| 1 | MAHARASHTRA | 1,921.65 | 12.78% | 2,36,569.03 | 11.46% |
| 2 | KARNATAKA | 1,177.67 | 7.83% | 1,60,384.81 | 7.77% |
| 3 | UTTAR PRADESH | 934.80 | 6.21% | 1,20,545.17 | 5.84% |
| 4 | TELANGANA | 903.59 | 6.01% | 1,38,868.45 | 6.73% |
| 5 | TAMIL NADU | 677.22 | 4.50% | 1,04,511.95 | 5.06% |
| 6 | RAJASTHAN | 611.85 | 4.07% | 86,708.82 | 4.20% |
| 7 | ANDHRA PRADESH | 542.10 | 3.60% | 94,580.08 | 4.58% |
| 8 | MADHYA PRADESH | 530.34 | 3.53% | 67,023.14 | 3.25% |
| 9 | BIHAR | 464.06 | 3.09% | 65,536.16 | 3.18% |
| 10 | GUJARAT | 451.88 | 3.00% | 68,576.37 | 3.32% |
| 11 | WEST BENGAL | 433.30 | 2.88% | 68,329.39 | 3.31% |
| 12 | DELHI | 421.20 | 2.80% | 50,173.14 | 2.43% |
| 13 | HARYANA | 338.58 | 2.25% | 46,386.40 | 2.25% |
| 14 | ODISHA | 330.33 | 2.20% | 40,771.74 | 1.98% |
| 15 | KERALA | 328.85 | 2.19% | 45,855.58 | 2.22% |
| 16 | ASSAM | 178.99 | 1.19% | 21,297.03 | 1.03% |
| 17 | PUNJAB | 175.30 | 1.17% | 27,746.05 | 1.34% |
| 18 | JHARKHAND | 157.39 | 1.05% | 20,697.40 | 1.00% |
| 19 | CHHATTISGARH | 139.40 | 0.93% | 17,367.52 | 0.84% |
| 20 | UTTARAKHAND | 96.90 | 0.64% | 11,894.78 | 0.58% |
| 21 | JAMMU AND KASHMIR | 65.19 | 0.43% | 9,238.54 | 0.45% |
| 22 | HIMACHAL PRADESH | 49.18 | 0.33% | 6,379.72 | 0.31% |
| 23 | GOA | 27.30 | 0.18% | 3,820.31 | 0.19% |
| 24 | CHANDIGARH | 26.39 | 0.18% | 3,242.29 | 0.16% |
| 25 | ARUNACHAL PRADESH | 14.94 | 0.10% | 1,961.17 | 0.10% |
| 26 | PUDUCHERRY | 14.88 | 0.10% | 2,074.71 | 0.10% |
| 27 | TRIPURA | 10.68 | 0.07% | 1,580.23 | 0.08% |
| 28 | MEGHALAYA | 10.49 | 0.07% | 1,520.91 | 0.07% |
| 29 | DADRA & NAGAR HAVELI & DAMAN & DIU | 9.91 | 0.07% | 998.03 | 0.05% |
| 30 | MANIPUR | 8.17 | 0.05% | 1,910.52 | 0.09% |
| 31 | NAGALAND | 8.16 | 0.05% | 1,468.38 | 0.07% |
| 32 | MIZORAM | 7.35 | 0.05% | 1,279.85 | 0.06% |
| 33 | SIKKIM | 6.08 | 0.04% | 864.13 | 0.04% |
| 34 | LADAKH | 3.34 | 0.02% | 668.70 | 0.03% |
| 35 | ANDAMAN & NICOBAR | 3.03 | 0.02% | 490.42 | 0.02% |
| 36 | LAKSHADWEEP | 0.36 | 0.00% | 41.72 | 0.00% |
| 37 | UNCLASSIFIED# | 3,960.88 | 26.33% | 5,32,632.08 | 25.81% |
| UPI Remitter Members - Top 50 Members (Aug'24) | |||||||
|---|---|---|---|---|---|---|---|
| Sr. No. | UPI Remitter Members (Aug-2024) | Total Volume (In Mn) | Approved % | BD % | TD% | Total Debit Reversal Count (In Mn) | Debit Reversal Success % |
| 1 | State Bank Of India | 4,052.31 | 94.40% | 5.39% | 0.21% | 11.86 | 98.58% |
| 2 | HDFC Bank Ltd. | 1,270.59 | 95.28% | 4.66% | 0.06% | 3.61 | 99.34% |
| 3 | Bank of Baroda | 985.86 | 92.45% | 6.95% | 0.60% | 3.26 | 95.42% |
| 4 | Union Bank Of India | 941.93 | 93.51% | 5.83% | 0.65% | 3.91 | 68.43% |
| 5 | Punjab national Bank | 835.00 | 91.99% | 7.92% | 0.09% | 2.96 | 95.13% |
| 6 | Kotak Mahindra Bank | 772.93 | 92.43% | 7.48% | 0.09% | 2.03 | 93.51% |
| 7 | Axis bank Ltd. | 730.47 | 95.47% | 4.53% | 0.00% | 1.67 | 98.74% |
| 8 | Canara Bank | 722.42 | 93.11% | 6.11% | 0.78% | 3.27 | 85.39% |
| 9 | ICICI Bank Ltd. | 648.75 | 96.15% | 3.76% | 0.09% | 1.37 | 96.47% |
| 10 | Bank Of India | 478.26 | 93.86% | 5.61% | 0.53% | 2.07 | 74.34% |
| 11 | Indian Bank | 462.16 | 94.02% | 5.92% | 0.06% | 1.36 | 95.17% |
| 12 | Airtel Payments Bank Ltd | 437.93 | 90.01% | 9.84% | 0.15% | 1.81 | 97.33% |
| 13 | India Post Payments Bank Ltd | 349.66 | 88.27% | 10.99% | 0.74% | 1.73 | 91.01% |
| 14 | Federal bank Ltd. | 221.37 | 94.22% | 5.75% | 0.03% | 0.59 | 99.43% |
| 15 | Central Bank of India | 218.28 | 88.36% | 11.05% | 0.59% | 1.08 | 81.74% |
| 16 | Indian Overseas Bank | 217.93 | 92.44% | 5.92% | 1.64% | 1.05 | 90.49% |
| 17 | UCO Bank | 200.84 | 92.29% | 7.59% | 0.12% | 0.77 | 89.65% |
| 18 | IDBI Bank | 166.58 | 94.17% | 5.57% | 0.26% | 0.75 | 91.64% |
| 19 | Indusind Bank Ltd. | 165.70 | 91.49% | 8.34% | 0.17% | 0.67 | 98.15% |
| 20 | Bank of Maharashtra | 163.62 | 93.33% | 6.41% | 0.25% | 0.53 | 84.69% |
| 21 | Fino Payments Bank Limited | 151.38 | 92.78% | 6.83% | 0.39% | 0.88 | 73.49% |
| 22 | Yes Bank Ltd. | 126.41 | 93.91% | 5.87% | 0.23% | 0.33 | 72.31% |
| 23 | Karnataka Bank | 117.67 | 92.78% | 7.01% | 0.21% | 0.39 | 81.20% |
| 24 | IDFC First Bank Ltd | 89.97 | 93.64% | 6.13% | 0.23% | 0.38 | 61.58% |
| 25 | Karur Vysya Bank | 74.18 | 92.49% | 6.22% | 1.30% | 0.42 | 74.66% |
| 26 | AU small Finance Bank | 69.40 | 91.26% | 8.72% | 0.02% | 0.16 | 97.18% |
| 27 | The Jammu & Kashmir Bank Limited | 69.35 | 92.93% | 5.02% | 2.06% | 0.84 | 31.42% |
| 28 | Bandhan Bank limited | 66.15 | 93.24% | 5.73% | 1.03% | 0.29 | 90.93% |
| 29 | The South Indian Bank Limited | 60.30 | 95.07% | 4.88% | 0.05% | 0.15 | 97.96% |
| 30 | Tri O Tech Solutions Private Limited | 57.12 | 100.00% | 0.00% | 0.00% | #N/A | #N/A |
| 31 | Ujjivan Small Finance Bank Limited | 45.73 | 94.25% | 5.32% | 0.42% | 0.17 | 90.37% |
| 32 | City Union Bank | 44.59 | 92.78% | 6.73% | 0.49% | 0.14 | 96.77% |
| 33 | Punjab and Sind Bank | 42.38 | 92.12% | 7.39% | 0.49% | 0.24 | 81.24% |
| 34 | Tamilnad Mercantile Bank Limited | 41.50 | 91.74% | 7.81% | 0.46% | 0.14 | 77.29% |
| 35 | Kerala Gramin Bank | 34.73 | 90.77% | 6.37% | 2.87% | 0.39 | 70.78% |
| 36 | Equitas Small Finance Bank Ltd | 32.89 | 92.09% | 7.25% | 0.66% | 0.12 | 93.25% |
| 37 | Karnataka Gramin Bank (Erstwhile Pragathi Krishna Gramin Bank) | 30.19 | 84.79% | 7.38% | 7.83% | 0.84 | 50.55% |
| 38 | Andhra Pradesh Grameena Vikas Bank - IMPS | 28.61 | 86.25% | 12.84% | 0.91% | 0.10 | 76.11% |
| 39 | DBS Bank India Limited | 28.32 | 93.80% | 6.18% | 0.03% | 0.08 | 99.45% |
| 40 | Standard Chartered Bank | 26.22 | 97.09% | 2.89% | 0.03% | 0.06 | 93.72% |
| 41 | ESAF Small Finance Bank Ltd. | 25.47 | 95.08% | 4.72% | 0.21% | 0.09 | 90.60% |
| 42 | Saraswat Co-operative Bank | 25.08 | 95.11% | 4.76% | 0.13% | 0.07 | 91.58% |
| 43 | Maharashtra Gramin Bank | 24.99 | 86.37% | 12.27% | 1.35% | 0.09 | 84.89% |
| 44 | Baroda U.P. Bank (Erstwhile Baroda Uttar Pradesh Gramin Bank) | 24.96 | 88.53% | 8.79% | 2.68% | 0.25 | 39.56% |
| 45 | Rajasthan Marudhara Gramin Bank | 23.83 | 86.87% | 10.55% | 2.58% | 0.20 | 56.54% |
| 46 | Sarva Haryana Gramin Bank | 20.33 | 87.70% | 6.60% | 5.70% | 0.33 | 52.55% |
| 47 | Jio Payments Bank limited | 20.10 | 82.02% | 15.04% | 2.94% | 0.23 | 89.82% |
| 48 | RBL Bank Ltd. | 18.51 | 90.75% | 8.85% | 0.40% | 0.07 | 67.86% |
| 49 | NSDL Payments Bank Limited | 18.11 | 84.73% | 11.81% | 3.47% | 0.27 | 17.10% |
| 50 | Andhra Pragathi Grameena Bank | 17.78 | 85.45% | 12.94% | 1.61% | 0.09 | 61.42% |
| UPI Beneficiary Members - Top 50 Members (Aug'24) | |||||||
|---|---|---|---|---|---|---|---|
| Sr.No. | UPI Beneficiary Members (Aug-2024) | Total Volume (In Mn) | Approved % | BD% | TD% | Deemed Approved % | |
| 1 | Yes Bank Ltd. | 6,021.00 | 99.99% | 0.01% | 0.00% | 0.00% | |
| 2 | State Bank Of India | 1,562.83 | 99.73% | 0.11% | 0.15% | 0.03% | |
| 3 | Axis bank Ltd. | 1,437.88 | 99.93% | 0.07% | 0.00% | 0.01% | |
| 4 | HDFC Bank Ltd. | 729.74 | 99.09% | 0.86% | 0.05% | 0.03% | |
| 5 | ICICI Bank Ltd. | 605.83 | 99.30% | 0.64% | 0.06% | 0.02% | |
| 6 | Bank of Baroda | 430.60 | 99.55% | 0.10% | 0.35% | 0.19% | |
| 7 | Federal Bank Ltd. | 411.62 | 99.75% | 0.24% | 0.01% | 0.00% | |
| 8 | Union Bank Of India | 379.29 | 99.45% | 0.11% | 0.43% | 0.09% | |
| 9 | Canara Bank | 364.14 | 98.59% | 0.79% | 0.62% | 0.13% | |
| 10 | Punjab national Bank | 336.13 | 99.70% | 0.29% | 0.02% | 0.07% | |
| 11 | Kotak Mahindra Bank Ltd | 292.43 | 99.62% | 0.28% | 0.10% | 0.07% | |
| 12 | Airtel Payments Bank Ltd | 285.48 | 99.61% | 0.30% | 0.09% | 0.03% | |
| 13 | Indian Bank | 235.76 | 99.00% | 0.94% | 0.07% | 0.08% | |
| 14 | Bank Of India | 207.96 | 98.71% | 0.84% | 0.45% | 0.17% | |
| 15 | India Post Payments Bank Ltd | 156.65 | 99.15% | 0.30% | 0.55% | 0.04% | |
| 16 | Indusind Bank Ltd. | 146.14 | 99.30% | 0.42% | 0.28% | 0.11% | |
| 17 | Central Bank of India | 109.19 | 96.05% | 3.66% | 0.28% | 0.21% | |
| 18 | Indian Overseas Bank | 107.88 | 96.86% | 1.84% | 1.30% | 0.55% | |
| 19 | UCO Bank | 90.38 | 99.31% | 0.57% | 0.12% | 0.03% | |
| 20 | Fino Payments Bank Ltd. | 85.69 | 95.99% | 3.57% | 0.44% | 0.06% | |
| 21 | IDBI Bank Ltd. | 70.75 | 99.54% | 0.33% | 0.13% | 0.14% | |
| 22 | Bank of Maharashtra | 67.17 | 99.31% | 0.34% | 0.34% | 0.07% | |
| 23 | RBL Bank Ltd. | 60.49 | 99.27% | 0.42% | 0.32% | 0.19% | |
| 24 | Karnataka Bank Ltd | 52.41 | 99.26% | 0.54% | 0.19% | 0.05% | |
| 25 | Karur Vysya Bank | 46.99 | 98.00% | 1.23% | 0.77% | 0.27% | |
| 26 | One Mobikwik Systems Pvt - Ltd | 45.37 | 99.95% | 0.03% | 0.02% | 0.00% | |
| 27 | IDFC First Bank Ltd | 39.12 | 98.68% | 1.20% | 0.12% | 0.06% | |
| 28 | South Indian Bank | 38.46 | 99.08% | 0.87% | 0.04% | 0.01% | |
| 29 | Bandhan Bank Ltd. | 38.00 | 98.56% | 0.39% | 1.04% | 0.06% | |
| 30 | Jammu and Kashmir Bank | 37.39 | 99.23% | 0.25% | 0.53% | 0.52% | |
| 31 | AU small Finance Bank | 36.23 | 98.80% | 1.18% | 0.02% | 0.01% | |
| 32 | Tamilnad Mercantile Bank | 28.01 | 99.48% | 0.09% | 0.43% | 0.08% | |
| 33 | Tri O Tech Solutions Private Ltd. | 27.57 | 96.28% | 3.70% | 0.02% | 0.00% | |
| 34 | City Union Bank | 23.98 | 97.80% | 1.70% | 0.50% | 0.01% | |
| 35 | Ujjivan Small Finance Bank | 22.97 | 98.91% | 0.77% | 0.32% | 0.15% | |
| 36 | Punjab and Sind Bank | 20.54 | 98.57% | 1.06% | 0.37% | 0.08% | |
| 37 | KERALA GRAMIN BANK | 18.28 | 97.28% | 0.83% | 1.89% | 0.85% | |
| 38 | CITI Bank | 17.18 | 98.67% | 1.22% | 0.11% | 0.04% | |
| 39 | JIO PAYMENTS BANK LTD | 14.70 | 98.20% | 0.85% | 0.94% | 0.43% | |
| 40 | Karnataka Gramin Bank (Erstwhile Pragathi Krishna Gramin Bank) | 13.94 | 94.83% | 0.91% | 4.26% | 2.26% | |
| 41 | Equitas Small Finance Bank Ltd | 13.80 | 97.69% | 1.97% | 0.34% | 0.04% | |
| 42 | Andhra Pradesh Grameena Vikas Bank | 12.97 | 98.64% | 0.41% | 0.95% | 0.07% | |
| 43 | Baroda Uttar Pradesh Gramin Bank | 12.43 | 97.54% | 0.33% | 2.13% | 0.60% | |
| 44 | ESAF Small Finance Bank Ltd. | 11.85 | 98.74% | 1.06% | 0.20% | 0.04% | |
| 45 | Maharashtra Gramin Bank | 11.41 | 98.29% | 0.28% | 1.43% | 0.17% | |
| 46 | DBS Bank India Ltd. | 10.91 | 98.65% | 1.33% | 0.02% | 0.01% | |
| 47 | Rajasthan Marudhara Gramin Bank | 10.52 | 97.75% | 0.51% | 1.74% | 0.23% | |
| 48 | Andhra Pragathi Grameena Bank | 8.91 | 98.06% | 0.23% | 1.71% | 0.13% | |
| 49 | SARVA HARYANA GRAMIN BANK | 8.71 | 95.16% | 0.36% | 4.48% | 0.39% | |
| 50 | Cosmos Bank | 8.61 | 97.57% | 0.34% | 2.09% | 1.20% | |
| UPI Apps (Aug'24) | |||||||||
|---|---|---|---|---|---|---|---|---|---|
| Sr.No. | Application Name | Customer Initiated Transactions | B2C Transactions | B2B Transactions | Total | ||||
| Volume (Mn) | Value (Cr) | Volume (Mn) | Value (Cr) | Volume (Mn) | Value (Cr) | Volume (Mn) | Value (Cr) | ||
| 1 | PhonePe # | 7,236.49 | 10,33,264.34 | - | - | - | - | 7,236.49 | 10,33,264.34 |
| 2 | Google Pay # | 5,592.45 | 7,42,223.07 | - | - | - | - | 5,592.45 | 7,42,223.07 |
| 3 | Paytm # | 1,078.90 | 1,13,672.16 | 0.00 | 0.00 | - | - | 1,078.90 | 1,13,672.17 |
| 4 | Cred # | 147.48 | 50,720.89 | - | - | - | - | 147.48 | 50,720.89 |
| 5 | Axis Bank Apps | 18.05 | 4,189.44 | 95.91 | 1,642.70 | 0.01 | 2.21 | 113.97 | 5,834.35 |
| 6 | Navi # | 88.71 | 4,651.32 | - | - | - | - | 88.71 | 4,651.32 |
| 7 | Amazon Pay # | 70.72 | 7,744.21 | - | - | - | - | 70.72 | 7,744.21 |
| 8 | FamApp by Trio # | 57.16 | 686.06 | - | - | - | - | 57.16 | 686.06 |
| 9 | ICICI Bank Apps | 48.59 | 18,120.13 | 0.01 | 6.62 | 2.72 | 3,182.57 | 51.31 | 21,309.33 |
| 10 | Kotak Mahindra Bank Apps | 46.94 | 6,349.00 | - | - | - | - | 46.94 | 6,349.00 |
| 11 | WhatsApp # | 45.43 | 3,421.99 | - | - | - | - | 45.43 | 3,421.99 |
| 12 | HDFC Bank Apps | 35.74 | 8,834.38 | 0.26 | 0.39 | 0.01 | 0.42 | 36.00 | 8,835.19 |
| 13 | Yes Bank Apps | 25.94 | 9,692.56 | 0.00 | 0.01 | 0.37 | 24.65 | 26.30 | 9,717.22 |
| 14 | BHIM | 25.94 | 8,363.28 | - | - | - | - | 25.94 | 8,363.28 |
| 15 | Airtel Payments Bank Apps | 17.56 | 1,221.85 | 0.00 | 0.01 | - | - | 17.56 | 1,221.86 |
| 16 | Mobikwik # | 14.94 | 3,012.52 | - | - | - | - | 14.94 | 3,012.52 |
| 17 | Groww # | 13.65 | 9,693.95 | - | - | - | - | 13.65 | 9,693.95 |
| 18 | super.money # | 11.63 | 385.77 | - | - | - | - | 11.63 | 385.77 |
| 19 | Bajaj Finserv # | 11.01 | 2,639.91 | - | - | - | - | 11.01 | 2,639.91 |
| 20 | slice # | 10.53 | 775.67 | - | - | - | - | 10.53 | 775.67 |
| 21 | State Bank of India Apps | 9.00 | 2,827.84 | 0.00 | 0.00 | 9.00 | 2,827.84 | ||
| 22 | Flipkart UPI # | 8.60 | 468.99 | - | - | - | - | 8.60 | 468.99 |
| 23 | IDFC Bank Apps | 8.01 | 1,768.92 | - | - | 0.00 | 0.00 | 8.01 | 1,768.92 |
| 24 | Samsung Pay # | 7.14 | 567.24 | - | - | - | - | 7.14 | 567.24 |
| 25 | India Post Payments Bank Apps | 7.04 | 906.00 | - | - | - | - | 7.04 | 906.00 |
| 26 | Federal Bank Apps | 6.25 | 901.05 | - | - | - | - | 6.25 | 901.05 |
| 27 | Jupiter Money # | 6.04 | 807.39 | - | - | - | - | 6.04 | 807.39 |
| 28 | Deutsche Bank Apps | 3.73 | 369.37 | - | - | 0.00 | 0.07 | 3.73 | 369.45 |
| 29 | Canara Bank Apps | 3.10 | 810.75 | - | - | - | - | 3.10 | 810.75 |
| 30 | Jio Payments Bank Apps | 2.62 | 201.60 | - | - | - | - | 2.62 | 201.60 |
| 31 | Punjab National Bank Apps | 2.57 | 595.26 | - | - | - | - | 2.57 | 595.26 |
| 32 | Indian Bank Apps | 2.26 | 373.47 | - | - | 0.00 | 0.28 | 2.26 | 373.75 |
| 33 | RBL Bank Apps | 1.53 | 548.79 | 0.00 | 0.00 | 0.02 | 5.51 | 1.55 | 554.30 |
| 34 | Timepay # | 1.29 | 12.89 | - | - | 0.00 | 0.02 | 1.29 | 12.90 |
| 35 | Union Bank Apps | 1.27 | 468.83 | - | - | 0.00 | 0.00 | 1.27 | 468.83 |
| 36 | OmniCard # | 1.21 | 61.66 | - | - | - | - | 1.21 | 61.66 |
| 37 | Bank of Baroda Apps | 1.13 | 449.45 | - | - | - | - | 1.13 | 449.45 |
| 38 | Jammu and Kashmir Bank Apps | 0.93 | 122.73 | - | - | - | - | 0.93 | 122.73 |
| 39 | Central Bank of India Apps | 0.85 | 173.27 | - | - | - | - | 0.85 | 173.27 |
| 40 | Pop Club | 0.77 | 72.62 | - | - | - | - | 0.77 | 72.62 |
| 41 | South Indian Bank Apps | 0.62 | 168.87 | - | - | - | - | 0.62 | 168.87 |
| 42 | AU Small Finance Bank Apps | 0.53 | 155.57 | - | - | - | - | 0.53 | 155.57 |
| 43 | DBS Digibank Apps | 0.52 | 198.88 | - | - | 0.00 | 0.58 | 0.52 | 199.46 |
| 44 | Aditya Birla Capital Digital | 0.51 | 16.36 | - | - | - | - | 0.51 | 16.36 |
| 45 | HSBC Bank Apps | 0.49 | 168.50 | 0.00 | 0.09 | 0.00 | 0.00 | 0.49 | 168.59 |
| 46 | Fino Payments bank Apps | 0.46 | 54.37 | - | - | - | - | 0.46 | 54.37 |
| 47 | IndusInd Bank Apps | 0.37 | 99.26 | - | - | 0.01 | 2.23 | 0.37 | 101.49 |
| 48 | Digikhata # | 0.33 | 110.14 | - | - | - | - | 0.33 | 110.14 |
| 49 | Shri Ram One # | 0.33 | 37.87 | - | - | - | - | 0.33 | 37.87 |
| 50 | Kiwi # | 0.29 | 37.80 | - | - | - | - | 0.29 | 37.80 |
| 51 | UCO Bank Apps | 0.24 | 53.95 | - | - | - | - | 0.24 | 53.95 |
| 52 | Suryoday Bank Apps | 0.21 | 0.02 | - | - | 0.00 | 0.00 | 0.21 | 0.02 |
| 53 | Karnataka Bank Apps | 0.19 | 39.14 | - | - | 0.00 | 0.00 | 0.19 | 39.14 |
| 54 | TataNeu # | 0.18 | 28.51 | - | - | - | - | 0.18 | 28.51 |
| 55 | Standard Chartered Bank Apps | 0.18 | 116.65 | - | - | 0.00 | 0.03 | 0.18 | 116.68 |
| 56 | Indian Overseas Bank Apps | 0.17 | 46.55 | - | - | - | - | 0.17 | 46.55 |
| 57 | Dhani | 0.12 | 15.89 | - | - | - | - | 0.12 | 15.89 |
| 58 | Ultracash | 0.12 | 8.68 | - | - | - | - | 0.12 | 8.68 |
| 59 | Bank of India Apps | 0.11 | 28.04 | - | - | - | - | 0.11 | 28.04 |
| 60 | IDBI Bank Apps | 0.09 | 33.76 | - | - | - | - | 0.09 | 33.76 |
| 61 | City Union Bank Apps | 0.08 | 29.36 | - | - | - | - | 0.08 | 29.36 |
| 62 | Niyo Global | 0.08 | 40.29 | - | - | - | - | 0.08 | 40.29 |
| 63 | Tamilnad Mercantile Bank Apps | 0.08 | 24.17 | - | - | - | - | 0.08 | 24.17 |
| 64 | NSDL Payments Bank Apps | 0.08 | 11.72 | - | - | - | - | 0.08 | 11.72 |
| 65 | Karur Vysya Bank Apps | 0.06 | 21.00 | - | - | - | - | 0.06 | 21.00 |
| 66 | Rapi Pay | 0.06 | 9.04 | - | - | - | - | 0.06 | 9.04 |
| 67 | Equitas Small Finance Bank Apps | 0.04 | 26.40 | - | - | - | - | 0.04 | 26.40 |
| 68 | Punjab Sind Bank Apps | 0.03 | 13.83 | - | - | - | - | 0.03 | 13.83 |
| 69 | Allahabad Bank Apps | 0.02 | 5.13 | - | - | - | - | 0.02 | 5.13 |
| 70 | Others | 1.66 | 226.14 | - | - | 0.15 | 4.44 | 1.82 | 230.58 |
Note:-
| UPI P2P and P2M Transactions | ||||||
|---|---|---|---|---|---|---|
| Month | Total | P2P | P2M | |||
| Volume (Mn) | Value (Cr) | Volume (Mn) | Value (Cr) | Volume (Mn) | Value (Cr) | |
| Aug'24 | 14,963.05 | 20,60,735.57 | 5,625.77 | 14,84,591.00 | 9,337.28 | 5,76,144.57 |
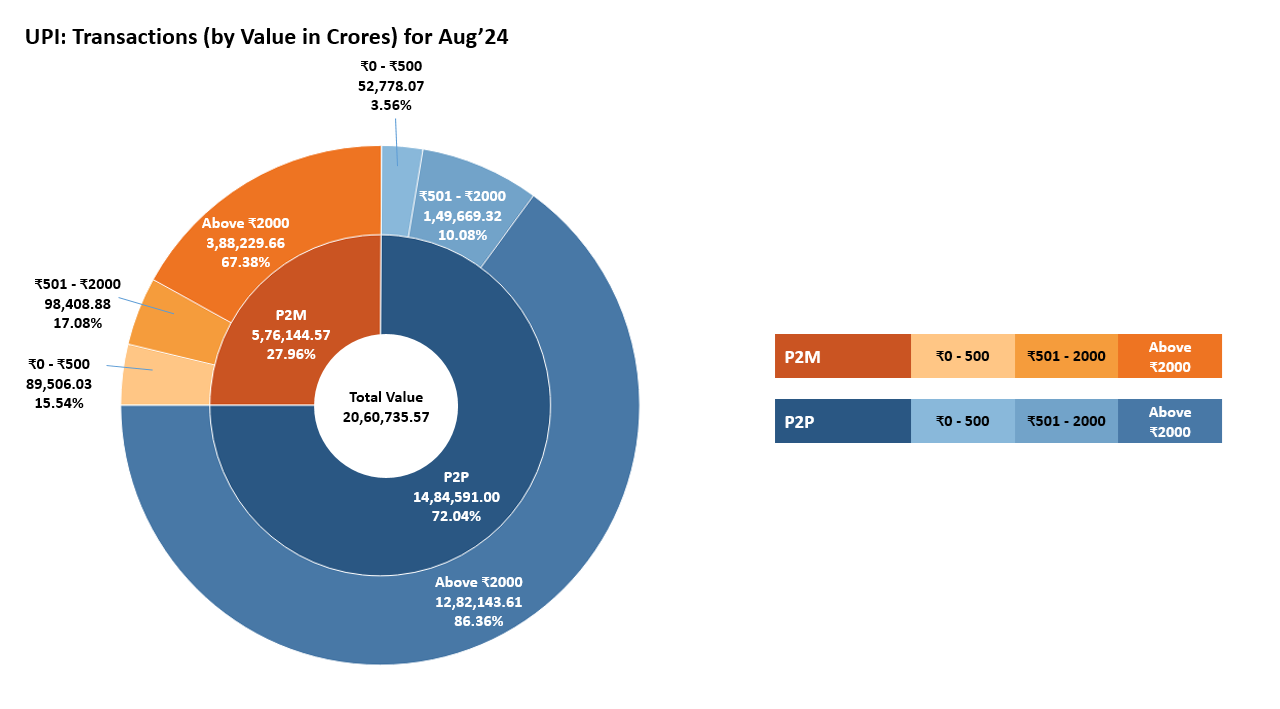

| UPI Payer PSP Performance (August'24) | |||||
|---|---|---|---|---|---|
| Sr. No. | Payer PSP | Total Volume (In Mn) | Approved % | BD % | TD % |
| 1 | Yes bank Ltd. | 4,993.30 | 91.88% | 8.03% | 0.09% |
| 2 | AXIS Bank Ltd. | 4,967.63 | 94.27% | 5.64% | 0.09% |
| 3 | ICICI Bank Ltd. | 2,879.50 | 93.59% | 6.32% | 0.09% |
| 4 | HDFC Bank Ltd. | 1,538.03 | 95.10% | 4.83% | 0.07% |
| 5 | State Bank of India | 1,371.70 | 95.65% | 4.25% | 0.11% |
| 6 | Tri O Tech Solutions Private Limited | 57.12 | 100.00% | 0.00% | 0.00% |
| 7 | Kotak Mahindra Bank Ltd | 47.21 | 100.00% | 0.00% | 0.00% |
| 8 | BHIM | 30.42 | 93.34% | 6.54% | 0.12% |
| 9 | Airtel Payments Bank Ltd | 18.37 | 95.59% | 4.36% | 0.05% |
| 10 | RBL Bank Ltd. | 9.51 | 95.19% | 4.72% | 0.09% |
| 11 | IDFC First Bank | 8.62 | 99.41% | 0.58% | 0.00% |
| 12 | India Post Payments Bank Ltd | 7.05 | 99.96% | 0.04% | 0.00% |
| 13 | Federal Bank Ltd. | 6.39 | 98.10% | 1.89% | 0.01% |
| 14 | One Mobikwik Systems Pvt - Ltd | 5.32 | 100.00% | 0.00% | 0.00% |
| 15 | Garagepreneurs Internet Private Limited | 4.73 | 100.00% | 0.00% | 0.00% |
| UPI Payee PSP Performance (August'24) | |||||
|---|---|---|---|---|---|
| Sr. No. | Payee PSP | Total Volume (In Mn) | Approved % | BD % | TD % |
| 1 | Yes bank Ltd. | 8,408.55 | 92.86% | 7.05% | 0.09% |
| 2 | AXIS Bank Ltd. | 2,755.65 | 94.66% | 5.25% | 0.09% |
| 3 | ICICI Bank Ltd. | 1,582.25 | 93.85% | 6.06% | 0.09% |
| 4 | HDFC Bank Ltd. | 934.55 | 94.36% | 5.56% | 0.08% |
| 5 | State Bank of India | 805.11 | 94.97% | 4.94% | 0.09% |
| 6 | Federal Bank Ltd. | 342.68 | 97.03% | 2.89% | 0.08% |
| 7 | Indusind Bank Ltd. | 95.73 | 92.96% | 6.95% | 0.09% |
| 8 | Airtel Payments Bank Limited | 89.1 | 94.8% | 5.12% | 0.08% |
| 9 | Canara Bank | 86.26 | 95.41% | 4.51% | 0.08% |
| 10 | RBL Bank Ltd. | 60.39 | 93.0% | 6.87% | 0.13% |
| 11 | ONE MOBIKWIK SYSTEMS LIMITED | 46.96 | 96.54% | 3.38% | 0.08% |
| 12 | The Cosmos Co-Operative Bank Ltd | 42.88 | 90.01% | 9.83% | 0.16% |
| 13 | Kotak Mahindra Bank | 40.26 | 95.61% | 4.31% | 0.08% |
| 14 | Fino Payments Bank Ltd. | 35.84 | 90.38% | 9.47% | 0.15% |
| 15 | Indian Bank | 35.23 | 93.27% | 6.62% | 0.11% |
| UPI Merchant Category-wise Classification - August'24 (Arranged by Volume) | ||||
|---|---|---|---|---|
| Type | MCC | Description | Volume (in Mn) | Value (in Cr.) |
| High Transacting Categories | 5411 | Groceries and supermarkets | 2,092.74 | 48,087.96 |
| 5814 | Fast food restaurants | 978.45 | 11,828.04 | |
| 5812 | Eating places and restaurants | 876.87 | 14,335.67 | |
| 4814 | Telecommunication services, including local and long distance calls, credit card calls, calls through use of magnetic stripe reading telephones and faxes | 789.16 | 17,227.51 | |
| 5541 | Service stations (with or without ancillary services) | 465.56 | 26,071.81 | |
| 5816 | Digital Goods: Games | 303.43 | 11,615.28 | |
| 5912 | Drug stores and pharmacies | 233.63 | 8,988.46 | |
| 5462 | Bakeries | 210.41 | 3,040.91 | |
| 5311 | Department stores | 193.63 | 4,280.34 | |
| 4900 | Utilities electric, gas, water and sanitary | 157.55 | 19,755.59 | |
| Medium Transacting Categories | 5451 | Dairies | 134.37 | 3,397.57 |
| 7322 | Debt collection agencies | 104.67 | 69,345.64 | |
| 5813 | Drinking places (alcoholic beverages) bars, taverns, night-clubs, cocktail lounges and discothques | 85.81 | 3,211.66 | |
| 5441 | Candy, nut and confectionery shops | 83.68 | 1,570.31 | |
| 5993 | Cigar shops and stands | 70.30 | 519.06 | |
| 5921 | Package shops beer, wine and liquor | 70.28 | 2,943.19 | |
| 6211 | Securities brokers and dealers | 66.98 | 58,716.46 | |
| 7622 | Electronics repair shops | 65.57 | 2,006.51 | |
| 5422 | Freezer and locker meat provisioners | 65.01 | 2,025.67 | |
| 5732 | Electronics shops | 63.30 | 7,990.94 | |
| All Other Categories | 5137 | Mens, womens and childrens uniforms and commercial clothing | 61.97 | 5,433.08 |
| 5262 | Online Marketplaces | 60.20 | 5,060.58 | |
| 7230 | Beauty and barber shops | 59.38 | 1,766.33 | |
| 9399 | Government services not elsewhere classified | 58.92 | 6,273.05 | |
| 4112 | Passenger railways | 58.74 | 3,164.91 | |
| 5331 | Variety stores | 49.52 | 2,570.90 | |
| 5691 | Mens and womens clothing shops | 47.59 | 5,806.14 | |
| 4121 | Taxi-cabs and limousines | 47.25 | 1,041.79 | |
| 7011 | Lodging hotels, motels and resorts | 42.02 | 3,110.02 | |
| Others | 1,740.28 | 2,24,959.10 | ||
| Total | 9,337.27 | 5,76,144.48 | ||
| State-wise UPI Product Statistics* (Aug'24) | |||||
|---|---|---|---|---|---|
| Sr. No. | State / Union Territory | Volume (in Mn ) | Volume Contribution (%) | Value (in Cr.) | Value Contribution (%) |
| 1 | MAHARASHTRA | 1,884.85 | 12.60% | 2,36,602.01 | 11.48% |
| 2 | KARNATAKA | 1,182.92 | 7.91% | 1,60,368.38 | 7.78% |
| 3 | UTTAR PRADESH | 931.98 | 6.23% | 1,21,507.51 | 5.90% |
| 4 | TELANGANA | 918.97 | 6.14% | 1,44,389.06 | 7.01% |
| 5 | TAMIL NADU | 677.80 | 4.53% | 1,05,507.85 | 5.12% |
| 6 | RAJASTHAN | 597.32 | 3.99% | 84,947.05 | 4.12% |
| 7 | MADHYA PRADESH | 558.88 | 3.74% | 70,795.32 | 3.44% |
| 8 | ANDHRA PRADESH | 555.05 | 3.71% | 99,099.85 | 4.81% |
| 9 | BIHAR | 466.15 | 3.12% | 65,935.33 | 3.20% |
| 10 | GUJARAT | 435.29 | 2.91% | 65,381.35 | 3.17% |
| 11 | WEST BENGAL | 419.64 | 2.80% | 65,053.05 | 3.16% |
| 12 | DELHI | 400.67 | 2.68% | 49,497.98 | 2.40% |
| 13 | HARYANA | 328.91 | 2.20% | 46,509.17 | 2.26% |
| 14 | KERALA | 328.82 | 2.20% | 45,879.13 | 2.23% |
| 15 | ODISHA | 318.71 | 2.13% | 39,936.62 | 1.94% |
| 16 | ASSAM | 179.44 | 1.20% | 21,310.73 | 1.03% |
| 17 | PUNJAB | 175.29 | 1.17% | 28,217.51 | 1.37% |
| 18 | JHARKHAND | 158.20 | 1.06% | 20,378.75 | 0.99% |
| 19 | CHHATTISGARH | 133.83 | 0.89% | 16,912.86 | 0.82% |
| 20 | UTTARAKHAND | 94.70 | 0.63% | 11,817.20 | 0.57% |
| 21 | JAMMU AND KASHMIR | 63.18 | 0.42% | 8,803.92 | 0.43% |
| 22 | HIMACHAL PRADESH | 48.66 | 0.33% | 6,252.15 | 0.30% |
| 23 | GOA | 27.16 | 0.18% | 3,783.78 | 0.18% |
| 24 | CHANDIGARH | 26.22 | 0.18% | 3,306.96 | 0.16% |
| 25 | PUDUCHERRY | 15.12 | 0.10% | 2,135.31 | 0.10% |
| 26 | ARUNACHAL PRADESH | 14.91 | 0.10% | 2,052.75 | 0.10% |
| 27 | MEGHALAYA | 9.89 | 0.07% | 1,454.13 | 0.07% |
| 28 | TRIPURA | 9.87 | 0.07% | 1,417.55 | 0.07% |
| 29 | MANIPUR | 9.73 | 0.06% | 2,194.45 | 0.11% |
| 30 | DADRA & NAGAR HAVELI & DAMAN & DIU | 9.72 | 0.06% | 992.73 | 0.05% |
| 31 | NAGALAND | 8.77 | 0.06% | 1,564.87 | 0.08% |
| 32 | MIZORAM | 7.22 | 0.05% | 1,281.44 | 0.06% |
| 33 | SIKKIM | 5.78 | 0.04% | 813.44 | 0.04% |
| 34 | LADAKH | 3.50 | 0.02% | 705.94 | 0.03% |
| 35 | ANDAMAN & NICOBAR | 3.00 | 0.02% | 489.24 | 0.02% |
| 36 | LAKSHADWEEP | 0.37 | 0.00% | 41.40 | 0.00% |
| 37 | UNCLASSIFIED# | 3,952.54 | 26.42% | 5,23,398.82 | 25.40% |
| UPI Remitter Members - Top 50 Members (Jul'24) | |||||||
|---|---|---|---|---|---|---|---|
| Sr. No. | UPI Remitter Members (Jul-2024) | Total Volume (In Mn) | Approved % | BD % | TD% | Total Debit Reversal Count (In Mn) | Debit Reversal Success % |
| 1 | State Bank Of India | 3,912.83 | 94.55% | 5.31% | 0.14% | 12.09 | 96.94% |
| 2 | HDFC Bank Ltd. | 1,214.73 | 95.21% | 4.78% | 0.00% | 3.67 | 98.69% |
| 3 | Bank of Baroda | 954.81 | 92.35% | 7.06% | 0.59% | 3.76 | 88.84% |
| 4 | Union Bank Of India | 905.83 | 94.14% | 5.76% | 0.10% | 3.33 | 74.06% |
| 5 | Punjab national Bank | 837.23 | 89.63% | 10.27% | 0.10% | 3.21 | 93.14% |
| 6 | Kotak Mahindra Bank | 746.29 | 92.59% | 7.22% | 0.19% | 2.58 | 78.21% |
| 7 | Axis bank Ltd. | 697.05 | 95.55% | 4.45% | 0.00% | 1.68 | 97.33% |
| 8 | Canara Bank | 688.87 | 93.41% | 6.23% | 0.36% | 3.78 | 70.71% |
| 9 | ICICI Bank Ltd. | 629.64 | 96.15% | 3.83% | 0.02% | 1.66 | 93.07% |
| 10 | Bank Of India | 462.31 | 93.79% | 5.40% | 0.81% | 2.36 | 66.06% |
| 11 | Indian Bank | 449.31 | 94.10% | 5.88% | 0.02% | 1.27 | 94.42% |
| 12 | Airtel Payments Bank Ltd | 430.92 | 89.21% | 10.65% | 0.14% | 1.61 | 93.76% |
| 13 | India Post Payments Bank Ltd | 336.13 | 84.74% | 12.89% | 2.38% | 2.23 | 53.95% |
| 14 | Federal bank Ltd. | 214.60 | 94.25% | 5.71% | 0.04% | 0.60 | 97.44% |
| 15 | Central Bank of India | 211.52 | 88.33% | 11.36% | 0.32% | 1.00 | 89.37% |
| 16 | Indian Overseas Bank | 210.05 | 94.08% | 5.68% | 0.24% | 0.78 | 91.89% |
| 17 | UCO Bank | 194.92 | 92.01% | 7.30% | 0.68% | 1.00 | 78.83% |
| 18 | IDBI Bank | 161.72 | 93.74% | 5.72% | 0.54% | 1.02 | 52.33% |
| 19 | Indusind Bank Ltd. | 161.53 | 92.09% | 7.83% | 0.09% | 0.81 | 87.52% |
| 20 | Bank of Maharashtra | 155.62 | 92.94% | 5.91% | 1.15% | 1.18 | 64.44% |
| 21 | Fino Payments Bank Limited | 145.95 | 92.59% | 7.23% | 0.18% | 0.68 | 78.50% |
| 22 | Yes Bank Ltd. | 123.36 | 94.10% | 5.85% | 0.05% | 0.31 | 82.90% |
| 23 | Karnataka Bank | 113.52 | 92.56% | 7.17% | 0.27% | 0.48 | 79.11% |
| 24 | IDFC First Bank Ltd | 87.50 | 93.27% | 6.62% | 0.11% | 0.36 | 70.12% |
| 25 | Karur Vysya Bank | 71.96 | 93.18% | 6.38% | 0.44% | 0.28 | 89.14% |
| 26 | The Jammu & Kashmir Bank Limited | 68.27 | 89.99% | 4.67% | 5.34% | 0.74 | 31.87% |
| 27 | Bandhan Bank limited | 63.78 | 93.27% | 5.64% | 1.10% | 0.26 | 96.54% |
| 28 | The South Indian Bank Limited | 56.93 | 94.92% | 5.06% | 0.02% | 0.23 | 81.02% |
| 29 | Tri O Tech Solutions Private Limited | 52.10 | 99.80% | 0.20% | 0.00% | - | #N/A |
| 30 | AU Small Finance Bank | 48.46 | 93.76% | 6.23% | 0.02% | 0.18 | 93.22% |
| 31 | Ujjivan Small Finance Bank Limited | 45.78 | 94.02% | 5.70% | 0.28% | 0.28 | 59.89% |
| 32 | City Union Bank | 43.40 | 92.80% | 6.94% | 0.26% | 0.12 | 90.14% |
| 33 | Punjab and Sind Bank | 40.75 | 91.88% | 7.60% | 0.52% | 0.24 | 83.76% |
| 34 | Tamilnad Mercantile Bank Limited | 40.33 | 91.64% | 8.16% | 0.20% | 0.23 | 57.68% |
| 35 | Equitas Small Finance Bank Ltd | 33.37 | 91.72% | 7.51% | 0.77% | 0.15 | 81.82% |
| 36 | Kerala Gramin Bank | 31.93 | 92.26% | 5.89% | 1.85% | 0.31 | 83.44% |
| 37 | Karnataka Gramin Bank (Erstwhile Pragathi Krishna Gramin Bank) | 28.68 | 89.64% | 7.23% | 3.13% | 0.42 | 73.14% |
| 38 | Andhra Pradesh Grameena Vikas Bank - IMPS | 27.69 | 85.15% | 11.47% | 3.38% | 0.13 | 69.04% |
| 39 | DBS Bank India Limited | 27.67 | 93.99% | 5.98% | 0.03% | 0.08 | 95.30% |
| 40 | Rajasthan Marudhara Gramin Bank | 25.58 | 79.63% | 9.90% | 10.47% | 0.35 | 26.42% |
| 41 | Maharashtra Gramin Bank | 25.52 | 78.50% | 10.43% | 11.07% | 0.18 | 33.96% |
| 42 | Standard Chartered Bank | 25.11 | 97.04% | 2.95% | 0.01% | 0.07 | 93.06% |
| 43 | ESAF Small Finance Bank Ltd. | 24.06 | 94.84% | 4.94% | 0.22% | 0.08 | 93.14% |
| 44 | Saraswat Co-operative Bank | 23.62 | 94.54% | 5.13% | 0.33% | 0.12 | 63.03% |
| 45 | Baroda U.P. Bank (Erstwhile Baroda Uttar Pradesh Gramin Bank) | 23.44 | 84.61% | 9.14% | 6.25% | 0.58 | 18.67% |
| 46 | AU Small Finance Bank (Erstwhile Fincare) | 20.27 | 85.18% | 14.37% | 0.45% | 0.08 | 91.52% |
| 47 | Sarva Haryana Gramin Bank | 20.25 | 90.64% | 8.39% | 0.96% | 0.14 | 64.20% |
| 48 | Jio Payments Bank limited | 18.37 | 84.71% | 13.55% | 1.75% | 0.21 | 94.31% |
| 49 | Andhra Pragathi Grameena Bank | 17.96 | 79.80% | 12.21% | 7.99% | 0.08 | 60.11% |
| 50 | RBL Bank Ltd. | 17.66 | 90.29% | 8.87% | 0.84% | 0.10 | 60.52% |
| UPI Beneficiary Banks - Top 50 Banks (Jul'24) | |||||||
|---|---|---|---|---|---|---|---|
| Sr.No. | UPI Beneficiary Banks (Jul-2024) | Total Volume (In Mn) | Approved % | BD% | TD% | Deemed Approved % | |
| 1 | Yes Bank Ltd. | 5,731.24 | 99.93% | 0.01% | 0.06% | 0.01% | |
| 2 | State Bank Of India | 1,591.84 | 99.66% | 0.11% | 0.23% | 0.04% | |
| 3 | Axis bank Ltd. | 1,364.34 | 99.91% | 0.09% | 0.00% | 0.01% | |
| 4 | HDFC Bank Ltd. | 690.05 | 98.78% | 0.98% | 0.23% | 0.03% | |
| 5 | ICICI Bank Ltd. | 604.23 | 99.40% | 0.51% | 0.09% | 0.03% | |
| 6 | Bank of Baroda | 455.61 | 99.44% | 0.09% | 0.47% | 0.47% | |
| 7 | Federal Bank Ltd. | 396.82 | 99.66% | 0.25% | 0.09% | 0.00% | |
| 8 | Union Bank Of India | 368.24 | 99.59% | 0.12% | 0.29% | 0.08% | |
| 9 | Punjab national Bank | 334.33 | 99.53% | 0.30% | 0.18% | 0.23% | |
| 10 | Canara Bank | 326.46 | 98.95% | 0.83% | 0.21% | 0.17% | |
| 11 | Kotak Mahindra Bank Ltd | 284.52 | 99.33% | 0.31% | 0.36% | 0.18% | |
| 12 | Airtel Payments Bank Ltd | 267.22 | 99.25% | 0.34% | 0.41% | 0.05% | |
| 13 | Indian Bank | 247.02 | 99.12% | 0.74% | 0.13% | 0.16% | |
| 14 | Bank Of India | 212.52 | 98.47% | 0.71% | 0.82% | 0.56% | |
| 15 | India Post Payments Bank Ltd | 145.20 | 98.01% | 0.28% | 1.71% | 0.18% | |
| 16 | Indusind Bank Ltd. | 131.62 | 99.35% | 0.43% | 0.22% | 0.04% | |
| 17 | Indian Overseas Bank | 102.09 | 98.59% | 1.13% | 0.28% | 0.23% | |
| 18 | Central Bank of India | 100.29 | 97.86% | 1.86% | 0.28% | 0.12% | |
| 19 | UCO Bank | 90.28 | 98.56% | 0.73% | 0.71% | 0.19% | |
| 20 | Fino Payments Bank Ltd. | 76.94 | 96.50% | 3.07% | 0.43% | 0.04% | |
| 21 | IDBI Bank Ltd. | 69.43 | 99.22% | 0.35% | 0.43% | 0.16% | |
| 22 | Bank of Maharashtra | 64.74 | 98.40% | 0.39% | 1.21% | 0.32% | |
| 23 | RBL Bank Ltd. | 51.19 | 98.83% | 0.58% | 0.59% | 0.15% | |
| 24 | Karnataka Bank Ltd | 50.14 | 98.72% | 0.86% | 0.41% | 0.08% | |
| 25 | One Mobikwik Systems Pvt - Ltd | 40.24 | 99.90% | 0.03% | 0.07% | 0.00% | |
| 26 | Karur Vysya Bank | 39.80 | 98.72% | 1.05% | 0.24% | 0.08% | |
| 27 | IDFC First Bank Ltd | 38.86 | 98.58% | 1.28% | 0.14% | 0.05% | |
| 28 | Bandhan Bank Ltd. | 37.36 | 98.39% | 0.36% | 1.25% | 0.03% | |
| 29 | Jammu and Kashmir Bank | 36.14 | 96.47% | 0.28% | 3.25% | 0.50% | |
| 30 | South Indian Bank | 35.99 | 98.76% | 0.96% | 0.27% | 0.06% | |
| 31 | AU small Finance Bank | 27.37 | 99.10% | 0.82% | 0.08% | 0.03% | |
| 32 | Tamilnad Mercantile Bank | 27.15 | 99.27% | 0.10% | 0.63% | 0.15% | |
| 33 | Tri O Tech Solutions Private Ltd. | 25.53 | 96.21% | 3.75% | 0.03% | 0.00% | |
| 34 | City Union Bank | 22.90 | 98.08% | 1.61% | 0.31% | 0.05% | |
| 35 | Ujjivan Small Finance Bank | 22.88 | 98.57% | 0.70% | 0.74% | 0.29% | |
| 36 | Punjab and Sind Bank | 18.60 | 99.20% | 0.25% | 0.55% | 0.09% | |
| 37 | CITI Bank | 17.74 | 97.85% | 1.49% | 0.66% | 0.13% | |
| 38 | KERALA GRAMIN BANK | 17.02 | 97.75% | 0.85% | 1.39% | 0.57% | |
| 39 | Cosmos Bank | 15.36 | 98.92% | 0.16% | 0.92% | 0.09% | |
| 40 | Equitas Small Finance Bank Ltd | 14.09 | 97.83% | 1.65% | 0.52% | 0.08% | |
| 41 | Karnataka Gramin Bank (Erstwhile Pragathi Krishna Gramin Bank) | 13.72 | 97.20% | 0.91% | 1.89% | 1.07% | |
| 42 | Andhra Pradesh Grameena Vikas Bank | 13.16 | 95.15% | 0.70% | 4.14% | 0.10% | |
| 43 | Maharashtra Gramin Bank | 12.26 | 85.13% | 0.18% | 14.68% | 0.49% | |
| 44 | Baroda Uttar Pradesh Gramin Bank | 11.74 | 94.84% | 0.30% | 4.86% | 1.72% | |
| 45 | JIO PAYMENTS BANK LTD | 11.60 | 98.37% | 0.83% | 0.80% | 0.23% | |
| 46 | Rajasthan Marudhara Gramin Bank | 11.60 | 87.43% | 0.42% | 12.15% | 0.69% | |
| 47 | ESAF Small Finance Bank Ltd. | 11.35 | 98.70% | 1.06% | 0.25% | 0.15% | |
| 48 | DBS Bank India Ltd. | 10.79 | 98.42% | 1.33% | 0.24% | 0.01% | |
| 49 | Andhra Pragathi Grameena Bank | 9.58 | 87.24% | 0.39% | 12.37% | 0.08% | |
| 50 | Fincare Small Finance Bank Ltd | 9.16 | 95.02% | 4.32% | 0.65% | 0.02% | |
| UPI Apps (Jul'24) | |||||||||
|---|---|---|---|---|---|---|---|---|---|
| Sr.No. | Application Name | Customer Initiated Transactions | B2C Transactions | B2B Transactions | Total | ||||
| Volume (Mn) | Value (Cr) | Volume (Mn) | Value (Cr) | Volume (Mn) | Value (Cr) | Volume (Mn) | Value (Cr) | ||
| 1 | PhonePe # | 6983.97 | 1028799.39 | 0.00 | 0.00 | 0.00 | 0.00 | 6983.97 | 1028799.39 |
| 2 | Google Pay # | 5341.23 | 735159.20 | 0.00 | 0.00 | 0.00 | 0.00 | 5341.23 | 735159.20 |
| 3 | Paytm (OCL ) # | 1128.97 | 123467.32 | 0.00 | 0.00 | 0.00 | 0.00 | 1128.97 | 123467.33 |
| 4 | Cred # | 142.56 | 48998.89 | 0.00 | 0.00 | 0.00 | 0.00 | 142.56 | 48998.89 |
| 5 | Axis Bank Apps | 15.45 | 3943.51 | 93.11 | 2389.15 | 0.01 | 2.40 | 108.57 | 6335.06 |
| 6 | Amazon Pay # | 72.41 | 7995.92 | 0.00 | 0.00 | 0.00 | 0.00 | 72.41 | 7995.92 |
| 7 | Navi # | 68.47 | 3574.61 | 0.00 | 0.00 | 0.00 | 0.00 | 68.47 | 3574.61 |
| 8 | ICICI Bank Apps | 42.13 | 17883.79 | 3.46 | 405.17 | 7.32 | 10240.43 | 52.91 | 28529.39 |
| 9 | Fampay by Trio # | 52.04 | 639.44 | 0.00 | 0.00 | 0.00 | 0.00 | 52.04 | 639.44 |
| 10 | Kotak Mahindra Bank Apps | 44.80 | 6488.28 | 0.00 | 0.00 | 0.00 | 0.00 | 44.80 | 6488.28 |
| 11 | WhatsApp # | 41.39 | 3215.18 | 0.00 | 0.00 | 0.00 | 0.00 | 41.39 | 3215.18 |
| 12 | HDFC Bank Apps | 35.25 | 8747.15 | 0.02 | 0.07 | 0.00 | 0.28 | 35.28 | 8747.50 |
| 13 | BHIM | 24.64 | 8756.73 | 0.00 | 0.00 | 0.00 | 0.00 | 24.64 | 8756.73 |
| 14 | Yes Bank Apps | 23.81 | 9556.22 | 0.00 | 0.00 | 0.27 | 26.99 | 24.08 | 9583.20 |
| 15 | Airtel Payments Bank Apps | 16.63 | 1210.03 | 0.00 | 0.00 | 0.85 | 0.29 | 17.48 | 1210.32 |
| 16 | Groww # | 15.18 | 12129.34 | 0.00 | 0.00 | 0.00 | 0.00 | 15.18 | 12129.34 |
| 17 | Bajaj Finserv # | 9.90 | 2309.58 | 0.00 | 0.00 | 0.00 | 0.00 | 9.90 | 2309.58 |
| 18 | Slice # | 9.41 | 708.27 | 0.00 | 0.00 | 0.00 | 0.00 | 9.41 | 708.27 |
| 19 | Mobikwik # | 9.11 | 2431.73 | 0.00 | 0.00 | 0.00 | 0.00 | 9.11 | 2431.73 |
| 20 | State Bank of India Apps | 8.06 | 2691.74 | 0.00 | 0.00 | 0.00 | 0.00 | 8.06 | 2691.74 |
| 21 | IDFC Bank Apps | 7.63 | 1725.98 | 0.00 | 0.00 | 0.00 | 0.00 | 7.63 | 1725.98 |
| 22 | Flipkart UPI # | 7.12 | 422.36 | 0.00 | 0.00 | 0.00 | 0.00 | 7.12 | 422.36 |
| 23 | Samsung Pay # | 6.60 | 558.51 | 0.00 | 0.00 | 0.00 | 0.00 | 6.60 | 558.51 |
| 24 | India Post Payments Bank Apps | 6.43 | 826.31 | 0.00 | 0.00 | 0.00 | 0.00 | 6.43 | 826.31 |
| 25 | Federal Bank Apps | 5.95 | 848.66 | 0.00 | 0.00 | 0.00 | 0.00 | 5.95 | 848.66 |
| 26 | Jupiter Money # | 5.76 | 781.04 | 0.00 | 0.00 | 0.00 | 0.00 | 5.76 | 781.04 |
| 27 | Canara Bank Apps | 3.04 | 834.74 | 0.00 | 0.00 | 0.00 | 0.00 | 3.04 | 834.74 |
| 28 | Federal Bank Apps | 2.68 | 460.69 | 0.00 | 0.00 | 0.00 | 0.00 | 2.68 | 460.69 |
| 29 | Jio Payments Bank Apps | 2.53 | 199.65 | 0.00 | 0.00 | 0.00 | 0.00 | 2.53 | 199.65 |
| 30 | super.money # | 2.50 | 75.70 | 0.00 | 0.00 | 0.00 | 0.00 | 2.50 | 75.70 |
| 31 | Deutsche Bank Apps | 2.43 | 344.47 | 0.00 | 0.00 | 0.00 | 0.06 | 2.44 | 344.53 |
| 32 | Timepay # | 2.16 | 20.43 | 0.00 | 0.00 | 0.00 | 0.08 | 2.16 | 20.52 |
| 33 | Punjab National Bank Apps | 2.15 | 563.99 | 0.00 | 0.00 | 0.00 | 0.00 | 2.15 | 563.99 |
| 34 | Indian Bank Apps | 1.95 | 342.38 | 0.00 | 0.00 | 0.00 | 2.45 | 1.95 | 344.83 |
| 35 | RBL Bank Apps | 1.41 | 336.63 | 0.00 | 0.00 | 0.05 | 18.14 | 1.46 | 354.77 |
| 36 | Union Bank Apps | 1.28 | 530.92 | 0.00 | 0.00 | 0.00 | 0.00 | 1.28 | 530.92 |
| 37 | Omnicard # | 1.20 | 54.57 | 0.00 | 0.00 | 0.00 | 0.00 | 1.20 | 54.57 |
| 38 | Bank of Baroda Apps | 1.07 | 477.60 | 0.00 | 0.00 | 0.00 | 0.39 | 1.07 | 477.99 |
| 39 | Jammu and Kashmir Bank Apps | 0.87 | 111.92 | 0.00 | 0.00 | 0.00 | 0.00 | 0.87 | 111.92 |
| 40 | Central Bank of India Apps | 0.83 | 180.98 | 0.00 | 0.00 | 0.00 | 0.00 | 0.83 | 180.98 |
| 41 | AU Small Finance Bank Apps | 0.66 | 202.05 | 0.00 | 0.00 | 0.00 | 0.00 | 0.66 | 202.05 |
| 42 | South Indian Bank Apps | 0.56 | 159.32 | 0.00 | 0.00 | 0.00 | 0.00 | 0.56 | 159.32 |
| 43 | DBS Digibank Apps | 0.52 | 205.42 | 0.00 | 0.00 | 0.00 | 0.61 | 0.53 | 206.03 |
| 44 | POPClub# | 0.45 | 34.71 | 0.00 | 0.00 | 0.00 | 0.00 | 0.45 | 34.71 |
| 45 | Fino Payments bank Apps | 0.44 | 58.11 | 0.00 | 0.00 | 0.00 | 0.00 | 0.44 | 58.11 |
| 46 | HSBC Bank Apps | 0.44 | 152.09 | 0.00 | 0.05 | 0.00 | 0.00 | 0.44 | 152.15 |
| 47 | IndusInd Bank Apps | 0.37 | 99.64 | 0.00 | 0.00 | 0.01 | 1.48 | 0.38 | 101.12 |
| 48 | Shri Ram One # | 0.30 | 35.64 | 0.00 | 0.00 | 0.00 | 0.00 | 0.30 | 35.64 |
| 49 | Digikhata # | 0.26 | 83.11 | 0.00 | 0.00 | 0.00 | 0.00 | 0.26 | 83.11 |
| 50 | UCO Bank Apps | 0.24 | 69.95 | 0.00 | 0.00 | 0.00 | 0.00 | 0.24 | 69.95 |
| 51 | Karnataka Bank Apps | 0.19 | 39.14 | 0.00 | 0.00 | 0.00 | 0.00 | 0.19 | 39.14 |
| 52 | Standard Chartered Bank Apps | 0.17 | 116.68 | 0.00 | 0.00 | 0.00 | 0.04 | 0.17 | 116.72 |
| 53 | TataNeu # | 0.17 | 26.16 | 0.00 | 0.00 | 0.00 | 0.00 | 0.17 | 26.16 |
| 54 | Indian Overseas Bank Apps | 0.15 | 45.13 | 0.00 | 0.00 | 0.00 | 0.00 | 0.15 | 45.13 |
| 55 | Kiwi | 0.15 | 30.35 | 0.00 | 0.00 | 0.00 | 0.00 | 0.15 | 30.35 |
| 56 | Suryoday Bank Apps | 0.13 | 0.03 | 0.00 | 0.00 | 0.00 | 0.00 | 0.13 | 0.03 |
| 57 | Dhani # | 0.11 | 15.91 | 0.00 | 0.00 | 0.00 | 0.00 | 0.11 | 15.91 |
| 58 | Ultracash # | 0.10 | 7.35 | 0.00 | 0.00 | 0.00 | 0.00 | 0.10 | 7.35 |
| 59 | Bank of India Apps | 0.08 | 20.12 | 0.00 | 0.00 | 0.00 | 0.00 | 0.08 | 20.12 |
| 60 | Tamilnad Mercantile Bank Apps | 0.08 | 24.19 | 0.00 | 0.00 | 0.00 | 0.00 | 0.08 | 24.19 |
| 61 | City Union Bank Apps | 0.08 | 28.82 | 0.00 | 0.00 | 0.00 | 0.00 | 0.08 | 28.82 |
| 62 | IDBI Bank Apps | 0.08 | 32.92 | 0.00 | 0.00 | 0.00 | 0.00 | 0.08 | 32.92 |
| 63 | Aditya Birla Capital Digital Limited | 0.08 | 3.70 | 0.00 | 0.00 | 0.00 | 0.00 | 0.08 | 3.70 |
| 64 | NSDL Payments Bank Apps | 0.07 | 10.63 | 0.00 | 0.00 | 0.00 | 0.00 | 0.07 | 10.63 |
| 65 | Citi Bank Apps | 0.06 | 33.95 | 0.00 | 0.00 | 0.01 | 0.59 | 0.07 | 34.54 |
| 66 | Bank of Maharashtra Apps | 0.06 | 13.25 | 0.00 | 0.00 | 0.00 | 0.02 | 0.06 | 13.27 |
| 67 | Niyo Global # | 0.06 | 28.59 | 0.00 | 0.00 | 0.00 | 0.00 | 0.06 | 28.59 |
| 68 | Karur Vysya Bank Apps | 0.06 | 20.69 | 0.00 | 0.00 | 0.00 | 0.00 | 0.06 | 20.69 |
| 69 | Rapi Pay # | 0.04 | 5.95 | 0.00 | 0.00 | 0.00 | 0.00 | 0.04 | 5.95 |
| 70 | Equitas Small Finance Bank Apps | 0.04 | 28.20 | 0.00 | 0.00 | 0.00 | 0.00 | 0.04 | 28.20 |
| 71 | Punjab Sind Bank Apps | 0.03 | 14.96 | 0.00 | 0.00 | 0.00 | 0.00 | 0.03 | 14.96 |
| 72 | Allahabad Bank Apps | 0.02 | 5.19 | 0.00 | 0.00 | 0.00 | 0.00 | 0.02 | 5.19 |
| 73 | Other Apps | 1.34 | 191.87 | 0.00 | 0.08 | 0.15 | 3.99 | 1.48 | 195.85 |
Note:-
| UPI P2P and P2M Transactions | ||||||
|---|---|---|---|---|---|---|
| Month | Total | P2P | P2M | |||
| Volume (Mn) | Value (Cr) | Volume (Mn) | Value (Cr) | Volume (Mn) | Value (Cr) | |
| Jul'24 | 14,435.55 | 20,64,292.40 | 5,435.96 | 14,71,369.99 | 8,999.59 | 5,92,922.41 |


| UPI Payer PSP Performance (July'24) | |||||
|---|---|---|---|---|---|
| Sr. No. | Payer PSP | Total Volume (In Mn) | Approved % | BD % | TD % |
| 1 | Yes bank Ltd. | 5,164.19 | 92.02% | 7.86% | 0.12% |
| 2 | AXIS Bank Ltd. | 4,393.74 | 93.86% | 6.01% | 0.13% |
| 3 | ICICI Bank Ltd. | 2,762.62 | 93.29% | 6.58% | 0.13% |
| 4 | State Bank of India | 1,521.58 | 95.47% | 4.40% | 0.13% |
| 5 | HDFC Bank Ltd. | 1,394.09 | 94.81% | 5.08% | 0.11% |
| 6 | Tri O Tech Solutions Private Limited | 52.00 | 100.00% | 0.00% | 0.00% |
| 7 | Kotak Mahindra Bank Ltd | 45.05 | 100.00% | 0.00% | 0.00% |
| 8 | BHIM | 29.02 | 93.13% | 6.72% | 0.16% |
| 9 | Airtel Payments Bank Ltd | 17.37 | 95.73% | 4.20% | 0.07% |
| 10 | RBL Bank Ltd. | 8.95 | 94.86% | 5.00% | 0.14% |
| 11 | IDFC First Bank | 8.16 | 99.41% | 0.59% | 0.00% |
| 12 | India Post Payments Bank Ltd | 6.43 | 99.98% | 0.02% | 0.00% |
| 13 | Federal Bank Ltd. | 6.10 | 98.00% | 1.98% | 0.02% |
| 14 | One Mobikwik Systems Pvt - Ltd | 4.40 | 100.00% | 0.00% | 0.00% |
| 15 | Garagepreneurs Internet Private Limited | 4.37 | 100.00% | 0.00% | 0.00% |
| UPI Payee PSP Performance (July'24) | |||||
|---|---|---|---|---|---|
| Sr. No. | Payee PSP | Total Volume (In Mn) | Approved % | BD % | TD % |
| 1 | Yes bank Ltd. | 8,202.97 | 92.89% | 6.99% | 0.12% |
| 2 | AXIS Bank Ltd. | 2,586.30 | 94.23% | 5.65% | 0.13% |
| 3 | ICICI Bank Ltd. | 1,521.57 | 93.37% | 6.51% | 0.12% |
| 4 | State Bank of India | 848.08 | 94.39% | 5.49% | 0.11% |
| 5 | HDFC Bank Ltd. | 838.86 | 94.10% | 5.79% | 0.11% |
| 6 | Federal Bank Ltd. | 328.61 | 96.84% | 3.04% | 0.11% |
| 7 | THE COSMOS CO-OPERATIVE BANK LTD | 130.34 | 89.26% | 10.56% | 0.18% |
| 8 | Indusind Bank Ltd. | 81.05 | 93.85% | 6.02% | 0.13% |
| 9 | Airtel Payments Bank Ltd | 68.42 | 94.48% | 5.41% | 0.12% |
| 10 | Canara Bank | 57.74 | 95.86% | 4.03% | 0.11% |
| 11 | RBL Bank Ltd. | 50.12 | 93.29% | 6.55% | 0.16% |
| 12 | One Mobikwik Systems Pvt - Ltd | 41.71 | 96.38% | 3.51% | 0.12% |
| 13 | Kotak Mahindra Bank Ltd | 38.70 | 95.27% | 4.63% | 0.10% |
| 14 | Bank Of India IBM | 22.13 | 94.51% | 5.29% | 0.20% |
| 15 | Indian Bank | 32.80 | 92.79% | 7.06% | 0.15% |
| UPI Merchant Category-wise Classification - July'24 (Arranged by Volume) | ||||
|---|---|---|---|---|
| Type | MCC | Description | Volume (in Mn) | Value (in Cr.) |
| High Transacting Categories | 5411 | Groceries and supermarkets | 1,957.33 | 45,998.27 |
| 5814 | Fast food restaurants | 927.39 | 11,237.77 | |
| 5812 | Eating places and restaurants | 816.06 | 13,050.80 | |
| 4814 | Telecommunication services, including local and long distance calls, credit card calls, calls through use of magnetic stripe reading telephones and faxes | 769.28 | 17,373.49 | |
| 5541 | Service stations (with or without ancillary services) | 447.69 | 26,389.25 | |
| 5816 | Digital Goods: Games | 363.28 | 13,693.28 | |
| 5912 | Drug stores and pharmacies | 215.93 | 8,380.91 | |
| 5462 | Bakeries | 196.34 | 2,776.43 | |
| 5311 | Department stores | 181.52 | 3,941.66 | |
| 4900 | Utilities electric, gas, water and sanitary | 152.03 | 20,875.43 | |
| Medium Transacting Categories | 5451 | Dairies | 126.64 | 2,996.73 |
| 7322 | Debt collection agencies | 106.87 | 76,285.03 | |
| 5813 | Drinking places (alcoholic beverages) bars, taverns, night-clubs, cocktail lounges and discothques | 84.36 | 3,167.07 | |
| 5441 | Candy, nut and confectionery shops | 76.69 | 1,328.03 | |
| 6211 | Securities brokers and dealers | 70.83 | 73,841.65 | |
| 5422 | Freezer and locker meat provisioners | 69.27 | 2,216.40 | |
| 5921 | Package shops beer, wine and liquor | 68.48 | 2,843.87 | |
| 5993 | Cigar shops and stands | 66.38 | 493.56 | |
| 5262 | Online Marketplaces | 65.63 | 6,326.63 | |
| 7622 | Electronics repair shops | 64.70 | 2,060.64 | |
| All Other Categories | 9399 | Government services not elsewhere classified | 61.21 | 8,595.49 |
| 5732 | Electronics shops | 57.34 | 7,664.93 | |
| 7230 | Beauty and barber shops | 55.50 | 1,644.13 | |
| 5137 | Mens, womens and childrens uniforms and commercial clothing | 54.34 | 4,749.98 | |
| 4112 | Passenger railways | 53.97 | 3,343.85 | |
| 5331 | Variety stores | 47.96 | 2,572.62 | |
| 4121 | Taxi-cabs and limousines | 44.65 | 985.09 | |
| 5691 | Mens and womens clothing shops | 41.66 | 4,898.23 | |
| 4812 | Telecommunication equipment and telephone sales | 40.22 | 3,222.98 | |
| Others | 1,716.03 | 2,19,968.22 | ||
| Total | 8,999.59 | 5,92,922.41 | ||
| State-wise UPI Product Statistics* (Jul'24) | |||||
|---|---|---|---|---|---|
| Sr. No. | State / Union Territory | Volume (in Mn ) | Volume Contribution (%) | Value (in Cr.) | Value Contribution (%) |
| 1 | MAHARASHTRA | 1,855.40 | 12.85% | 2,49,506.36 | 12.09% |
| 2 | KARNATAKA | 1,168.35 | 8.09% | 1,59,553.82 | 7.73% |
| 3 | UTTAR PRADESH | 997.05 | 6.91% | 1,32,974.21 | 6.44% |
| 4 | TELANGANA | 893.66 | 6.19% | 1,42,350.66 | 6.90% |
| 5 | TAMIL NADU | 677.20 | 4.69% | 1,06,563.19 | 5.16% |
| 6 | RAJASTHAN | 630.17 | 4.37% | 92,634.63 | 4.49% |
| 7 | MADHYA PRADESH | 577.98 | 4.00% | 75,482.42 | 3.66% |
| 8 | ANDHRA PRADESH | 535.67 | 3.71% | 97,187.27 | 4.71% |
| 9 | BIHAR | 481.01 | 3.33% | 70,842.67 | 3.43% |
| 10 | GUJARAT | 453.24 | 3.14% | 69,129.55 | 3.35% |
| 11 | DELHI | 452.93 | 3.14% | 56,673.15 | 2.75% |
| 12 | WEST BENGAL | 429.78 | 2.98% | 68,677.12 | 3.33% |
| 13 | HARYANA | 360.77 | 2.50% | 51,482.87 | 2.49% |
| 14 | ODISHA | 320.19 | 2.22% | 43,116.58 | 2.09% |
| 15 | KERALA | 315.38 | 2.18% | 44,478.13 | 2.15% |
| 16 | PUNJAB | 187.81 | 1.30% | 31,460.15 | 1.52% |
| 17 | ASSAM | 186.19 | 1.29% | 22,156.74 | 1.07% |
| 18 | JHARKHAND | 168.74 | 1.17% | 23,060.05 | 1.12% |
| 19 | CHHATTISGARH | 135.50 | 0.94% | 17,785.47 | 0.86% |
| 20 | UTTARAKHAND | 97.26 | 0.67% | 12,476.10 | 0.60% |
| 21 | JAMMU AND KASHMIR | 66.47 | 0.46% | 9,241.72 | 0.45% |
| 22 | HIMACHAL PRADESH | 52.82 | 0.37% | 6,898.38 | 0.33% |
| 23 | CHANDIGARH | 28.39 | 0.20% | 3,700.09 | 0.18% |
| 24 | GOA | 25.66 | 0.18% | 3,695.04 | 0.18% |
| 25 | ARUNACHAL PRADESH | 15.73 | 0.11% | 2,182.02 | 0.11% |
| 26 | PUDUCHERRY | 15.23 | 0.11% | 2,149.67 | 0.10% |
| 27 | MEGHALAYA | 11.17 | 0.08% | 1,574.17 | 0.08% |
| 28 | TRIPURA | 10.75 | 0.07% | 1,598.70 | 0.08% |
| 29 | NAGALAND | 10.11 | 0.07% | 1,738.49 | 0.08% |
| 30 | MANIPUR | 9.74 | 0.07% | 2,258.33 | 0.11% |
| 31 | DADRA & NAGAR HAVELI & DAMAN & DIU | 9.64 | 0.07% | 1,022.70 | 0.05% |
| 32 | MIZORAM | 7.21 | 0.05% | 1,298.71 | 0.06% |
| 33 | SIKKIM | 5.92 | 0.04% | 855.82 | 0.04% |
| 34 | LADAKH | 3.88 | 0.03% | 770.20 | 0.04% |
| 35 | ANDAMAN & NICOBAR | 2.99 | 0.02% | 491.70 | 0.02% |
| 36 | LAKSHADWEEP | 0.35 | 0.00% | 39.56 | 0.00% |
| 37 | UNCLASSIFIED# | 3,235.23 | 22.41% | 4,57,185.99 | 22.15% |
| UPI Remitter Members - Top 50 Members (Jun'24) | |||||||
|---|---|---|---|---|---|---|---|
| Sr. No. | UPI Remitter Members (Jun-2024) | Total Volume (In Mn) | Approved % | BD % | TD% | Total Debit Reversal Count (In Mn) | Debit Reversal Success % |
| 1 | State Bank of India | 3738.00 | 94.82% | 4.95% | 0.22% | 10.49 | 97.79% |
| 2 | HDFC Bank Ltd | 1191.85 | 95.43% | 4.34% | 0.23% | 6.03 | 36.91% |
| 3 | Bank of Baroda | 912.47 | 93.28% | 6.39% | 0.33% | 4.43 | 99.54% |
| 4 | Union Bank of India | 869.16 | 93.98% | 5.74% | 0.28% | 3.33 | 70.38% |
| 5 | Punjab National Bank | 783.70 | 93.53% | 6.07% | 0.40% | 3.12 | 76.21% |
| 6 | Kotak Mahindra Bank Ltd | 727.46 | 92.20% | 6.93% | 0.86% | 2.68 | 95.04% |
| 7 | Canara Bank | 657.78 | 92.85% | 6.43% | 0.72% | 2.57 | 97.38% |
| 8 | Axis Bank Ltd. | 651.80 | 95.59% | 4.40% | 0.02% | 1.92 | 79.47% |
| 9 | ICICI Bank Ltd | 620.66 | 96.19% | 3.76% | 0.05% | 1.67 | 80.79% |
| 10 | Bank Of India | 444.39 | 94.18% | 5.51% | 0.32% | 1.60 | 60.95% |
| 11 | Indian Bank | 423.92 | 94.06% | 5.76% | 0.19% | 1.56 | 99.57% |
| 12 | Airtel Payments Bank Ltd | 414.12 | 88.87% | 10.12% | 1.01% | 1.51 | 95.88% |
| 13 | India Post Payments Bank Ltd | 319.04 | 85.95% | 12.05% | 2.00% | 1.44 | 71.65% |
| 14 | Federal Bank | 205.99 | 94.34% | 5.61% | 0.06% | 1.25 | 93.66% |
| 15 | Central Bank of India | 202.35 | 86.99% | 11.27% | 1.74% | 1.00 | 13.58% |
| 16 | Indian Overseas Bank | 197.11 | 92.98% | 5.54% | 1.48% | 0.86 | 98.72% |
| 17 | UCO Bank | 184.42 | 93.38% | 6.35% | 0.27% | 0.84 | 65.10% |
| 18 | IDBI Bank | 155.97 | 94.24% | 5.25% | 0.51% | 0.78 | 78.29% |
| 19 | Indusind Bank Ltd. | 155.09 | 91.86% | 7.68% | 0.46% | 0.73 | 77.15% |
| 20 | Bank of Maharashtra | 150.89 | 93.21% | 5.77% | 1.01% | 0.71 | 64.69% |
| 21 | Fino Payments Bank Ltd. | 140.81 | 92.49% | 7.16% | 0.36% | 0.67 | 67.82% |
| 22 | Yes bank Ltd. | 118.94 | 94.04% | 5.79% | 0.17% | 0.56 | 98.82% |
| 23 | Karnataka Bank Ltd | 108.50 | 93.12% | 6.42% | 0.46% | 0.50 | 35.88% |
| 24 | IDFC Bank Ltd. | 85.74 | 93.06% | 6.88% | 0.06% | 0.44 | 68.83% |
| 25 | Karur Vysya Bank | 67.93 | 93.39% | 6.14% | 0.47% | 0.40 | 77.80% |
| 26 | The Jammu And Kashmir Bank Ltd | 65.45 | 93.49% | 4.86% | 1.66% | 0.38 | 54.07% |
| 27 | Bandhan Bank Ltd. | 59.26 | 92.99% | 6.11% | 0.90% | 0.31 | 4.32% |
| 28 | South Indian Bank | 54.24 | 94.99% | 4.95% | 0.06% | 0.31 | 77.20% |
| 29 | Tri O Tech Solutions Private Limited | 50.77 | 100.00% | 0.00% | 0.00% | 0.31 | 17.47% |
| 30 | AU Small Finance Bank | 46.74 | 93.96% | 6.01% | 0.02% | 0.26 | 90.09% |
| 31 | Ujjivan Small Finance Bank Limited | 44.18 | 94.17% | 5.60% | 0.23% | 0.25 | 20.25% |
| 32 | City Union Bank Limited | 40.87 | 93.05% | 6.69% | 0.26% | 0.24 | 82.70% |
| 33 | Punjab & Sind Bank | 38.32 | 92.27% | 7.46% | 0.27% | 0.22 | 89.99% |
| 34 | Tamilnad Mercantile Bank Ltd. | 38.20 | 91.39% | 7.44% | 1.17% | 0.21 | 97.95% |
| 35 | Equitas Small Finance Bank Ltd | 32.46 | 92.00% | 7.29% | 0.71% | 0.21 | 76.89% |
| 36 | HDFC Bank Credit Card HCB | 31.15 | 95.19% | 4.66% | 0.15% | 0.21 | 23.54% |
| 37 | Andhra Pradesh Grameena Vikas Bank | 29.53 | 85.51% | 12.21% | 2.28% | 0.20 | 99.07% |
| 38 | Kerala Gramin Bank | 29.43 | 93.72% | 5.54% | 0.74% | 0.17 | 90.78% |
| 39 | Pragathi Krishna Gramin Bank | 26.98 | 91.24% | 6.93% | 1.83% | 0.17 | 72.82% |
| 40 | DBS Bank India Limited | 26.61 | 94.23% | 5.72% | 0.05% | 0.17 | 58.21% |
| 41 | Rajasthan Marudhara Gramin Bank | 25.44 | 86.22% | 11.56% | 2.22% | 0.17 | 58.42% |
| 42 | Maharashtra Gramin Bank | 25.16 | 86.97% | 11.42% | 1.61% | 0.17 | 44.72% |
| 43 | Standard Chartered Bank | 24.97 | 96.93% | 2.90% | 0.17% | 0.16 | 90.27% |
| 44 | Baroda Uttar Pradesh Gramin Bank | 24.09 | 74.58% | 10.00% | 15.42% | 0.15 | 88.69% |
| 45 | Saraswat Co-operative Bank Ltd. | 23.45 | 94.86% | 4.71% | 0.43% | 0.15 | 96.25% |
| 46 | ESAF Small Finance Bank Ltd. | 22.93 | 95.04% | 4.76% | 0.20% | 0.14 | 67.14% |
| 47 | Fincare Small Finance Bank Limited | 20.56 | 85.12% | 14.38% | 0.51% | 0.13 | 9.53% |
| 48 | Sarva Haryana Gramin Bank | 19.34 | 89.85% | 7.83% | 2.32% | 0.13 | 96.24% |
| 49 | Andhra Pragathi Grameena Bank | 18.35 | 80.76% | 12.96% | 6.28% | 0.13 | 99.61% |
| 50 | Jio Payments Bank limited | 16.80 | 84.80% | 11.61% | 3.59% | 0.11 | 47.65% |
| UPI Beneficiary Members - Top 50 Members (Jun'24) | |||||||
|---|---|---|---|---|---|---|---|
| Sr.No. | UPI Beneficiary Members (Jun-2024) | Total Volume (In Mn) | Approved % | BD% | TD% | Deemed Approved % | |
| 1 | Yes Bank Ltd. | 5523.03 | 99.98% | 0.02% | 0.00% | 0.00% | |
| 2 | State Bank Of India | 1549.25 | 99.76% | 0.10% | 0.14% | 0.05% | |
| 3 | Axis Bank Ltd. | 1025.59 | 99.88% | 0.12% | 0.00% | 0.02% | |
| 4 | HDFC Bank Ltd. | 653.68 | 98.79% | 1.06% | 0.15% | 0.05% | |
| 5 | ICICI Bank Ltd. | 624.60 | 99.50% | 0.48% | 0.02% | 0.02% | |
| 6 | Bank of Baroda | 400.13 | 99.78% | 0.08% | 0.14% | 0.17% | |
| 7 | Federal Bank | 383.40 | 99.75% | 0.23% | 0.03% | 0.00% | |
| 8 | Union Bank of India | 351.85 | 99.72% | 0.11% | 0.17% | 0.10% | |
| 9 | Punjab National Bank | 324.58 | 99.40% | 0.27% | 0.34% | 0.11% | |
| 10 | Canara Bank | 301.47 | 98.70% | 0.94% | 0.36% | 0.15% | |
| 11 | Kotak Mahindra Bank Ltd | 275.04 | 99.39% | 0.30% | 0.31% | 0.29% | |
| 12 | Airtel Payments Bank Ltd | 251.18 | 98.94% | 0.34% | 0.72% | 0.15% | |
| 13 | Indian Bank | 224.43 | 99.08% | 0.73% | 0.19% | 0.24% | |
| 14 | Bank of India | 202.39 | 99.03% | 0.74% | 0.23% | 0.19% | |
| 15 | India Post Payments Bank Ltd | 137.69 | 98.92% | 0.28% | 0.80% | 0.17% | |
| 16 | IndusInd Bank Ltd. | 124.07 | 99.11% | 0.53% | 0.37% | 0.26% | |
| 17 | Central Bank Of India | 93.75 | 97.52% | 1.46% | 1.02% | 0.37% | |
| 18 | Indian Overseas Bank | 93.03 | 98.65% | 0.52% | 0.82% | 0.38% | |
| 19 | UCO Bank | 87.05 | 99.14% | 0.66% | 0.20% | 0.10% | |
| 20 | Fino Payments Bank Ltd. | 73.74 | 96.29% | 3.29% | 0.43% | 0.07% | |
| 21 | IDBI Bank Ltd. | 66.26 | 99.24% | 0.36% | 0.40% | 0.17% | |
| 22 | Bank of Maharashtra | 60.84 | 98.97% | 0.32% | 0.71% | 0.16% | |
| 23 | Karnataka Bank Ltd | 47.71 | 98.50% | 1.13% | 0.37% | 0.11% | |
| 24 | Karur Vysya Bank | 36.29 | 98.24% | 1.11% | 0.65% | 0.07% | |
| 25 | RBL Bank Ltd. | 36.15 | 98.79% | 0.90% | 0.31% | 0.17% | |
| 26 | IDFC First Bank Ltd | 35.42 | 98.75% | 1.21% | 0.04% | 0.02% | |
| 27 | Bandhan Bank Ltd. | 35.19 | 98.64% | 0.37% | 0.99% | 0.01% | |
| 28 | One Mobikwik Systems Pvt - Ltd | 35.03 | 99.93% | 0.02% | 0.04% | 0.00% | |
| 29 | South Indian Bank | 34.18 | 98.89% | 1.08% | 0.03% | 0.01% | |
| 30 | Jammu and Kashmir Bank | 33.89 | 99.05% | 0.37% | 0.58% | 0.28% | |
| 31 | AU small Finance Bank | 26.37 | 99.00% | 0.99% | 0.01% | 0.01% | |
| 32 | Tamilnad Mercantile Bank | 25.76 | 98.76% | 0.09% | 1.15% | 0.18% | |
| 33 | Tri O Tech Solutions Private Ltd. | 25.21 | 96.49% | 3.43% | 0.09% | 0.04% | |
| 34 | Ujjivan Small Finance Bank | 22.07 | 99.11% | 0.74% | 0.15% | 0.14% | |
| 35 | City Union Bank | 21.49 | 97.81% | 2.04% | 0.15% | 0.00% | |
| 36 | Punjab and Sind Bank | 16.82 | 98.79% | 0.99% | 0.22% | 0.03% | |
| 37 | Kerala Gramin Bank | 15.64 | 98.75% | 0.89% | 0.36% | 0.24% | |
| 38 | Cosmos Bank | 15.14 | 95.46% | 0.07% | 4.47% | 0.60% | |
| 39 | Equitas Small Finance Bank Ltd | 13.81 | 97.75% | 1.34% | 0.91% | 0.17% | |
| 40 | Andhra Pradesh Grameena Vikas Bank | 13.60 | 97.85% | 0.52% | 1.63% | 0.85% | |
| 41 | Jio Payments Bank | 13.28 | 98.52% | 0.39% | 1.09% | 1.06% | |
| 42 | Pragathi Krishna Gramin Bank | 12.98 | 98.17% | 0.99% | 0.83% | 0.58% | |
| 43 | CITI bank | 11.72 | 99.93% | 0.00% | 0.07% | 0.09% | |
| 44 | Baroda Uttar Pradesh Gramin Bank | 11.70 | 87.69% | 0.64% | 11.68% | 3.82% | |
| 45 | Maharashtra Gramin Bank | 11.60 | 98.84% | 0.18% | 0.98% | 0.11% | |
| 46 | Rajasthan Marudhara Gramin Bank | 11.14 | 98.79% | 0.46% | 0.76% | 0.23% | |
| 47 | ESAF Small Finance Bank Ltd. | 10.88 | 98.50% | 1.42% | 0.08% | 0.03% | |
| 48 | DBS Bank India Ltd. | 10.36 | 98.41% | 1.44% | 0.15% | 0.02% | |
| 49 | Fincare Small Finance Bank Ltd | 9.22 | 95.48% | 4.17% | 0.35% | 0.08% | |
| 50 | Andhra Pragathi Grameena Bank | 9.05 | 95.03% | 1.16% | 3.81% | 0.12% | |
| UPI Apps (Jun'24) | |||||||||
|---|---|---|---|---|---|---|---|---|---|
| Sr.No. | Application Name | Customer Initiated Transactions | B2C Transactions | B2B Transactions | Total | ||||
| Volume (Mn) | Value (Cr) | Volume (Mn) | Value (Cr) | Volume (Mn) | Value (Cr) | Volume (Mn) | Value (Cr) | ||
| 1 | PhonePe # | 6,716.09 | 10,09,064.99 | 0.00 | 0.00 | 0.00 | 0.00 | 6,716.09 | 10,09,064.99 |
| 2 | Google Pay # | 5,103.99 | 7,07,241.27 | 0.00 | 0.00 | 0.00 | 0.00 | 5,103.99 | 7,07,241.27 |
| 3 | Paytm | 1,104.89 | 1,20,840.45 | 0.00 | 0.00 | 0.00 | 0.00 | 1,104.89 | 1,20,840.45 |
| 4 | Cred # | 138.42 | 45,720.01 | 0.00 | 0.00 | 0.00 | 0.00 | 138.42 | 45,720.01 |
| 5 | Axis Bank Apps | 14.14 | 3,852.77 | 60.92 | 2,755.96 | 0.01 | 5.30 | 75.07 | 6,614.04 |
| 6 | Amazon Pay # | 67.07 | 7,377.30 | 0.00 | 0.00 | 0.00 | 0.00 | 67.07 | 7,377.30 |
| 7 | ICICI Bank Apps | 38.25 | 16,692.52 | 4.20 | 462.22 | 9.20 | 12,841.44 | 51.65 | 29,996.18 |
| 8 | FamApp by Trio # | 50.78 | 641.36 | 0.00 | 0.00 | 0.00 | 0.00 | 50.78 | 641.36 |
| 9 | Kotak Mahindra Bank Apps | 42.65 | 6,073.08 | 0.00 | 0.00 | 0.00 | 0.00 | 42.65 | 6,073.08 |
| 10 | WhatsApp # | 37.18 | 2,923.79 | 0.00 | 0.00 | 0.00 | 0.00 | 37.18 | 2,923.79 |
| 11 | Navi # | 35.72 | 1,769.66 | 0.00 | 0.00 | 0.00 | 0.00 | 35.72 | 1,769.66 |
| 12 | HDFC Bank Apps | 34.57 | 8,166.94 | 0.03 | 0.08 | 0.00 | 0.27 | 34.60 | 8,167.30 |
| 13 | BHIM | 22.72 | 7,965.69 | 0.00 | 0.00 | 0.00 | 0.00 | 22.72 | 7,965.69 |
| 14 | Yes Bank Apps | 22.28 | 9,285.69 | 0.00 | 0.00 | 0.27 | 31.36 | 22.55 | 9,317.05 |
| 15 | Airtel Payments Bank Apps | 15.76 | 1,191.68 | 0.00 | 0.00 | 0.00 | 0.39 | 15.76 | 1,192.07 |
| 16 | Mobikwik # | 11.59 | 2,564.79 | 0.00 | 0.00 | 0.00 | 0.00 | 11.59 | 2,564.79 |
| 17 | Groww # | 11.26 | 9,094.72 | 0.00 | 0.00 | 0.00 | 0.00 | 11.26 | 9,094.72 |
| 18 | Bajaj Finserv # | 8.23 | 1,852.43 | 0.00 | 0.00 | 0.00 | 0.00 | 8.23 | 1,852.43 |
| 19 | Slice # | 7.86 | 634.47 | 0.00 | 0.00 | 0.00 | 0.00 | 7.86 | 634.47 |
| 20 | IDFC Bank Apps | 7.33 | 1,654.91 | 0.00 | 0.00 | 0.00 | 0.00 | 7.33 | 1,654.91 |
| 21 | State Bank of India Apps | 7.22 | 2,426.08 | 0.00 | 0.00 | 0.00 | 0.00 | 7.22 | 2,426.08 |
| 22 | Samsung Pay # | 6.38 | 542.12 | 0.00 | 0.00 | 0.00 | 0.00 | 6.38 | 542.12 |
| 23 | India Post Payments Bank Apps | 6.01 | 732.10 | 0.00 | 0.00 | 0.00 | 0.00 | 6.01 | 732.10 |
| 24 | Flipkart UPI # | 5.97 | 337.24 | 0.00 | 0.00 | 0.00 | 0.00 | 5.97 | 337.24 |
| 25 | Federal Bank Apps | 5.67 | 790.57 | 0.00 | 0.00 | 0.00 | 0.00 | 5.67 | 790.57 |
| 26 | Jupiter Money # | 5.63 | 750.68 | 0.00 | 0.00 | 0.00 | 0.00 | 5.63 | 750.68 |
| 27 | Canara Bank Apps | 2.88 | 793.85 | 0.00 | 0.00 | 0.00 | 0.00 | 2.88 | 793.85 |
| 28 | Jio Payments Bank Apps | 2.33 | 186.62 | 0.00 | 0.00 | 0.00 | 0.00 | 2.33 | 186.62 |
| 29 | Deutsche Bank Apps | 2.25 | 334.10 | 0.00 | 0.00 | 0.00 | 0.03 | 2.25 | 334.12 |
| 30 | Timepay # | 1.82 | 20.11 | 0.00 | 0.00 | 0.00 | 0.09 | 1.82 | 20.20 |
| 31 | Punjab National Bank Apps | 1.80 | 472.48 | 0.00 | 0.00 | 0.00 | 0.00 | 1.80 | 472.48 |
| 32 | RBL Bank Apps | 1.66 | 733.04 | 0.00 | 0.01 | 0.09 | 52.02 | 1.75 | 785.07 |
| 33 | Indian Bank Apps | 1.73 | 330.29 | 0.00 | 0.00 | 0.00 | 0.18 | 1.73 | 330.47 |
| 34 | OmniCard # | 1.28 | 53.41 | 0.00 | 0.00 | 0.00 | 0.00 | 1.28 | 53.41 |
| 35 | Union Bank Apps | 1.06 | 461.02 | 0.00 | 0.00 | 0.00 | 0.00 | 1.06 | 461.02 |
| 36 | Bank of Baroda Apps | 1.03 | 450.62 | 0.00 | 0.00 | 0.00 | 0.00 | 1.03 | 450.62 |
| 37 | Central Bank of India Apps | 0.83 | 188.63 | 0.00 | 0.00 | 0.00 | 0.00 | 0.83 | 188.63 |
| 38 | AU Small Finance Bank Apps | 0.76 | 227.63 | 0.00 | 0.00 | 0.00 | 0.00 | 0.76 | 227.63 |
| 39 | Jammu and Kashmir Bank Apps | 0.75 | 97.58 | 0.00 | 0.00 | 0.00 | 0.00 | 0.75 | 97.58 |
| 40 | DBS Digibank Apps | 0.49 | 198.19 | 0.00 | 0.00 | 0.00 | 0.49 | 0.50 | 198.68 |
| 41 | South Indian Bank Apps | 0.49 | 144.78 | 0.00 | 0.00 | 0.00 | 0.00 | 0.49 | 144.78 |
| 42 | IndusInd Bank Apps | 0.42 | 115.96 | 0.00 | 0.00 | 0.01 | 1.90 | 0.43 | 117.86 |
| 43 | Fino Payments bank Apps | 0.41 | 55.79 | 0.00 | 0.00 | 0.00 | 0.00 | 0.41 | 55.79 |
| 44 | HSBC Bank Apps | 0.40 | 148.04 | 0.00 | 0.05 | 0.00 | 0.00 | 0.40 | 148.09 |
| 45 | Shriram One # | 0.28 | 37.04 | 0.00 | 0.00 | 0.00 | 0.00 | 0.28 | 37.04 |
| 46 | UCO Bank Apps | 0.22 | 67.40 | 0.00 | 0.00 | 0.00 | 0.00 | 0.22 | 67.40 |
| 47 | Digikhata # | 0.19 | 63.31 | 0.00 | 0.00 | 0.00 | 0.00 | 0.19 | 63.31 |
| 48 | Karnataka Bank Apps | 0.18 | 33.54 | 0.00 | 0.00 | 0.00 | 0.00 | 0.18 | 33.55 |
| 49 | Standard Chartered Bank Apps | 0.17 | 117.31 | 0.00 | 0.00 | 0.00 | 0.05 | 0.17 | 117.35 |
| 50 | TataNeu # | 0.16 | 23.31 | 0.00 | 0.00 | 0.00 | 0.00 | 0.16 | 23.31 |
| 51 | Kiwi # | 0.15 | 31.43 | 0.00 | 0.00 | 0.00 | 0.00 | 0.15 | 31.43 |
| 52 | Suryoday | 0.14 | 0.02 | 0.00 | 0.00 | 0.00 | 0.00 | 0.14 | 0.02 |
| 53 | Indian Overseas Bank Apps | 0.13 | 37.62 | 0.00 | 0.00 | 0.00 | 0.00 | 0.13 | 37.62 |
| 54 | super.money # | 0.13 | 5.04 | 0.00 | 0.00 | 0.00 | 0.00 | 0.13 | 5.04 |
| 55 | Dhani | 0.11 | 13.84 | 0.00 | 0.00 | 0.00 | 0.00 | 0.11 | 13.84 |
| 56 | Bank of India Apps | 0.10 | 38.05 | 0.00 | 0.00 | 0.00 | 0.00 | 0.10 | 38.05 |
| 57 | Ultracash # | 0.09 | 6.51 | 0.00 | 0.00 | 0.00 | 0.00 | 0.09 | 6.51 |
| 58 | Tamilnad Mercantile Bank Apps | 0.08 | 26.21 | 0.00 | 0.00 | 0.00 | 0.00 | 0.08 | 26.21 |
| 59 | City Union Bank Apps | 0.08 | 28.66 | 0.00 | 0.00 | 0.00 | 0.00 | 0.08 | 28.66 |
| 60 | POPClub # | 0.07 | 4.87 | 0.00 | 0.00 | 0.00 | 0.00 | 0.07 | 4.87 |
| 61 | Citi Bank Apps | 0.06 | 70.21 | 0.00 | 0.00 | 0.00 | 0.30 | 0.07 | 70.51 |
| 62 | Aditya Birla Capital Digital # | 0.07 | 3.45 | 0.00 | 0.00 | 0.00 | 0.00 | 0.07 | 3.45 |
| 63 | IDBI Bank Apps | 0.07 | 27.06 | 0.00 | 0.00 | 0.00 | 0.00 | 0.07 | 27.06 |
| 64 | NSDL Payments Bank Apps | 0.06 | 10.09 | 0.00 | 0.00 | 0.00 | 0.00 | 0.06 | 10.09 |
| 65 | Bank of Maharashtra Apps | 0.05 | 11.11 | 0.00 | 0.00 | 0.00 | 0.00 | 0.05 | 11.11 |
| 66 | Karur Vysya Bank Apps | 0.05 | 18.73 | 0.00 | 0.00 | 0.00 | 0.00 | 0.05 | 18.73 |
| 67 | Niyo Global # | 0.05 | 24.78 | 0.00 | 0.00 | 0.00 | 0.00 | 0.05 | 24.78 |
| 68 | Equitas Small Finance Bank Apps | 0.04 | 26.25 | 0.00 | 0.00 | 0.00 | 0.00 | 0.04 | 26.25 |
| 69 | Punjab Sind Bank Apps | 0.03 | 12.38 | 0.00 | 0.00 | 0.00 | 0.00 | 0.03 | 12.38 |
| 70 | Other Apps | 1.41 | 180.43 | 0.00 | 0.00 | 0.13 | 3.67 | 1.54 | 184.11 |
Note:-
| UPI P2P and P2M Transactions | ||||||
|---|---|---|---|---|---|---|
| Month | Total | P2P | P2M | |||
| Volume (Mn) | Value (Cr) | Volume (Mn) | Value (Cr) | Volume (Mn) | Value (Cr) | |
| Jun’24 | 13,885.14 | 20,07,081.16 | 5,164.39 | 14,47,142.17 | 8,720.75 | 5,59,938.98 |


| UPI Payer PSP Performance (June'24) | |||||
|---|---|---|---|---|---|
| Sr. No. | Payer PSP | Total Volume (In Mn) | Approved % | BD % | TD % |
| 1 | Yes bank Ltd. | 5,109.48 | 92.73% | 7.12% | 0.15% |
| 2 | AXIS Bank Ltd. | 4,019.53 | 94.17% | 5.67% | 0.16% |
| 3 | ICICI Bank Ltd. | 2,681.98 | 93.75% | 6.09% | 0.16% |
| 4 | State Bank of India | 1,473.39 | 95.76% | 4.09% | 0.16% |
| 5 | HDFC Bank Ltd. | 1,303.26 | 95.19% | 4.69% | 0.12% |
| 6 | Tri O Tech Solutions Private Limited | 50.77 | 100.00% | 0.00% | 0.00% |
| 7 | Kotak Mahindra Bank Ltd | 42.91 | 100.00% | 0.00% | 0.00% |
| 8 | BHIM | 27.47 | 93.42% | 6.37% | 0.21% |
| 9 | Airtel Payments Bank Ltd | 16.38 | 96.18% | 3.74% | 0.08% |
| 10 | RBL Bank Ltd. | 8.11 | 95.44% | 4.40% | 0.16% |
| 11 | IDFC First Bank | 7.78 | 99.41% | 0.59% | 0.01% |
| 12 | India Post Payments Bank Ltd | 6.01 | 99.98% | 0.02% | 0.00% |
| 13 | Federal Bank Ltd. | 5.80 | 97.94% | 2.04% | 0.02% |
| 14 | One Mobikwik Systems Pvt - Ltd | 3.62 | 100.00% | 0.00% | 0.00% |
| 15 | Garagepreneurs Internet Private Limited | 3.64 | 100.00% | 0.00% | 0.00% |
| UPI Payee PSP Performance (June'24) | |||||
|---|---|---|---|---|---|
| Sr. No. | Payee PSP | Total Volume (In Mn) | Approved % | BD % | TD % |
| 1 | Yes bank Ltd. | 7,968.92 | 93.44% | 6.41% | 0.15% |
| 2 | AXIS Bank Ltd. | 2,412.86 | 94.54% | 5.29% | 0.17% |
| 3 | ICICI Bank Ltd. | 1,497.20 | 93.83% | 6.02% | 0.15% |
| 4 | State bank Of India | 840.24 | 94.54% | 5.31% | 0.15% |
| 5 | HDFC Bank Ltd. | 766.45 | 94.65% | 5.23% | 0.13% |
| 6 | Federal Bank Ltd. | 319.03 | 96.91% | 2.95% | 0.14% |
| 7 | Cosmos Bank | 81.64 | 90.00% | 9.83% | 0.17% |
| 8 | Indusind Bank Ltd. | 71.72 | 94.25% | 5.62% | 0.13% |
| 9 | Airtel Payments Bank Ltd | 64.33 | 94.82% | 5.05% | 0.13% |
| 10 | RBL Bank Ltd. | 51.96 | 93.72% | 6.01% | 0.27% |
| 11 | Canara Bank | 45.37 | 96.48% | 3.39% | 0.13% |
| 12 | Kotak Mahindra Bank Ltd | 40.95 | 95.35% | 4.48% | 0.17% |
| 13 | One Mobikwik Systems Pvt - Ltd | 36.26 | 96.49% | 3.39% | 0.12% |
| 14 | Indian Bank | 29.60 | 93.07% | 6.76% | 0.17% |
| 15 | Fino Payments Bank Ltd. | 28.43 | 90.38% | 9.46% | 0.17% |
| UPI Merchant Category-wise Classification - June'24 (Arranged by Volume) | ||||
|---|---|---|---|---|
| Type | MCC | Description | Volume (in Mn) | Value (in Cr.) |
| High Transacting Categories | 5411 | Groceries and supermarkets | 1,909.32 | 46,060.73 |
| 5814 | Fast food restaurants | 896.28 | 11,306.93 | |
| 5812 | Eating places and restaurants | 786.33 | 13,059.11 | |
| 4814 | Telecommunication services, including local and long distance calls, credit card calls, calls through use of magnetic stripe reading telephones and faxes | 749.31 | 15,298.13 | |
| 5541 | Service stations (with or without ancillary services) | 427.70 | 26,727.97 | |
| 5816 | Digital Goods: Games | 352.07 | 12,540.62 | |
| 5912 | Drug stores and pharmacies | 190.91 | 7,531.52 | |
| 5462 | Bakeries | 189.54 | 2,711.38 | |
| 5311 | Department stores | 171.39 | 3,964.18 | |
| 4900 | Utilities electric, gas, water and sanitary | 147.89 | 19,381.05 | |
| Medium Transacting Categories | 5451 | Dairies | 127.97 | 2,791.75 |
| 7322 | Debt collection agencies | 97.03 | 68,244.64 | |
| 5813 | Drinking places (alcoholic beverages) bars, taverns, night-clubs, cocktail lounges and discothques | 84.09 | 3,256.26 | |
| 5441 | Candy, nut and confectionery shops | 78.15 | 1,306.73 | |
| 5422 | Freezer and locker meat provisioners | 70.28 | 2,385.38 | |
| 5921 | Package shops beer, wine and liquor | 67.38 | 2,892.88 | |
| 7622 | Electronics repair shops | 64.62 | 2,111.92 | |
| 5993 | Cigar shops and stands | 63.21 | 475.57 | |
| 6211 | Securities brokers and dealers | 60.15 | 61,064.27 | |
| 5262 | Online Marketplaces | 57.23 | 5,167.03 | |
| All Other Categories | 5137 | Mens, womens and childrens uniforms and commercial clothing | 57.23 | 5,063.20 |
| 5732 | Electronics shops | 55.52 | 8,009.80 | |
| 7230 | Beauty and barber shops | 54.63 | 1,565.27 | |
| 4112 | Passenger railways | 49.72 | 2,955.02 | |
| 9399 | Government services not elsewhere classified | 49.31 | 5,653.35 | |
| 5331 | Variety stores | 47.36 | 2,649.79 | |
| 4121 | Taxi-cabs and limousines | 42.09 | 994.54 | |
| 6012 | Financial institutions merchandise and services | 41.31 | 17,064.97 | |
| 5691 | Mens and womens clothing shops | 40.97 | 4,819.00 | |
| Others | 1,691.76 | 2,02,885.99 | ||
| Total | 8,720.75 | 5,59,938.98 | ||
| State-wise UPI Product Statistics* (Jun'24) | |||||
|---|---|---|---|---|---|
| Sr. No. | State / Union Territory | Volume (in Mn ) | Volume Contribution (%) | Value (in Cr.) | Value Contribution (%) |
| 1 | MAHARASHTRA | 1,827.94 | 13.16% | 2,52,008.51 | 12.56% |
| 2 | KARNATAKA | 1,140.18 | 8.21% | 1,58,022.89 | 7.87% |
| 3 | UTTAR PRADESH | 1,018.74 | 7.34% | 1,33,867.63 | 6.67% |
| 4 | TELANGANA | 878.60 | 6.33% | 1,42,465.64 | 7.10% |
| 5 | TAMIL NADU | 663.61 | 4.78% | 1,07,352.87 | 5.35% |
| 6 | RAJASTHAN | 615.97 | 4.44% | 90,403.66 | 4.50% |
| 7 | MADHYA PRADESH | 567.43 | 4.09% | 75,744.52 | 3.77% |
| 8 | ANDHRA PRADESH | 514.47 | 3.71% | 94,162.90 | 4.69% |
| 9 | BIHAR | 486.02 | 3.50% | 73,741.40 | 3.67% |
| 10 | DELHI | 469.85 | 3.38% | 56,600.66 | 2.82% |
| 11 | GUJARAT | 452.59 | 3.26% | 68,664.93 | 3.42% |
| 12 | WEST BENGAL | 421.23 | 3.03% | 68,076.90 | 3.39% |
| 13 | HARYANA | 363.84 | 2.62% | 50,928.34 | 2.54% |
| 14 | KERALA | 312.74 | 2.25% | 44,455.91 | 2.21% |
| 15 | ODISHA | 311.53 | 2.24% | 41,961.30 | 2.09% |
| 16 | PUNJAB | 189.55 | 1.37% | 31,019.54 | 1.55% |
| 17 | ASSAM | 185.41 | 1.34% | 22,657.67 | 1.13% |
| 18 | JHARKHAND | 162.72 | 1.17% | 22,088.48 | 1.10% |
| 19 | CHHATTISGARH | 135.97 | 0.98% | 18,173.83 | 0.91% |
| 20 | UTTARAKHAND | 107.43 | 0.77% | 13,873.68 | 0.69% |
| 21 | JAMMU AND KASHMIR | 66.81 | 0.48% | 9,257.40 | 0.46% |
| 22 | HIMACHAL PRADESH | 60.51 | 0.44% | 7,786.25 | 0.39% |
| 23 | GOA | 27.92 | 0.20% | 4,020.18 | 0.20% |
| 24 | CHANDIGARH | 27.18 | 0.20% | 3,446.21 | 0.17% |
| 25 | ARUNACHAL PRADESH | 15.05 | 0.11% | 2,158.51 | 0.11% |
| 26 | PUDUCHERRY | 14.97 | 0.11% | 2,128.41 | 0.11% |
| 27 | TRIPURA | 10.80 | 0.08% | 1,581.02 | 0.08% |
| 28 | MEGHALAYA | 10.72 | 0.08% | 1,500.13 | 0.07% |
| 29 | DADRA & NAGAR HAVELI & DAMAN & DIU | 10.21 | 0.07% | 1,063.82 | 0.05% |
| 30 | NAGALAND | 9.46 | 0.07% | 1,682.06 | 0.08% |
| 31 | MANIPUR | 9.04 | 0.07% | 2,164.60 | 0.11% |
| 32 | MIZORAM | 7.02 | 0.05% | 1,313.47 | 0.07% |
| 33 | SIKKIM | 6.04 | 0.04% | 934.34 | 0.05% |
| 34 | LADAKH | 3.87 | 0.03% | 792.33 | 0.04% |
| 35 | ANDAMAN & NICOBAR | 2.90 | 0.02% | 489.58 | 0.02% |
| 36 | LAKSHADWEEP | 0.35 | 0.00% | 40.58 | 0.00% |
| 37 | UNCLASSIFIED# | 2,776.47 | 20.00% | 4,00,451.04 | 19.95% |
| UPI Remitter Banks - Top 50 Banks (May'24) | |||||||
|---|---|---|---|---|---|---|---|
| Sr. No. | UPI Remitter Banks (May-2024) | Total Volume (In Mn) | Approved % | BD % | TD% | Total Debit Reversal Count (In Mn) | Debit Reversal Success % |
| 1 | State Bank Of India | 3758.35 | 94.80% | 5.01% | 0.20% | 13.29 | 98.55% |
| 2 | HDFC Bank Ltd | 1211.41 | 95.75% | 4.19% | 0.06% | 3.69 | 98.50% |
| 3 | Bank of Baroda | 930.35 | 92.49% | 6.56% | 0.95% | 4.50 | 84.38% |
| 4 | Union Bank of India | 876.18 | 94.38% | 5.38% | 0.24% | 3.38 | 78.77% |
| 5 | Punjab National Bank | 785.36 | 93.64% | 6.05% | 0.31% | 3.19 | 87.42% |
| 6 | Kotak Mahindra Bank | 746.83 | 92.83% | 6.78% | 0.39% | 3.56 | 63.74% |
| 7 | Canara Bank | 670.33 | 92.87% | 6.15% | 0.98% | 5.16 | 72.09% |
| 8 | ICICI Bank | 627.63 | 96.33% | 3.62% | 0.05% | 1.65 | 95.22% |
| 9 | Axis Bank Ltd. | 627.47 | 95.60% | 4.39% | 0.02% | 1.77 | 95.16% |
| 10 | Bank of India | 454.54 | 93.16% | 5.16% | 1.68% | 2.77 | 61.76% |
| 11 | Indian Bank | 427.45 | 94.11% | 5.65% | 0.24% | 1.53 | 83.49% |
| 12 | Airtel Payments Bank | 413.75 | 91.27% | 8.20% | 0.52% | 1.75 | 96.34% |
| 13 | India Post Payment Bank | 317.28 | 86.84% | 12.47% | 0.70% | 1.34 | 82.16% |
| 14 | Federal Bank | 212.71 | 94.09% | 5.44% | 0.47% | 0.75 | 89.02% |
| 15 | Central Bank Of India | 206.31 | 87.26% | 11.16% | 1.57% | 1.59 | 69.46% |
| 16 | Indian Overseas Bank | 197.96 | 94.32% | 5.24% | 0.44% | 0.75 | 88.54% |
| 17 | UCO Bank | 184.22 | 93.72% | 6.16% | 0.11% | 0.72 | 87.45% |
| 18 | IDBI Bank Limited | 159.28 | 94.40% | 5.46% | 0.14% | 0.55 | 90.23% |
| 19 | Bank of Maharashtra | 152.68 | 92.45% | 5.48% | 2.06% | 1.14 | 57.34% |
| 20 | Indusind Bank | 150.37 | 92.32% | 7.38% | 0.31% | 0.96 | 97.88% |
| 21 | Fino Payments Bank Limited | 140.12 | 92.59% | 7.19% | 0.22% | 0.66 | 75.30% |
| 22 | Yes Bank Ltd | 121.13 | 94.05% | 5.90% | 0.05% | 0.30 | 89.05% |
| 23 | Karnataka Bank | 110.31 | 93.24% | 6.47% | 0.29% | 0.41 | 84.19% |
| 24 | IDFC First Bank | 87.12 | 92.89% | 7.06% | 0.04% | 0.27 | 93.96% |
| 25 | Karur Vysya Bank | 68.36 | 93.97% | 5.85% | 0.18% | 0.21 | 93.36% |
| 26 | Jammu and Kashmir Bank | 66.17 | 93.91% | 4.48% | 1.60% | 0.64 | 32.81% |
| 27 | Bandhan Bank | 59.24 | 91.70% | 6.70% | 1.60% | 0.27 | 96.55% |
| 28 | South Indian Bank | 54.78 | 95.49% | 4.41% | 0.10% | 0.14 | 90.82% |
| 29 | Tri O Tech Solutions Private Limited | 50.10 | 100.00% | 0.00% | 0.00% | 0.00 | 0.00% |
| 30 | AU small Finance Bank | 47.67 | 93.42% | 5.75% | 0.83% | 0.25 | 76.77% |
| 31 | Ujjivan Small Finance Bank | 45.10 | 93.75% | 5.64% | 0.61% | 0.22 | 70.45% |
| 32 | City Union Bank | 41.63 | 92.90% | 6.73% | 0.37% | 0.14 | 99.12% |
| 33 | Punjab and Sind Bank | 38.16 | 92.76% | 6.89% | 0.36% | 0.19 | 82.65% |
| 34 | Tamilnad Mercantile Bank | 38.01 | 92.38% | 7.19% | 0.44% | 0.12 | 79.30% |
| 35 | Equitas Small Finance Bank | 33.53 | 92.55% | 7.18% | 0.27% | 0.15 | 85.61% |
| 36 | Andhra Pradesh Grameena Vikas Bank | 29.80 | 85.93% | 12.05% | 2.02% | 0.19 | 69.54% |
| 37 | Kerala Gramin Bank | 29.05 | 92.97% | 5.66% | 1.37% | 0.16 | 62.06% |
| 38 | Pragathi Krishna Gramin Bank | 27.76 | 89.64% | 7.36% | 3.00% | 0.40 | 55.43% |
| 39 | DBS Bank India Limited | 27.40 | 94.26% | 5.59% | 0.16% | 0.09 | 72.20% |
| 40 | Maharashtra Gramin Bank | 26.27 | 86.04% | 11.57% | 2.39% | 0.12 | 57.65% |
| 41 | Rajasthan Marudhara Gramin Bank | 25.55 | 86.55% | 11.29% | 2.16% | 0.23 | 36.91% |
| 42 | Standard Chartered | 25.23 | 96.94% | 2.87% | 0.18% | 0.07 | 88.23% |
| 43 | Saraswat Bank | 23.75 | 95.17% | 4.19% | 0.64% | 0.09 | 71.49% |
| 44 | Baroda UP Gramin Bank | 23.63 | 78.17% | 9.63% | 12.20% | 0.73 | 18.03% |
| 45 | ESAF Small Finance Bank Ltd. | 22.91 | 95.23% | 4.54% | 0.23% | 0.07 | 98.57% |
| 46 | Fincare Small Finance Bank Ltd | 21.54 | 85.62% | 13.92% | 0.46% | 0.10 | 86.35% |
| 47 | Sarva Haryana Gramin Bank | 20.85 | 86.11% | 12.06% | 1.83% | 0.20 | 39.45% |
| 48 | Citi Bank | 20.03 | 96.49% | 3.14% | 0.37% | 0.07 | 99.11% |
| 49 | Andhra Pragathi Grameena Bank | 18.23 | 83.62% | 13.00% | 3.38% | 0.28 | 22.98% |
| 50 | RBL Bank Limited | 16.38 | 89.18% | 9.91% | 0.92% | 0.09 | 54.47% |
| UPI Beneficiary Banks - Top 50 Banks (May'24) | |||||||
|---|---|---|---|---|---|---|---|
| Sr.No. | UPI Beneficiary Banks (May-2024) | Total Volume (In Mn) | Approved % | BD% | TD% | Deemed Approved % | |
| 1 | Yes Bank Ltd | 5597.32 | 99.96% | 0.02% | 0.02% | 0.00% | |
| 2 | State Bank of India | 1589.47 | 99.76% | 0.10% | 0.15% | 0.05% | |
| 3 | Axis Bank Ltd | 1290.76 | 99.88% | 0.11% | 0.00% | 0.01% | |
| 4 | HDFC Bank Ltd | 652.69 | 98.85% | 1.10% | 0.06% | 0.03% | |
| 5 | ICICI Bank | 633.50 | 99.61% | 0.37% | 0.02% | 0.02% | |
| 6 | Bank of Baroda | 400.48 | 99.31% | 0.25% | 0.45% | 0.14% | |
| 7 | Federal Bank | 391.25 | 99.36% | 0.24% | 0.41% | 0.07% | |
| 8 | Union Bank Of India | 356.69 | 99.46% | 0.11% | 0.43% | 0.04% | |
| 9 | Punjab national Bank | 326.47 | 99.36% | 0.29% | 0.36% | 0.17% | |
| 10 | Canara Bank | 305.13 | 97.98% | 1.15% | 0.87% | 0.36% | |
| 11 | Kotak Mahindra Bank | 285.74 | 99.27% | 0.44% | 0.29% | 0.11% | |
| 12 | Airtel Payments Bank | 264.42 | 99.41% | 0.25% | 0.35% | 0.09% | |
| 13 | Indian Bank | 230.91 | 98.47% | 1.32% | 0.22% | 0.21% | |
| 14 | Bank Of India | 203.54 | 98.08% | 0.82% | 1.10% | 0.40% | |
| 15 | India Post Payment Bank | 136.48 | 99.39% | 0.28% | 0.33% | 0.06% | |
| 16 | Indusind Bank | 127.61 | 99.32% | 0.49% | 0.19% | 0.04% | |
| 17 | Central Bank of India | 94.86 | 98.67% | 0.57% | 0.77% | 0.20% | |
| 18 | Indian Overseas Bank | 93.82 | 98.87% | 0.89% | 0.24% | 0.12% | |
| 19 | UCO Bank | 87.25 | 99.23% | 0.71% | 0.05% | 0.03% | |
| 20 | Fino Payments Bank Limited | 72.06 | 96.62% | 3.19% | 0.19% | 0.04% | |
| 21 | IDBI Bank Limited | 67.45 | 99.62% | 0.31% | 0.07% | 0.01% | |
| 22 | Bank of Maharashtra | 62.25 | 97.48% | 0.18% | 2.34% | 0.42% | |
| 23 | Karnataka Bank | 48.13 | 98.31% | 1.40% | 0.30% | 0.04% | |
| 24 | RBL Bank LTD | 45.73 | 98.38% | 1.39% | 0.23% | 0.12% | |
| 25 | IDFC First Bank | 36.08 | 98.76% | 1.17% | 0.07% | 0.01% | |
| 26 | Karur Vysya Bank | 35.56 | 98.62% | 1.22% | 0.16% | 0.04% | |
| 27 | Bandhan Bank | 35.28 | 97.94% | 0.41% | 1.65% | 0.06% | |
| 28 | South Indian Bank | 34.01 | 98.76% | 1.15% | 0.09% | 0.02% | |
| 29 | Jammu and Kashmir Bank | 32.79 | 99.20% | 0.45% | 0.35% | 0.35% | |
| 30 | ONE MOBIKWIK SYSTEMS LIMITED | 31.71 | 99.96% | 0.02% | 0.03% | 0.00% | |
| 31 | AU small Finance Bank | 27.89 | 97.90% | 1.53% | 0.57% | 0.12% | |
| 32 | Tamilnad Mercantile Bank | 25.26 | 99.55% | 0.09% | 0.36% | 0.04% | |
| 33 | Tri O Tech Solutions Private Limited | 24.56 | 96.07% | 3.80% | 0.13% | 0.03% | |
| 34 | Ujjivan Small Finance Bank | 22.36 | 98.74% | 0.89% | 0.37% | 0.25% | |
| 35 | City Union Bank | 21.65 | 97.73% | 2.00% | 0.27% | 0.00% | |
| 36 | Punjab and Sind Bank | 16.69 | 98.68% | 1.02% | 0.30% | 0.10% | |
| 37 | Kerala Gramin Bank | 15.56 | 98.12% | 0.97% | 0.91% | 0.40% | |
| 38 | Equitas Small Finance Bank | 14.39 | 98.49% | 1.32% | 0.19% | 0.06% | |
| 39 | Andhra Pradesh Grameena Vikas Bank | 13.89 | 98.87% | 0.45% | 0.67% | 0.15% | |
| 40 | Jio Payments Bank | 13.39 | 99.05% | 0.50% | 0.46% | 0.18% | |
| 41 | Pragathi Krishna Gramin Bank | 13.28 | 97.27% | 1.18% | 1.56% | 0.94% | |
| 42 | Maharashtra Gramin Bank | 12.25 | 97.65% | 0.35% | 2.01% | 0.39% | |
| 43 | CITI Bank | 12.10 | 99.79% | 0.00% | 0.21% | 0.30% | |
| 44 | Rajasthan Marudhara Gramin Bank | 12.01 | 97.70% | 0.42% | 1.88% | 0.42% | |
| 45 | Baroda Uttar Pradesh Gramin Bank | 11.53 | 90.43% | 0.62% | 8.96% | 2.70% | |
| 46 | The Cosmos Co-Operative Bank Ltd | 11.39 | 97.72% | 0.09% | 2.20% | 0.58% | |
| 47 | DBS Bank India Limited | 11.22 | 97.51% | 1.57% | 0.92% | 0.06% | |
| 48 | ESAF Small Finance Bank Ltd. | 11.10 | 99.73% | 0.19% | 0.08% | 0.02% | |
| 49 | Fincare Small Finance Bank Ltd | 10.07 | 96.43% | 3.15% | 0.41% | 0.06% | |
| 50 | Andhra Pragathi Grameena Bank | 9.22 | 97.03% | 0.88% | 2.10% | 0.37% | |
| UPI Apps (May'24) | |||||||||||
|---|---|---|---|---|---|---|---|---|---|---|---|
| Sr.No. | Application Name | Customer Initiated Transactions | B2C Transactions | B2B Transactions | On-us Transactions | Total | |||||
| Volume (Mn) | Value (Cr) | Volume (Mn) | Value (Cr) | Volume (Mn) | Value (Cr) | Volume (Mn) | Value (Cr) | Volume (Mn) | Value (Cr) | ||
| 1 | PhonePe | 6,831.92 | 10,33,588.80 | 0.00 | 0.00 | 0.00 | 0.00 | 0.00 | 0.00 | 6,831.92 | 10,33,588.80 |
| 2 | Google Pay | 5,219.56 | 7,23,315.70 | 0.00 | 0.00 | 0.00 | 0.00 | 0.00 | 0.00 | 5,219.56 | 7,23,315.70 |
| 3 | Paytm (OCL) | 1,140.01 | 1,24,704.79 | 0.00 | 0.00 | 0.00 | 0.00 | 0.00 | 0.00 | 1,140.01 | 1,24,704.80 |
| 4 | Cred | 140.08 | 47,547.15 | 0.00 | 0.00 | 0.00 | 0.00 | 0.00 | 0.00 | 140.08 | 47,547.15 |
| 5 | Amazon Pay | 68.34 | 7,419.41 | 0.00 | 0.00 | 0.00 | 0.00 | 0.00 | 0.00 | 68.34 | 7,419.41 |
| 6 | Axis Bank Apps | 14.15 | 3,722.58 | 49.93 | 2,184.74 | 0.01 | 2.89 | 0.00 | 0.00 | 64.08 | 5,910.20 |
| 7 | ICICI Bank Apps | 38.50 | 15,332.69 | 4.22 | 449.37 | 9.37 | 12,661.97 | 0.00 | 0.00 | 52.10 | 28,444.03 |
| 8 | FamApp by Trio # | 50.10 | 630.89 | 0.00 | 0.00 | 0.00 | 0.00 | 0.00 | 0.00 | 50.10 | 630.89 |
| 9 | Kotak Mahindra Bank Apps | 43.41 | 6,178.23 | 0.00 | 0.00 | 0.00 | 0.00 | 0.00 | 0.00 | 43.41 | 6,178.23 |
| 10 | 36.45 | 2,938.72 | 0.00 | 0.00 | 0.00 | 0.00 | 0.00 | 0.00 | 36.45 | 2,938.72 | |
| 11 | HDFC Bank Apps | 35.40 | 8,104.06 | 0.02 | 0.06 | 0.01 | 0.32 | 0.00 | 0.00 | 35.43 | 8,104.44 |
| 12 | Navi | 29.72 | 958.09 | 0.00 | 0.00 | 0.00 | 0.00 | 0.00 | 0.00 | 29.72 | 958.09 |
| 13 | BHIM | 23.43 | 8,095.99 | 0.00 | 0.00 | 0.00 | 0.00 | 0.00 | 0.00 | 23.43 | 8,095.99 |
| 14 | Yes Bank Apps | 22.48 | 10,939.53 | 0.00 | 0.00 | 0.26 | 32.11 | 0.00 | 0.00 | 22.75 | 10,971.64 |
| 15 | Airtel Payments Bank Apps | 17.29 | 1,329.67 | 0.00 | 0.00 | 0.00 | 0.48 | 0.00 | 0.05 | 17.29 | 1,330.15 |
| 16 | Mobikwik | 11.12 | 2,536.09 | 0.00 | 0.00 | 0.00 | 0.00 | 0.00 | 0.00 | 11.12 | 2,536.09 |
| 17 | Groww | 10.15 | 7,086.12 | 0.00 | 0.00 | 0.00 | 0.00 | 0.00 | 0.00 | 10.15 | 7,086.12 |
| 18 | Bajaj Finserv | 9.55 | 1,685.51 | 0.00 | 0.00 | 0.00 | 0.00 | 0.00 | 0.00 | 9.55 | 1,685.51 |
| 19 | Slice | 9.05 | 646.12 | 0.00 | 0.00 | 0.00 | 0.00 | 0.00 | 0.00 | 9.05 | 646.12 |
| 20 | State Bank of India Apps | 7.12 | 2,494.20 | 0.00 | 0.00 | 0.00 | 0.00 | 0.00 | 0.00 | 7.12 | 2,494.20 |
| 21 | IDFC Bank Apps | 6.99 | 1,690.27 | 0.00 | 0.00 | 0.00 | 0.00 | 0.00 | 0.00 | 6.99 | 1,690.27 |
| 22 | Samsung Pay | 6.56 | 547.28 | 0.00 | 0.00 | 0.00 | 0.00 | 0.00 | 0.00 | 6.56 | 547.28 |
| 23 | Jupiter | 6.07 | 769.10 | 0.00 | 0.00 | 0.00 | 0.00 | 0.00 | 0.00 | 6.07 | 769.10 |
| 24 | Federal Bank Apps | 5.95 | 811.83 | 0.00 | 0.00 | 0.00 | 0.00 | 0.00 | 0.00 | 5.95 | 811.83 |
| 25 | India Post Payments Bank Apps | 5.67 | 703.81 | 0.00 | 0.00 | 0.00 | 0.00 | 0.00 | 0.00 | 5.67 | 703.81 |
| 26 | Flipkart | 4.44 | 251.85 | 0.00 | 0.00 | 0.00 | 0.00 | 0.00 | 0.00 | 4.44 | 251.85 |
| 27 | Canara Bank Apps | 3.06 | 828.58 | 0.00 | 0.00 | 0.00 | 0.00 | 0.00 | 0.00 | 3.06 | 828.58 |
| 28 | Deutsche Bank Apps | 2.34 | 369.39 | 0.00 | 0.00 | 0.00 | 0.03 | 0.00 | 0.00 | 2.34 | 369.42 |
| 29 | RBL Bank Apps | 2.20 | 900.13 | 0.00 | 0.00 | 0.05 | 31.21 | 0.00 | 0.00 | 2.24 | 931.34 |
| 30 | Jio Payments Bank Apps | 2.02 | 170.98 | 0.00 | 0.00 | 0.00 | 0.00 | 0.00 | 0.00 | 2.02 | 170.98 |
| 31 | Punjab National Bank Apps | 1.74 | 444.50 | 0.00 | 0.00 | 0.00 | 0.00 | 0.00 | 0.00 | 1.74 | 444.50 |
| 32 | Timepay | 1.61 | 17.59 | 0.00 | 0.00 | 0.00 | 0.10 | 0.00 | 0.00 | 1.61 | 17.69 |
| 33 | Indian Bank Apps | 1.54 | 319.53 | 0.00 | 0.00 | 0.00 | 10.05 | 0.00 | 0.00 | 1.55 | 329.58 |
| 34 | OmniCard | 1.24 | 45.65 | 0.00 | 0.00 | 0.00 | 0.00 | 0.00 | 0.00 | 1.24 | 45.65 |
| 35 | Union Bank Apps | 1.19 | 505.23 | 0.00 | 0.00 | 0.00 | 0.00 | 0.00 | 0.00 | 1.19 | 505.24 |
| 36 | Bank of Baroda Apps | 1.02 | 456.55 | 0.00 | 0.00 | 0.00 | 7.31 | 0.00 | 0.00 | 1.02 | 463.85 |
| 37 | Central Bank of India Apps | 0.95 | 213.29 | 0.00 | 0.00 | 0.00 | 0.00 | 0.00 | 0.00 | 0.95 | 213.29 |
| 38 | AU Small Finance Bank Apps | 0.82 | 249.60 | 0.00 | 0.00 | 0.00 | 0.00 | 0.00 | 0.00 | 0.82 | 249.60 |
| 39 | DBS Digibank Apps | 0.48 | 192.60 | 0.00 | 0.00 | 0.00 | 0.49 | 0.00 | 0.00 | 0.48 | 193.09 |
| 40 | South Indian Bank Apps | 0.47 | 141.47 | 0.00 | 0.00 | 0.00 | 0.00 | 0.00 | 0.00 | 0.47 | 141.47 |
| 41 | Jammu and Kashmir Bank Apps | 0.43 | 64.02 | 0.00 | 0.00 | 0.00 | 0.00 | 0.00 | 0.00 | 0.43 | 64.02 |
| 42 | Fino Payments bank Apps | 0.38 | 53.86 | 0.00 | 0.00 | 0.00 | 0.00 | 0.00 | 0.00 | 0.38 | 53.86 |
| 43 | HSBC Bank Apps | 0.37 | 144.05 | 0.00 | 0.05 | 0.00 | 0.00 | 0.00 | 0.00 | 0.37 | 144.11 |
| 44 | IndusInd Bank Apps | 0.35 | 73.84 | 0.00 | 0.00 | 0.00 | 0.58 | 0.00 | 0.00 | 0.36 | 74.41 |
| 45 | Shriram One | 0.29 | 36.28 | 0.00 | 0.00 | 0.00 | 0.00 | 0.00 | 0.00 | 0.29 | 36.28 |
| 46 | Bank of India Apps | 0.21 | 81.09 | 0.00 | 0.00 | 0.00 | 0.00 | 0.00 | 0.00 | 0.21 | 81.09 |
| 47 | UCO Bank Apps | 0.20 | 65.61 | 0.00 | 0.00 | 0.00 | 0.00 | 0.00 | 0.00 | 0.20 | 65.61 |
| 48 | Kiwi | 0.18 | 36.03 | 0.00 | 0.00 | 0.00 | 0.00 | 0.00 | 0.00 | 0.18 | 36.03 |
| 49 | TataNeu | 0.18 | 25.10 | 0.00 | 0.00 | 0.00 | 0.00 | 0.00 | 0.00 | 0.18 | 25.10 |
| 50 | Standard Chartered Bank Apps | 0.16 | 114.40 | 0.00 | 0.00 | 0.00 | 0.02 | 0.00 | 0.00 | 0.16 | 114.42 |
| 51 | Digikhata | 0.16 | 52.29 | 0.00 | 0.00 | 0.00 | 0.00 | 0.00 | 0.00 | 0.16 | 52.29 |
| 52 | Karnataka Bank Apps | 0.16 | 30.00 | 0.00 | 0.00 | 0.00 | 0.00 | 0.00 | 0.00 | 0.16 | 30.00 |
| 53 | Indian Overseas Bank Apps | 0.12 | 34.43 | 0.00 | 0.00 | 0.00 | 0.00 | 0.00 | 0.00 | 0.12 | 34.43 |
| 54 | Dhani | 0.11 | 13.12 | 0.00 | 0.00 | 0.00 | 0.00 | 0.00 | 0.00 | 0.11 | 13.12 |
| 55 | Ultracash | 0.09 | 6.19 | 0.00 | 0.00 | 0.00 | 0.00 | 0.00 | 0.00 | 0.09 | 6.19 |
| 56 | Tamilnad Mercantile Bank Apps | 0.08 | 25.66 | 0.00 | 0.00 | 0.00 | 0.00 | 0.00 | 0.00 | 0.08 | 25.66 |
| 57 | Citi Bank Apps | 0.08 | 66.69 | 0.00 | 0.00 | 0.00 | 0.05 | 0.00 | 0.00 | 0.08 | 66.74 |
| 58 | City Union Bank Apps | 0.08 | 28.77 | 0.00 | 0.00 | 0.00 | 0.00 | 0.00 | 0.00 | 0.08 | 28.77 |
| 59 | NSDL Payments Bank Apps | 0.07 | 12.71 | 0.00 | 0.00 | 0.00 | 0.00 | 0.00 | 0.00 | 0.07 | 12.71 |
| 60 | IDBI Bank Apps | 0.07 | 27.32 | 0.00 | 0.00 | 0.00 | 0.00 | 0.00 | 0.00 | 0.07 | 27.32 |
| 61 | Aditya Birla Capital Digital | 0.05 | 1.84 | 0.00 | 0.00 | 0.00 | 0.00 | 0.00 | 0.00 | 0.05 | 1.84 |
| 62 | Karur Vysya Bank Apps | 0.05 | 20.63 | 0.00 | 0.00 | 0.00 | 0.00 | 0.00 | 0.00 | 0.05 | 20.63 |
| 63 | Bank of Maharashtra Apps | 0.05 | 10.37 | 0.00 | 0.00 | 0.00 | 0.12 | 0.00 | 0.00 | 0.05 | 10.49 |
| 64 | Niyo Global | 0.04 | 22.56 | 0.00 | 0.00 | 0.00 | 0.00 | 0.00 | 0.00 | 0.04 | 22.56 |
| 65 | MakeMyTrip | 0.04 | 18.12 | 0.00 | 0.00 | 0.00 | 0.00 | 0.00 | 0.00 | 0.04 | 18.12 |
| 66 | Equitas Small Finance Bank Apps | 0.04 | 25.35 | 0.00 | 0.00 | 0.00 | 0.00 | 0.00 | 0.00 | 0.04 | 25.35 |
| 67 | Punjab Sind Bank Apps | 0.03 | 12.97 | 0.00 | 0.00 | 0.00 | 0.00 | 0.00 | 0.00 | 0.03 | 12.97 |
| 68 | Other Apps | 1.15 | 145.19 | 0.00 | 0.00 | 0.14 | 3.74 | 0.00 | 0.00 | 1.29 | 148.93 |
Note:-
| UPI P2P and P2M Transactions | ||||||
|---|---|---|---|---|---|---|
| Month | Total | P2P | P2M | |||
| Volume (Mn) | Value (Cr) | Volume (Mn) | Value (Cr) | Volume (Mn) | Value (Cr) | |
| May’24 | 14,035.84 | 20,44,937.05 | 5,231.01 | 14,88,235.39 | 8,804.83 | 5,56,701.66 |
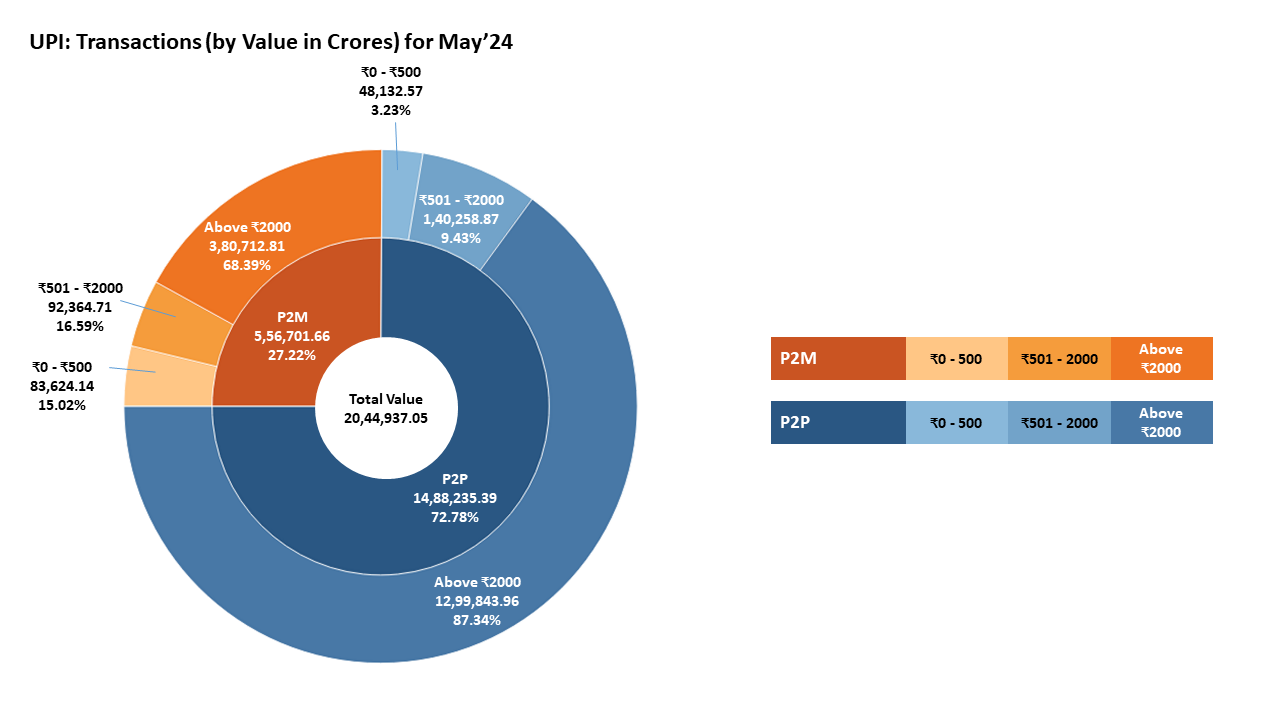

| UPI Payer PSP Performance (May'24) | |||||
|---|---|---|---|---|---|
| Sr. No. | Payer PSP | Total Volume (In Mn) | Approved % | BD % | TD % |
| 1 | YES BANK LTD | 5,297.04 | 92.93% | 6.98% | 0.09% |
| 2 | AXIS BANK LTD | 4,029.90 | 94.30% | 5.60% | 0.10% |
| 3 | ICICI BANK | 2,756.94 | 93.97% | 5.93% | 0.10% |
| 4 | STATE BANK OF INDIA | 1,360.48 | 95.85% | 4.09% | 0.06% |
| 5 | HDFC BANK LTD | 1,280.26 | 95.39% | 4.53% | 0.08% |
| 6 | TRI O TECH SOLUTIONS PRIVATE LIMITED | 50.10 | 100.00% | 0.00% | 0.00% |
| 7 | KOTAK MAHINDRA BANK | 43.65 | 100.00% | 0.00% | 0.00% |
| 8 | BHIM | 27.76 | 93.44% | 6.42% | 0.14% |
| 9 | AIRTEL PAYMENTS BANK | 17.95 | 96.34% | 3.62% | 0.04% |
| 10 | RBL BANK | 7.99 | 95.79% | 4.13% | 0.08% |
| 11 | IDBI BANK LTD | 7.49 | 99.21% | 0.78% | 0.01% |
| 12 | FEDERAL BANK | 6.09 | 97.89% | 2.09% | 0.02% |
| 13 | INDIA POST PAYMENT BANK | 5.68 | 99.97% | 0.03% | 0.00% |
| 14 | GARAGEPRENEURS INTERNET PRIVATE LIMITED | 4.86 | 100.00% | 0.00% | 0.00% |
| 15 | CANARA BANK | 3.49 | 95.50% | 4.13% | 0.37% |
| UPI Payee PSP Performance (May'24) | |||||
|---|---|---|---|---|---|
| Sr. No. | Payee PSP | Total Volume (In Mn) | Approved % | BD % | TD % |
| 1 | YES BANK LTD | 8,057.45 | 93.67% | 6.24% | 0.09% |
| 2 | AXIS BANK LTD | 2,436.30 | 94.55% | 5.35% | 0.10% |
| 3 | ICICI BANK | 1,521.86 | 93.86% | 6.05% | 0.09% |
| 4 | STATE BANK OF INDIA | 867.88 | 94.46% | 5.46% | 0.08% |
| 5 | HDFC BANK LTD | 754.96 | 95.00% | 4.93% | 0.08% |
| 6 | FEDERAL BANK | 322.26 | 96.99% | 2.94% | 0.08% |
| 7 | AIRTEL PAYMENTS BANK | 72.58 | 94.87% | 5.05% | 0.08% |
| 8 | COSMOS BANK | 71.19 | 90.83% | 9.03% | 0.14% |
| 9 | INDUSIND BANK | 68.86 | 94.65% | 5.27% | 0.08% |
| 10 | RBL BANK | 58.44 | 93.59% | 6.22% | 0.20% |
| 11 | KOTAK MAHINDRA BANK | 44.14 | 95.29% | 4.61% | 0.11% |
| 12 | CANARA BANK | 43.17 | 96.54% | 3.39% | 0.07% |
| 13 | INDIAN BANK | 40.65 | 91.95% | 7.90% | 0.15% |
| 14 | ONE MOBIKWIK SYSTEMS LIMITED | 32.82 | 96.55% | 3.36% | 0.08% |
| 15 | FINO PAYMENTS BANK LIMITED | 26.47 | 91.26% | 8.62% | 0.12% |
| UPI Merchant Category-wise Classification - May'24 (Arranged by Volume) | ||||
|---|---|---|---|---|
| Type | MCC | Description | Volume (in Mn) | Value (in Cr.) |
| High Transacting Categories | 5411 | Groceries and supermarkets | 2,023.71 | 47,666.52 |
| 5814 | Fast food restaurants | 903.65 | 11,510.31 | |
| 5812 | Eating places and restaurants | 814.99 | 13,900.27 | |
| 4814 | Telecommunication services, including local and long distance calls, credit card calls, calls through use of magnetic stripe reading telephones and faxes | 636.31 | 15,212.72 | |
| 5541 | Service stations (with or without ancillary services) | 415.07 | 26,596.96 | |
| 5816 | Digital Goods: Games | 379.21 | 12,727.25 | |
| 5462 | Bakeries | 190.12 | 2,711.74 | |
| 5912 | Drug stores and pharmacies | 188.12 | 7,569.49 | |
| 5311 | Department stores | 174.11 | 4,028.13 | |
| 4900 | Utilities electric, gas, water and sanitary | 133.70 | 15,981.30 | |
| Medium Transacting Categories | 5451 | Dairies | 133.57 | 2,890.45 |
| 7322 | Debt collection agencies | 95.29 | 66,071.50 | |
| 5813 | Drinking places (alcoholic beverages) bars, taverns, night-clubs, cocktail lounges and discothques | 83.12 | 3,270.98 | |
| 5441 | Candy, nut and confectionery shops | 80.56 | 1,294.48 | |
| 5422 | Freezer and locker meat provisioners | 67.11 | 2,288.59 | |
| 7622 | Electronics repair shops | 66.96 | 2,213.79 | |
| 4812 | Telecommunication equipment and telephone sales | 65.56 | 3,716.29 | |
| 5921 | Package shops beer, wine and liquor | 64.47 | 2,821.94 | |
| 4899 | Cable and other pay television services | 63.80 | 1,622.35 | |
| 5993 | Cigar shops and stands | 62.57 | 471.70 | |
| All Other Categories | 5262 | Online Marketplaces | 58.37 | 5,262.53 |
| 5732 | Electronics shops | 57.98 | 9,123.39 | |
| 5137 | Mens, womens and childrens uniforms and commercial clothing | 55.43 | 5,086.56 | |
| 6211 | Securities brokers and dealers | 54.54 | 53,248.50 | |
| 7230 | Beauty and barber shops | 53.61 | 1,570.15 | |
| 9399 | Government services not elsewhere classified | 51.88 | 5,532.61 | |
| 4112 | Passenger railways | 49.23 | 2,941.98 | |
| 5331 | Variety stores | 45.74 | 2,630.95 | |
| 6012 | Financial institutions merchandise and services | 44.29 | 17,618.46 | |
| Others | 1,691.77 | 2,09,119.79 | ||
| Total | 8,804.83 | 5,56,701.66 | ||
| State-wise UPI Product Statistics* (May'24) | |||||
|---|---|---|---|---|---|
| Sr. No. | State / Union Territory | Volume (in Mn ) | Volume Contribution (%) | Value (in Cr.) | Value Contribution (%) |
| 1 | MAHARASHTRA | 1,857.65 | 13.24% | 2,53,405.96 | 12.39% |
| 2 | KARNATAKA | 1,155.25 | 8.23% | 1,62,894.87 | 7.97% |
| 3 | UTTAR PRADESH | 1,064.60 | 7.58% | 1,41,188.23 | 6.90% |
| 4 | TELANGANA | 870.16 | 6.20% | 1,41,990.78 | 6.94% |
| 5 | TAMIL NADU | 671.77 | 4.79% | 1,07,752.55 | 5.27% |
| 6 | RAJASTHAN | 630.93 | 4.50% | 94,794.85 | 4.64% |
| 7 | MADHYA PRADESH | 600.07 | 4.28% | 80,623.19 | 3.94% |
| 8 | ANDHRA PRADESH | 526.34 | 3.75% | 98,342.90 | 4.81% |
| 9 | DELHI | 500.74 | 3.57% | 59,874.83 | 2.93% |
| 10 | BIHAR | 495.22 | 3.53% | 75,277.17 | 3.68% |
| 11 | GUJARAT | 457.40 | 3.26% | 70,407.04 | 3.44% |
| 12 | WEST BENGAL | 404.75 | 2.88% | 66,216.65 | 3.24% |
| 13 | HARYANA | 378.41 | 2.70% | 54,556.73 | 2.67% |
| 14 | KERALA | 323.84 | 2.31% | 47,360.20 | 2.32% |
| 15 | ODISHA | 311.37 | 2.22% | 42,185.00 | 2.06% |
| 16 | PUNJAB | 203.58 | 1.45% | 34,023.49 | 1.66% |
| 17 | ASSAM | 185.21 | 1.32% | 23,768.30 | 1.16% |
| 18 | JHARKHAND | 163.73 | 1.17% | 22,163.69 | 1.08% |
| 19 | CHHATTISGARH | 138.69 | 0.99% | 18,325.33 | 0.90% |
| 20 | UTTARAKHAND | 114.22 | 0.81% | 14,717.76 | 0.72% |
| 21 | JAMMU AND KASHMIR | 67.16 | 0.48% | 9,133.63 | 0.45% |
| 22 | HIMACHAL PRADESH | 61.56 | 0.44% | 7,654.18 | 0.37% |
| 23 | CHANDIGARH | 30.06 | 0.21% | 3,817.52 | 0.19% |
| 24 | GOA | 29.77 | 0.21% | 4,238.40 | 0.21% |
| 25 | ARUNACHAL PRADESH | 15.39 | 0.11% | 2,353.22 | 0.12% |
| 26 | PUDUCHERRY | 15.09 | 0.11% | 2,147.50 | 0.11% |
| 27 | TRIPURA | 10.98 | 0.08% | 1,615.12 | 0.08% |
| 28 | MEGHALAYA | 10.73 | 0.08% | 1,563.37 | 0.08% |
| 29 | DADRA & NAGAR HAVELI & DAMAN & DIU | 10.13 | 0.07% | 1,049.42 | 0.05% |
| 30 | NAGALAND | 9.68 | 0.07% | 1,838.71 | 0.09% |
| 31 | MANIPUR | 8.71 | 0.06% | 2,161.90 | 0.11% |
| 32 | MIZORAM | 7.11 | 0.05% | 1,378.69 | 0.07% |
| 33 | SIKKIM | 6.38 | 0.05% | 1,051.32 | 0.05% |
| 34 | LADAKH | 3.36 | 0.02% | 653.08 | 0.03% |
| 35 | ANDAMAN & NICOBAR | 3.01 | 0.02% | 544.81 | 0.03% |
| 36 | LAKSHADWEEP | 0.37 | 0.00% | 48.44 | 0.00% |
| 37 | UNCLASSIFIED# | 2,692.43 | 19.18% | 3,93,818.21 | 19.26% |
| UPI Remitter Banks - Top 50 Banks (Apr'24) | |||||||
|---|---|---|---|---|---|---|---|
| Sr. No. | UPI Remitter Banks (Apr-2024) | Total Volume (In Mn) | Approved % | BD % | TD% | Total Debit Reversal Count (In Mn) | Debit Reversal Success % |
| 1 | State Bank Of India | 3581.27 | 94.10% | 5.01% | 0.89% | 19.18 | 93.66% |
| 2 | HDFC BANK LTD | 1157.04 | 95.82% | 4.08% | 0.09% | 4.42 | 98.73% |
| 3 | Bank of Baroda | 898.17 | 90.39% | 8.02% | 1.59% | 8.48 | 81.39% |
| 4 | Union Bank of India | 837.24 | 93.13% | 5.28% | 1.59% | 7.04 | 45.38% |
| 5 | Punjab National Bank | 741.90 | 92.96% | 5.93% | 1.11% | 4.1 | 83.01% |
| 6 | Kotak Mahindra Bank | 725.32 | 91.77% | 6.45% | 1.78% | 7.04 | 44.42% |
| 7 | Canara Bank | 642.10 | 93.39% | 5.95% | 0.66% | 4.15 | 72.05% |
| 8 | Axis Bank Ltd. | 609.02 | 95.74% | 4.23% | 0.03% | 2.1 | 96.79% |
| 9 | ICICI Bank | 599.22 | 96.37% | 3.55% | 0.08% | 2.19 | 91.25% |
| 10 | Bank of India | 439.70 | 93.67% | 5.02% | 1.31% | 2.61 | 70.73% |
| 11 | Indian Bank | 407.28 | 93.97% | 5.88% | 0.15% | 1.67 | 93.94% |
| 12 | Airtel Payments Bank | 395.64 | 90.62% | 8.66% | 0.72% | 2.03 | 95.18% |
| 13 | India Post Payment Bank | 270.23 | 82.88% | 15.95% | 1.16% | 1.90 | 54.96% |
| 14 | Federal Bank | 206.55 | 94.70% | 5.26% | 0.04% | 0.71 | 99.58% |
| 15 | Central Bank Of India | 200.60 | 85.38% | 10.79% | 3.83% | 3.30 | 45.28% |
| 16 | Indian Overseas Bank | 187.73 | 93.24% | 5.02% | 1.74% | 1.25 | 89.65% |
| 17 | UCO Bank | 171.92 | 93.70% | 6.14% | 0.16% | 1.10 | 80.12% |
| 18 | Bank of Maharashtra | 151.41 | 93.14% | 5.47% | 1.39% | 0.97 | 71.96% |
| 19 | IDBI Bank Limited | 151.25 | 94.24% | 5.24% | 0.51% | 1.38 | 46.04% |
| 20 | INDUSIND BANK | 150.57 | 92.05% | 7.07% | 0.89% | 1.03 | 93.86% |
| 21 | Fino Payments Bank Limited | 134.12 | 90.89% | 8.59% | 0.51% | 0.78 | 75.50% |
| 22 | Yes Bank Ltd | 106.01 | 92.93% | 6.53% | 0.53% | 0.41 | 76.06% |
| 23 | Karnataka Bank | 105.44 | 92.61% | 6.33% | 1.05% | 0.62 | 74.86% |
| 24 | IDFC FIRST Bank | 83.34 | 92.89% | 6.98% | 0.13% | 0.00 | 0.00% |
| 25 | Karur Vysya Bank | 65.73 | 93.97% | 5.82% | 0.22% | 0.29 | 83.65% |
| 26 | Jammu and Kashmir Bank | 58.65 | 94.07% | 4.77% | 1.16% | 0.50 | 40.95% |
| 27 | Bandhan Bank | 55.96 | 92.46% | 5.73% | 1.81% | 0.32 | 96.90% |
| 28 | South Indian Bank | 52.51 | 95.40% | 4.47% | 0.12% | 0.16 | 94.38% |
| 29 | Tri O Tech Solutions Private Limited | 46.64 | 100.00% | 0.00% | 0.00% | 0.00 | 0.00% |
| 30 | AU small Finance Bank | 45.86 | 92.76% | 6.19% | 1.05% | 0.30 | 83.29% |
| 31 | Ujjivan Small Finance Bank | 42.92 | 94.15% | 5.62% | 0.24% | 0.20 | 96.40% |
| 32 | City Union Bank | 39.67 | 92.80% | 6.91% | 0.29% | 0.14 | 95.58% |
| 33 | Tamilnad Mercantile Bank | 36.11 | 91.84% | 7.57% | 0.59% | 0.13 | 87.60% |
| 34 | Punjab and Sind Bank | 34.51 | 82.94% | 8.05% | 9.01% | 1.29 | 23.91% |
| 35 | Equitas Bank | 32.32 | 92.77% | 7.15% | 0.07% | 0.15 | 96.09% |
| 36 | Andhra Pradesh Grameena Vikas Bank | 29.08 | 85.16% | 13.06% | 1.78% | 0.19 | 77.26% |
| 37 | Kerala Gramin Bank | 27.50 | 92.37% | 6.21% | 1.42% | 0.20 | 59.83% |
| 38 | Pragathi Krishna Gramin Bank | 26.83 | 88.21% | 8.07% | 3.72% | 0.47 | 43.83% |
| 39 | DBS Bank India Limited | 26.42 | 94.37% | 5.46% | 0.17% | 0.11 | 80.06% |
| 40 | Maharashtra Gramin Bank | 25.64 | 85.76% | 11.70% | 2.54% | 0.14 | 60.83% |
| 41 | Rajasthan Marudhara Gramin Bank | 24.19 | 86.99% | 12.02% | 0.99% | 0.12 | 80.01% |
| 42 | Standard Chartered | 24.01 | 96.49% | 2.85% | 0.66% | 0.09 | 82.30% |
| 43 | Saraswat Bank | 23.34 | 94.90% | 4.48% | 0.62% | 0.11 | 75.37% |
| 44 | Baroda UP Gramin Bank | 22.48 | 75.41% | 9.17% | 15.41% | 0.78 | 18.33% |
| 45 | Fincare Small Finance Bank Ltd | 21.68 | 84.95% | 14.46% | 0.59% | 0.13 | 90.47% |
| 46 | ESAF Small Finance Bank Ltd. | 21.48 | 94.68% | 4.92% | 0.40% | 0.10 | 92.16% |
| 47 | Citi Bank | 19.73 | 96.53% | 3.11% | 0.36% | 0.08 | 98.72% |
| 48 | Sarva Haryana Gramin Bank | 18.34 | 91.76% | 7.50% | 0.74% | 0.12 | 67.26% |
| 49 | Andhra Pragathi Grameena Bank | 18.19 | 79.51% | 14.58% | 5.92% | 0.23 | 32.75% |
| 50 | RBL Bank Limited | 15.10 | 89.02% | 10.26% | 0.72% | 0.00 | NA |
| UPI Beneficiary Banks - Top 50 Banks (Apr'24) | |||||||
|---|---|---|---|---|---|---|---|
| Sr.No. | UPI Beneficiary Banks (Apr-2024) | Total Volume (In Mn) | Approved % | BD% | TD% | Deemed Approved % | |
| 1 | Yes Bank Ltd | 5,076.40 | 99.97% | 0.02% | 0.01% | 0.00% | |
| 2 | State Bank Of India | 1,512.29 | 99.01% | 0.11% | 0.89% | 0.18% | |
| 3 | Axis Bank Ltd. | 1,248.35 | 99.92% | 0.08% | 0.00% | 0.04% | |
| 4 | HDFC BANK LTD | 625.05 | 98.74% | 1.19% | 0.07% | 0.02% | |
| 5 | ICICI Bank | 606.73 | 99.58% | 0.40% | 0.02% | 0.02% | |
| 6 | Bank of Baroda | 376.04 | 98.51% | 1.01% | 0.49% | 0.31% | |
| 7 | Federal Bank | 373.70 | 99.74% | 0.23% | 0.03% | 0.00% | |
| 8 | Union Bank of India | 346.48 | 97.99% | 0.13% | 1.88% | 0.44% | |
| 9 | Punjab National Bank | 311.53 | 98.62% | 0.39% | 0.99% | 0.20% | |
| 10 | Canara Bank | 297.27 | 98.17% | 1.24% | 0.59% | 0.21% | |
| 11 | Kotak Mahindra Bank | 283.22 | 97.82% | 1.13% | 1.05% | 0.33% | |
| 12 | Airtel Payments Bank | 253.57 | 99.19% | 0.23% | 0.58% | 0.12% | |
| 13 | Indian Bank | 220.90 | 98.97% | 0.91% | 0.11% | 0.13% | |
| 14 | Bank of India | 197.52 | 98.76% | 0.40% | 0.84% | 0.16% | |
| 15 | INDUSIND BANK | 124.15 | 98.54% | 0.83% | 0.64% | 0.10% | |
| 16 | India Post Payment Bank | 111.72 | 98.04% | 1.30% | 0.65% | 0.31% | |
| 17 | Central Bank Of India | 92.14 | 97.91% | 0.36% | 1.73% | 0.52% | |
| 18 | Indian Overseas Bank | 87.08 | 98.24% | 0.45% | 1.31% | 0.35% | |
| 19 | UCO Bank | 84.09 | 98.49% | 0.70% | 0.81% | 0.09% | |
| 20 | Fino Payments Bank Limited | 65.46 | 96.15% | 3.18% | 0.66% | 0.07% | |
| 21 | IDBI Bank Limited | 65.04 | 98.63% | 0.44% | 0.93% | 0.51% | |
| 22 | Bank of Maharashtra | 60.58 | 98.65% | 0.19% | 1.16% | 0.20% | |
| 23 | RBL Bank Limited | 52.02 | 97.84% | 2.01% | 0.15% | 0.07% | |
| 24 | Karnataka Bank | 46.09 | 97.89% | 1.23% | 0.88% | 0.09% | |
| 25 | IDFC FIRST Bank | 35.26 | 98.60% | 1.28% | 0.11% | 0.04% | |
| 26 | Karur Vysya Bank | 34.16 | 98.29% | 1.19% | 0.52% | 0.08% | |
| 27 | Bandhan Bank | 33.71 | 97.87% | 0.28% | 1.85% | 0.07% | |
| 28 | South Indian Bank | 32.20 | 98.40% | 1.49% | 0.11% | 0.02% | |
| 29 | AU small Finance Bank | 28.54 | 96.21% | 3.06% | 0.73% | 0.13% | |
| 30 | Jammu and Kashmir Bank | 27.28 | 99.07% | 0.66% | 0.28% | 0.28% | |
| 31 | Tamilnad Mercantile Bank | 23.83 | 99.39% | 0.10% | 0.51% | 0.03% | |
| 32 | Tri O Tech Solutions Private Limited | 23.07 | 95.36% | 4.50% | 0.15% | 0.02% | |
| 33 | Ujjivan Small Finance Bank | 21.39 | 98.93% | 0.92% | 0.15% | 0.11% | |
| 34 | City Union Bank | 20.60 | 97.95% | 1.82% | 0.24% | 0.02% | |
| 35 | Kerala Gramin Bank | 14.82 | 98.92% | 0.30% | 0.77% | 0.54% | |
| 36 | Punjab and Sind Bank | 14.56 | 92.73% | 0.79% | 6.48% | 2.90% | |
| 37 | Equitas Small Finance Bank | 14.05 | 98.23% | 1.50% | 0.27% | 0.02% | |
| 38 | Andhra Pradesh Grameena Vikas Bank | 13.65 | 98.85% | 0.56% | 0.59% | 0.08% | |
| 39 | Pragathi Krishna Gramin Bank | 13.14 | 97.54% | 0.40% | 2.07% | 1.21% | |
| 40 | Jio Payments Bank | 13.01 | 98.77% | 0.37% | 0.86% | 0.47% | |
| 41 | Maharashtra Gramin Bank | 11.84 | 97.53% | 0.33% | 2.14% | 0.29% | |
| 42 | DBS Bank India Limited | 11.43 | 97.26% | 1.79% | 0.95% | 0.08% | |
| 43 | Rajasthan Marudhara Gramin Bank | 11.34 | 99.43% | 0.38% | 0.19% | 0.04% | |
| 44 | Baroda UP Gramin Bank | 11.01 | 88.10% | 0.65% | 11.26% | 2.49% | |
| 45 | Fincare Small Finance Bank Ltd | 10.50 | 96.19% | 3.29% | 0.53% | 0.05% | |
| 46 | ESAF Small Finance Bank Ltd. | 10.43 | 99.68% | 0.13% | 0.19% | 0.11% | |
| 47 | Citi Bank | 9.88 | 99.81% | 0.00% | 0.19% | 0.24% | |
| 48 | Andhra Pragathi Grameena Bank | 9.29 | 95.43% | 1.17% | 3.40% | 0.12% | |
| 49 | Sarva Haryana Gramin Bank | 7.88 | 99.00% | 0.38% | 0.62% | 0.16% | |
| 50 | Saraswat Bank | 7.64 | 96.99% | 2.39% | 0.62% | 0.14% | |
| UPI Apps (Apr'24) | |||||||||||
|---|---|---|---|---|---|---|---|---|---|---|---|
| Sr.No. | Application Name | Customer Initiated Transactions | B2C Transactions | B2B Transactions | On-us Transactions | Total | |||||
| Volume (Mn) | Value (Cr) | Volume (Mn) | Value (Cr) | Volume (Mn) | Value (Cr) | Volume (Mn) | Value (Cr) | Volume (Mn) | Value (Cr) | ||
| 1 | PhonePe | 6,500.14 | 10,01,679.63 | 0.00 | 0.00 | 0.00 | 0.00 | 0.00 | 0.00 | 6,500.14 | 10,01,679.63 |
| 2 | Google Pay | 5,027.32 | 6,94,189.68 | 0.00 | 0.00 | 0.00 | 0.00 | 0.00 | 0.00 | 5,027.32 | 6,94,189.68 |
| 3 | Paytm | 1,117.13 | 1,22,554.24 | 0.00 | 0.01 | 0.00 | 0.00 | 0.00 | 0.00 | 1,117.13 | 1,22,554.25 |
| 4 | Cred | 138.46 | 43,233.21 | 0.00 | 0.00 | 0.00 | 0.00 | 0.00 | 0.00 | 138.46 | 43,233.21 |
| 5 | Axis Bank Apps | 13.53 | 3,313.28 | 56.27 | 3,168.22 | 0.01 | 1.74 | 0.00 | 0.00 | 69.80 | 6,483.24 |
| 6 | Amazon Pay | 64.33 | 6,784.82 | 0.00 | 0.00 | 0.00 | 0.00 | 0.00 | 0.00 | 64.33 | 6,784.82 |
| 7 | ICICI Bank Apps | 35.39 | 14,357.18 | 3.57 | 336.49 | 8.45 | 11,945.21 | 0.00 | 0.00 | 47.41 | 26,638.88 |
| 8 | Fampay | 46.64 | 588.00 | 0.00 | 0.00 | 0.00 | 0.00 | 0.00 | 0.00 | 46.64 | 588.00 |
| 9 | Kotak Mahindra Bank Apps | 41.54 | 6,101.88 | 0.00 | 0.00 | 0.00 | 0.00 | 0.00 | 0.00 | 41.54 | 6,101.88 |
| 10 | HDFC Bank Apps | 35.99 | 7,689.44 | 0.00 | 0.00 | 0.01 | 0.32 | 0.00 | 0.00 | 35.99 | 7,689.76 |
| 11 | 34.12 | 2,815.68 | 0.00 | 0.00 | 0.00 | 0.00 | 0.00 | 0.00 | 34.12 | 2,815.68 | |
| 12 | BHIM | 25.48 | 8,670.52 | 0.00 | 0.00 | 0.00 | 0.00 | 0.00 | 0.00 | 25.48 | 8,670.52 |
| 13 | Yes Bank Apps | 21.99 | 11,978.36 | 0.00 | 0.00 | 0.27 | 31.04 | 0.00 | 0.00 | 22.26 | 12,009.40 |
| 14 | Airtel Payments Bank Apps | 16.19 | 1,243.65 | 0.00 | 0.00 | 0.00 | 0.40 | 0.00 | 0.09 | 16.19 | 1,244.14 |
| 15 | Navi | 15.10 | 402.92 | 0.00 | 0.00 | 0.00 | 0.00 | 0.00 | 0.00 | 15.10 | 402.92 |
| 16 | Bajaj Finserv | 10.29 | 1,819.55 | 0.00 | 0.00 | 0.00 | 0.00 | 0.00 | 0.00 | 10.29 | 1,819.55 |
| 17 | Mobikwik | 9.76 | 2,248.19 | 0.00 | 0.00 | 0.00 | 0.00 | 0.00 | 0.00 | 9.76 | 2,248.19 |
| 18 | Groww | 8.02 | 5,452.72 | 0.00 | 0.00 | 0.00 | 0.00 | 0.00 | 0.00 | 8.02 | 5,452.72 |
| 19 | Slice | 7.51 | 608.62 | 0.00 | 0.00 | 0.00 | 0.00 | 0.00 | 0.00 | 7.51 | 608.62 |
| 20 | State Bank of India Apps | 6.49 | 2,385.64 | 0.00 | 0.00 | 0.04 | 1.14 | 0.00 | 0.00 | 6.53 | 2,386.79 |
| 21 | IDFC Bank Apps | 6.45 | 1,581.78 | 0.00 | 0.00 | 0.00 | 0.00 | 0.00 | 0.00 | 6.45 | 1,581.78 |
| 22 | Samsung Pay | 6.30 | 527.40 | 0.00 | 0.00 | 0.00 | 0.00 | 0.00 | 0.00 | 6.30 | 527.40 |
| 23 | Federal Bank Apps | 6.14 | 821.80 | 0.00 | 0.00 | 0.00 | 0.00 | 0.00 | 0.00 | 6.14 | 821.80 |
| 24 | Jupiter | 5.92 | 710.69 | 0.00 | 0.00 | 0.00 | 0.00 | 0.00 | 0.00 | 5.92 | 710.69 |
| 25 | India Post Payments Bank Apps | 5.08 | 687.52 | 0.00 | 0.00 | 0.00 | 0.00 | 0.00 | 0.00 | 5.08 | 687.52 |
| 26 | Flipkart UPI | 3.46 | 174.73 | 0.00 | 0.00 | 0.00 | 0.00 | 0.00 | 0.00 | 3.46 | 174.73 |
| 27 | Deutsche Bank Apps | 3.28 | 441.56 | 0.00 | 0.00 | 0.00 | 0.02 | 0.00 | 0.00 | 3.28 | 441.58 |
| 28 | Canara Bank Apps | 3.03 | 812.15 | 0.00 | 0.00 | 0.00 | 0.00 | 0.00 | 0.00 | 3.03 | 812.15 |
| 29 | Timepay | 2.15 | 24.14 | 0.00 | 0.00 | 0.00 | 0.10 | 0.00 | 0.00 | 2.16 | 24.25 |
| 30 | Jio Payments Bank Apps | 1.87 | 164.17 | 0.00 | 0.00 | 0.00 | 0.00 | 0.00 | 0.00 | 1.87 | 164.17 |
| 31 | Punjab National Bank Apps | 1.66 | 419.99 | 0.00 | 0.00 | 0.00 | 0.00 | 0.00 | 0.00 | 1.66 | 419.99 |
| 32 | RBL Bank Apps | 1.46 | 529.18 | 0.00 | 0.01 | 0.11 | 117.10 | 0.00 | 0.00 | 1.57 | 646.29 |
| 33 | Indian Bank Apps | 1.50 | 310.69 | 0.00 | 0.00 | 0.00 | 6.71 | 0.00 | 0.00 | 1.50 | 317.40 |
| 34 | Union Bank Apps | 1.25 | 525.02 | 0.00 | 0.00 | 0.00 | 0.00 | 0.00 | 0.00 | 1.25 | 525.02 |
| 35 | Omnicard | 1.06 | 37.27 | 0.00 | 0.00 | 0.00 | 0.00 | 0.00 | 0.00 | 1.06 | 37.27 |
| 36 | Bank of Baroda Apps | 0.99 | 459.50 | 0.00 | 0.00 | 0.00 | 8.27 | 0.00 | 0.00 | 0.99 | 467.77 |
| 37 | Central Bank of India Apps | 0.89 | 204.45 | 0.00 | 0.00 | 0.00 | 0.00 | 0.00 | 0.00 | 0.89 | 204.45 |
| 38 | AU Small Finance Bank Apps | 0.80 | 257.99 | 0.00 | 0.00 | 0.00 | 0.00 | 0.00 | 0.00 | 0.80 | 257.99 |
| 39 | Go Kiwi | 0.58 | 92.87 | 0.00 | 0.00 | 0.00 | 0.00 | 0.00 | 0.00 | 0.58 | 92.87 |
| 40 | DBS Digibank Apps | 0.46 | 182.52 | 0.00 | 0.00 | 0.00 | 0.38 | 0.00 | 0.00 | 0.47 | 182.89 |
| 41 | South Indian Bank Apps | 0.43 | 129.71 | 0.00 | 0.00 | 0.00 | 0.00 | 0.00 | 0.00 | 0.43 | 129.71 |
| 42 | Shriram One | 0.40 | 37.49 | 0.00 | 0.00 | 0.00 | 0.00 | 0.00 | 0.00 | 0.40 | 37.49 |
| 43 | Fino Payments bank Apps | 0.35 | 49.47 | 0.00 | 0.00 | 0.00 | 0.00 | 0.00 | 0.00 | 0.35 | 49.47 |
| 44 | IndusInd Bank Apps | 1.06 | 191.64 | 0 | 0 | 0 | 0.26 | 0 | 0 | 1.06 | 191.90 |
| 45 | HSBC Bank Apps | 0.32 | 126.55 | 0.00 | 0.05 | 0.00 | 0.00 | 0.00 | 0.00 | 0.32 | 126.59 |
| 46 | TataNeu | 0.32 | 34.06 | 0.00 | 0.00 | 0.00 | 0.00 | 0.00 | 0.00 | 0.32 | 34.06 |
| 47 | Bank of India Apps | 0.21 | 87.25 | 0.00 | 0.00 | 0.00 | 0.00 | 0.00 | 0.00 | 0.21 | 87.25 |
| 48 | Standard Chartered Bank Apps | 0.16 | 105.48 | 0.00 | 0.00 | 0.00 | 0.03 | 0.00 | 0.00 | 0.16 | 105.51 |
| 49 | UCO Bank Apps | 0.16 | 54.30 | 0.00 | 0.00 | 0.00 | 0.00 | 0.00 | 0.00 | 0.16 | 54.30 |
| 50 | Digikhata | 0.15 | 51.08 | 0.00 | 0.00 | 0.00 | 0.00 | 0.00 | 0.00 | 0.15 | 51.08 |
| 51 | Karnataka Bank Apps | 0.15 | 27.18 | 0.00 | 0.00 | 0.00 | 0.00 | 0.00 | 0.00 | 0.15 | 27.18 |
| 52 | Jupiter Edge | 0.14 | 22.88 | 0.00 | 0.00 | 0.00 | 0.00 | 0.00 | 0.00 | 0.14 | 22.88 |
| 53 | Dhani | 0.13 | 7.44 | 0.00 | 0.00 | 0.00 | 0.00 | 0.00 | 0.00 | 0.13 | 7.44 |
| 54 | Indian Overseas Bank Apps | 0.11 | 30.10 | 0.00 | 0.00 | 0.00 | 0.00 | 0.00 | 0.00 | 0.11 | 30.10 |
| 55 | Ultracash | 0.09 | 6.16 | 0.00 | 0.00 | 0.00 | 0.00 | 0.00 | 0.00 | 0.09 | 6.16 |
| 56 | Tamilnad Mercantile Bank Apps | 0.09 | 24.69 | 0.00 | 0.00 | 0.00 | 0.00 | 0.00 | 0.00 | 0.09 | 24.69 |
| 57 | City Union Bank Apps | 0.08 | 26.60 | 0.00 | 0.00 | 0.00 | 0.00 | 0.00 | 0.00 | 0.08 | 26.60 |
| 58 | NSDL Payments Bank Apps | 0.08 | 11.88 | 0.00 | 0.00 | 0.00 | 0.00 | 0.00 | 0.00 | 0.08 | 11.88 |
| 59 | Citi Bank Apps | 0.06 | 69.18 | 0.00 | 0.00 | 0.00 | 0.01 | 0.00 | 0.00 | 0.06 | 69.19 |
| 60 | IDBI Bank Apps | 0.06 | 20.15 | 0.00 | 0.00 | 0.00 | 0.00 | 0.00 | 0.00 | 0.06 | 20.15 |
| 61 | Bank of Maharashtra Apps | 0.06 | 13.96 | 0.00 | 0.00 | 0.00 | 0.10 | 0.00 | 0.00 | 0.06 | 14.06 |
| 62 | Karur Vysya Bank Apps | 0.05 | 18.94 | 0.00 | 0.00 | 0.00 | 0.00 | 0.00 | 0.00 | 0.05 | 18.94 |
| 63 | MakeMyTrip | 0.04 | 19.32 | 0.00 | 0.00 | 0.00 | 0.00 | 0.00 | 0.00 | 0.04 | 19.32 |
| 64 | Go Niyo | 0.04 | 16.77 | 0.00 | 0.00 | 0.00 | 0.00 | 0.00 | 0.00 | 0.04 | 16.77 |
| 65 | Equitas Small Finance Bank Apps | 0.03 | 25.52 | 0.00 | 0.00 | 0.00 | 0.00 | 0.00 | 0.00 | 0.03 | 25.52 |
| 66 | Punjab Sind Bank Apps | 0.03 | 12.15 | 0.00 | 0.00 | 0.00 | 0.00 | 0.00 | 0.00 | 0.03 | 12.15 |
| 67 | Allahabad Bank Apps | 0.02 | 6.18 | 0.00 | 0.00 | 0.00 | 0.00 | 0.00 | 0.00 | 0.02 | 6.18 |
| 68 | Fave | 0.02 | 1.16 | 0.00 | 0.00 | 0.00 | 0.00 | 0.00 | 0.00 | 0.02 | 1.16 |
| 69 | Cheq | 0.01 | 1.13 | 0.00 | 0.00 | 0.00 | 0.00 | 0.00 | 0.00 | 0.01 | 1.13 |
| 70 | Other Apps | 1.03 | 108.18 | 0.00 | 0.00 | 0.15 | 4.42 | 0.00 | 0.00 | 1.18 | 112.60 |
Note:-
| UPI P2P and P2M Transactions | ||||||
|---|---|---|---|---|---|---|
| Month | Total | P2P | P2M | |||
| Volume (Mn) | Value (Cr) | Volume (Mn) | Value (Cr) | Volume (Mn) | Value (Cr) | |
| Apr’24 | 13,303.99 | 19,64,464.52 | 4,996.52 | 14,33,520.79 | 8,307.47 | 5,30,943.73 |

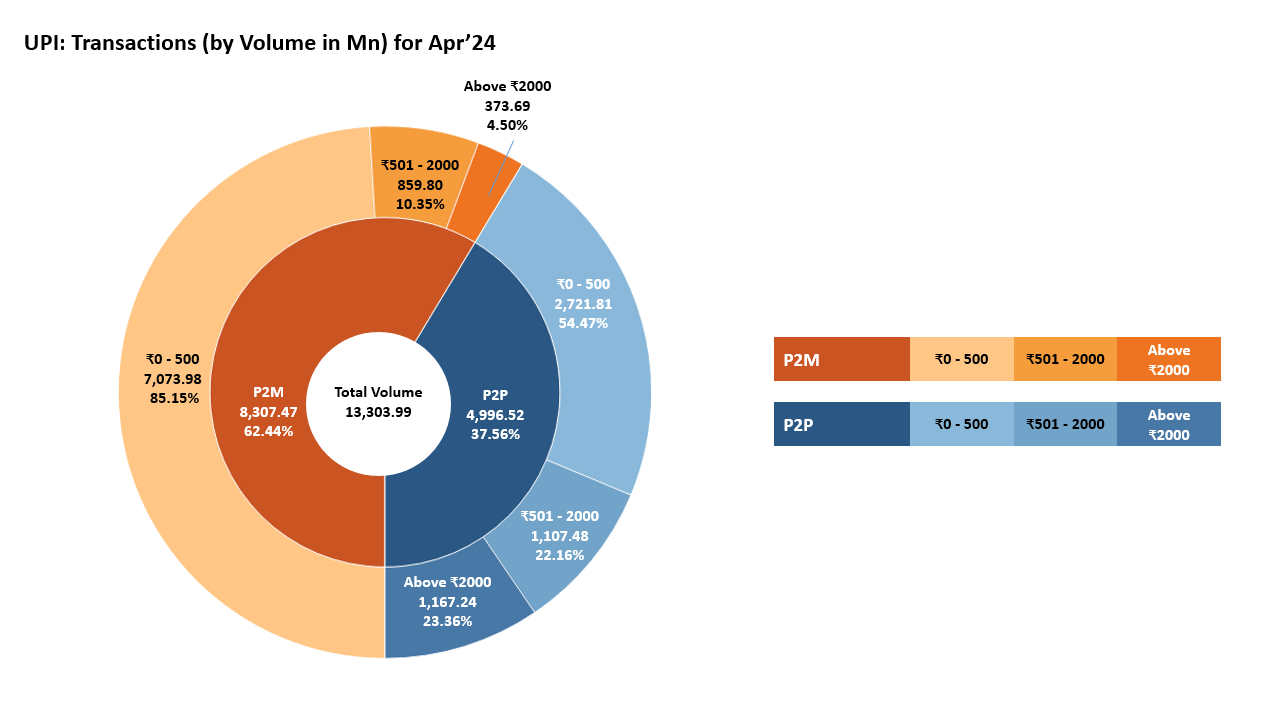
| UPI Payer PSP Performance (Apr'24) | |||||
|---|---|---|---|---|---|
| Sr. No. | Payer PSP | Total Volume (In Mn) | Approved % | BD % | TD % |
| 1 | YES BANK LTD | 5118.50 | 92.73% | 7.10% | 0.17% |
| 2 | AXIS BANK LTD. | 3794.19 | 94.05% | 5.75% | 0.19% |
| 3 | ICICI BANK | 2627.42 | 93.80% | 6.01% | 0.19% |
| 4 | STATE BANK OF INDIA | 1231.71 | 95.71% | 4.18% | 0.11% |
| 5 | HDFC BANK LTD | 1215.36 | 95.24% | 4.63% | 0.12% |
| 6 | TRI O TECH SOLUTIONS PRIVATE LIMITED | 46.64 | 100.00% | 0.00% | 0.00% |
| 7 | KOTAK MAHINDRA BANK | 41.81 | 100.00% | 0.00% | 0.00% |
| 8 | BHIM | 27.42 | 92.90% | 6.85% | 0.26% |
| 9 | AIRTEL PAYMENTS BANK | 16.92 | 95.70% | 4.22% | 0.07% |
| 10 | IDBI BANK LIMITED | 6.85 | 99.12% | 0.87% | 0.01% |
| 11 | FEDERAL BANK | 6.28 | 97.90% | 2.08% | 0.03% |
| 12 | RBL Bank | 6.28 | 95.22% | 4.61% | 0.17% |
| 13 | INDIA POST PAYMENT BANK | 5.09 | 99.98% | 0.02% | 0.00% |
| 14 | GARAGEPRENEURS INTERNET PRIVATE LIMITED | 3.88 | 100.00% | 0.00% | 0.00% |
| 15 | CANARA BANK | 3.36 | 95.42% | 4.23% | 0.35% |
| UPI Payee PSP Performance (Apr'24) | |||||
|---|---|---|---|---|---|
| Sr. No. | Payee PSP | Total Volume (In Mn) | Approved % | BD % | TD % |
| 1 | YES BANK LTD | 7639.57 | 93.55% | 6.28% | 0.16% |
| 2 | AXIS BANK LTD. | 2174.25 | 94.11% | 5.71% | 0.19% |
| 3 | ICICI BANK | 1461.34 | 93.53% | 6.29% | 0.18% |
| 4 | STATE BANK OF INDIA | 787.30 | 94.19% | 5.68% | 0.13% |
| 5 | HDFC BANK LTD | 726.18 | 94.85% | 4.99% | 0.16% |
| 6 | FEDERAL BANK | 306.19 | 96.74% | 3.10% | 0.16% |
| 7 | AIRTEL PAYMENTS BANK | 70.51 | 94.75% | 5.11% | 0.14% |
| 8 | INDUSIND BANK | 65.36 | 94.53% | 5.31% | 0.17% |
| 9 | COSMOS BANK | 61.64 | 90.73% | 9.08% | 0.19% |
| 10 | RBL BANK | 61.54 | 93.30% | 6.45% | 0.25% |
| 11 | KOTAK MAHINDRA BANK | 44.53 | 94.67% | 5.13% | 0.19% |
| 12 | CANARA BANK | 41.68 | 96.45% | 3.41% | 0.14% |
| 13 | INDIAN BANK | 37.22 | 92.12% | 7.66% | 0.22% |
| 14 | ONE MOBIKWIK SYSTEMS LIMITED | 26.80 | 96.47% | 3.39% | 0.14% |
| 15 | TRI O TECH SOLUTIONS PRIVATE LIMITED | 23.65 | 92.74% | 7.05% | 0.21% |
| UPI Merchant Category-wise Classification - April'24 (Arranged by Volume) | ||||
|---|---|---|---|---|
| Type | MCC | Description | Volume (in Mn) | Value (in Cr.) |
| High Transacting Categories | 5411 | Groceries and supermarkets | 1,880.41 | 46,114.78 |
| 5814 | Fast food restaurants | 814.23 | 10,437.20 | |
| 5812 | Eating places and restaurants | 730.27 | 11,861.15 | |
| 4814 | Telecommunication services, including local and long distance calls, credit card calls, calls through use of magnetic stripe reading telephones and faxes | 659.26 | 15,115.80 | |
| 5816 | Digital Goods: Games | 464.10 | 12,641.19 | |
| 5541 | Service stations (with or without ancillary services) | 391.99 | 24,997.65 | |
| 5912 | Drug stores and pharmacies | 179.10 | 6,972.03 | |
| 5462 | Bakeries | 175.43 | 2,463.67 | |
| 5311 | Department stores | 164.50 | 4,077.42 | |
| 5993 | Cigar shops and stands | 58.26 | 449.00 | |
| Medium Transacting Categories | 5451 | Dairies | 122.01 | 2,712.32 |
| 4900 | Utilities electric, gas, water and sanitary | 114.33 | 11,861.27 | |
| 7322 | Debt collection agencies | 88.05 | 64,239.88 | |
| 5813 | Drinking places (alcoholic beverages) bars, taverns, night-clubs, cocktail lounges and discothques | 75.55 | 2,939.38 | |
| 5441 | Candy, nut and confectionery shops | 73.39 | 1,209.99 | |
| 5921 | Package shops beer, wine and liquor | 57.55 | 2,424.71 | |
| 5422 | Freezer and locker meat provisioners | 56.72 | 1,969.32 | |
| 9399 | Government services not elsewhere classified | 47.88 | 5,626.48 | |
| 5262 | Online Marketplaces | 47.45 | 4,350.36 | |
| 5412 | Purchase of digital gold | 20.92 | 550.12 | |
| All Other Categories | 7622 | Electronics repair shops | 62.98 | 2,092.05 |
| 5137 | Mens, womens and childrens uniforms and commercial clothing | 58.46 | 6,115.12 | |
| 5732 | Electronics shops | 52.66 | 8,100.83 | |
| 7230 | Beauty and barber shops | 51.03 | 1,553.36 | |
| 4112 | Passenger railways | 46.58 | 2,682.00 | |
| 5691 | Mens and womens clothing shops | 44.66 | 5,810.00 | |
| 5331 | Variety stores | 41.15 | 2,435.99 | |
| 5651 | Family clothing shops | 40.19 | 3,611.32 | |
| 4121 | Taxi-cabs and limousines | 29.49 | 765.41 | |
| Others | 1,658.87 | 2,64,763.92 | ||
| Total | 8,307.47 | 5,30,943.73 | ||
| State-wise UPI Product Statistics* (Apr'24) | |||||
|---|---|---|---|---|---|
| Sr. No. | State / Union Territory | Volume (in Mn ) | Volume Contribution (%) | Value (in Cr.) | Value Contribution (%) |
| 1 | MAHARASHTRA | 1,779.25 | 13.37% | 2,45,463.14 | 12.50% |
| 2 | KARNATAKA | 1,095.55 | 8.23% | 1,53,489.72 | 7.81% |
| 3 | UTTAR PRADESH | 1,007.12 | 7.57% | 1,41,875.13 | 7.22% |
| 4 | TELANGANA | 851.14 | 6.40% | 1,38,376.57 | 7.04% |
| 5 | TAMIL NADU | 638.48 | 4.80% | 1,01,057.95 | 5.14% |
| 6 | RAJASTHAN | 586.35 | 4.41% | 89,437.41 | 4.55% |
| 7 | MADHYA PRADESH | 581.87 | 4.37% | 80,171.32 | 4.08% |
| 8 | ANDHRA PRADESH | 513.63 | 3.86% | 98,416.61 | 5.01% |
| 9 | BIHAR | 475.94 | 3.58% | 75,106.90 | 3.82% |
| 10 | DELHI | 463.58 | 3.48% | 58,505.66 | 2.98% |
| 11 | GUJARAT | 431.65 | 3.24% | 66,727.00 | 3.40% |
| 12 | WEST BENGAL | 387.08 | 2.91% | 64,939.85 | 3.31% |
| 13 | HARYANA | 349.90 | 2.63% | 50,557.95 | 2.57% |
| 14 | KERALA | 311.31 | 2.34% | 44,570.14 | 2.27% |
| 15 | ODISHA | 295.47 | 2.22% | 40,347.56 | 2.05% |
| 16 | PUNJAB | 187.49 | 1.41% | 30,985.40 | 1.58% |
| 17 | ASSAM | 171.13 | 1.29% | 23,893.99 | 1.22% |
| 18 | JHARKHAND | 158.97 | 1.19% | 22,618.61 | 1.15% |
| 19 | CHHATTISGARH | 129.73 | 0.98% | 17,607.35 | 0.90% |
| 20 | UTTARAKHAND | 106.39 | 0.80% | 13,493.01 | 0.69% |
| 21 | JAMMU AND KASHMIR | 60.25 | 0.45% | 8,502.35 | 0.43% |
| 22 | HIMACHAL PRADESH | 55.17 | 0.41% | 6,913.91 | 0.35% |
| 23 | GOA | 27.96 | 0.21% | 3,945.63 | 0.20% |
| 24 | CHANDIGARH | 27.90 | 0.21% | 3,619.80 | 0.18% |
| 25 | PUDUCHERRY | 14.08 | 0.11% | 2,006.90 | 0.10% |
| 26 | ARUNACHAL PRADESH | 12.69 | 0.10% | 2,321.35 | 0.12% |
| 27 | TRIPURA | 10.75 | 0.08% | 1,653.37 | 0.08% |
| 28 | MEGHALAYA | 9.69 | 0.07% | 1,479.23 | 0.08% |
| 29 | DADRA & NAGAR HAVELI & DAMAN & DIU | 9.42 | 0.07% | 990.81 | 0.05% |
| 30 | MANIPUR | 8.62 | 0.06% | 2,111.38 | 0.11% |
| 31 | NAGALAND | 8.16 | 0.06% | 1,632.88 | 0.08% |
| 32 | MIZORAM | 6.67 | 0.05% | 1,282.48 | 0.07% |
| 33 | SIKKIM | 5.39 | 0.04% | 891.00 | 0.05% |
| 34 | ANDAMAN & NICOBAR | 3.00 | 0.02% | 535.64 | 0.03% |
| 35 | LADAKH | 2.70 | 0.02% | 532.87 | 0.03% |
| 36 | LAKSHADWEEP | 0.36 | 0.00% | 49.41 | 0.00% |
| 37 | UNCLASSIFIED# | 2,519.12 | 18.94% | 3,68,354.23 | 18.75% |
| UPI Remitter Banks - Top 50 Banks (Mar'24) | |||||||
|---|---|---|---|---|---|---|---|
| Sr. No. | UPI Remitter Banks (Mar-2024) | Total Volume (In Mn) | Approved % | BD % | TD% | Total Debit Reversal Count (In Mn) | Debit Reversal Success % |
| 1 | State Bank Of India | 3557.54 | 94.99% | 4.70% | 0.32% | 16.59 | 95.04% |
| 2 | HDFC BANK LTD | 1158.51 | 96.13% | 3.86% | 0.01% | 4.26 | 99.60% |
| 3 | Bank of Baroda | 882.82 | 93.30% | 6.25% | 0.45% | 4.40 | 96.49% |
| 4 | Union Bank of India | 848.59 | 93.47% | 5.14% | 1.40% | 6.51 | 53.92% |
| 5 | Punjab National Bank | 728.08 | 94.22% | 5.54% | 0.23% | 3.49 | 99.11% |
| 6 | Kotak Mahindra Bank | 703.56 | 93.66% | 6.20% | 0.14% | 3.28 | 90.24% |
| 7 | Canara Bank | 642.81 | 93.72% | 5.91% | 0.37% | 3.68 | 81.79% |
| 8 | Axis Bank Ltd. | 630.13 | 96.07% | 3.93% | 0.01% | 2.14 | 97.72% |
| 9 | ICICI Bank | 603.62 | 96.40% | 3.52% | 0.09% | 2.07 | 95.68% |
| 10 | Bank of India | 434.19 | 94.63% | 5.03% | 0.34% | 2.23 | 84.44% |
| 11 | Indian Bank | 400.98 | 94.39% | 5.40% | 0.21% | 2.44 | 75.20% |
| 12 | Airtel Payments Bank | 387.91 | 91.25% | 8.63% | 0.12% | 2.14 | 95.89% |
| 13 | India Post Payment Bank | 312.23 | 80.17% | 13.85% | 5.98% | 3.15 | 46.99% |
| 14 | Federal Bank | 204.83 | 94.79% | 5.01% | 0.20% | 0.76 | 98.04% |
| 15 | Central Bank Of India | 200.37 | 85.98% | 10.69% | 3.33% | 2.61 | 51.15% |
| 16 | Indian Overseas Bank | 188.01 | 92.66% | 4.92% | 2.42% | 1.21 | 91.57% |
| 17 | UCO Bank | 171.87 | 93.19% | 5.90% | 0.91% | 1.34 | 57.58% |
| 18 | Bank of Maharashtra | 153.39 | 89.77% | 5.41% | 4.83% | 1.43 | 59.23% |
| 19 | IDBI Bank Limited | 151.70 | 93.27% | 5.26% | 1.47% | 0.99 | 70.17% |
| 20 | INDUSIND BANK | 142.64 | 92.76% | 6.76% | 0.47% | 0.91 | 92.70% |
| 21 | Fino Payments Bank Limited | 136.77 | 88.98% | 9.53% | 1.48% | 0.92 | 70.73% |
| 22 | Karnataka Bank | 106.23 | 92.83% | 6.07% | 1.10% | 0.61 | 71.09% |
| 23 | Yes Bank Ltd | 103.43 | 94.43% | 5.40% | 0.17% | 0.35 | 95.02% |
| 24 | Paytm Payments Bank | 98.18 | 89.73% | 10.25% | 0.03% | 0.35 | 96.43% |
| 25 | IDFC FIRST Bank | 83.30 | 92.99% | 6.72% | 0.28% | 0.39 | 82.51% |
| 26 | Karur Vysya Bank | 67.68 | 91.62% | 5.87% | 2.51% | 0.45 | 79.24% |
| 27 | Bandhan Bank | 54.03 | 93.13% | 5.90% | 0.97% | 0.30 | 98.34% |
| 28 | South Indian Bank | 53.06 | 95.66% | 4.30% | 0.04% | 0.15 | 96.38% |
| 29 | Jammu and Kashmir Bank | 52.39 | 94.19% | 5.01% | 0.80% | 0.40 | 58.67% |
| 30 | AU small Finance Bank | 45.20 | 93.76% | 5.01% | 1.23% | 0.35 | 91.10% |
| 31 | Tri O Tech Solutions Private Limited | 43.69 | 100.00% | 0.00% | 0.00% | 0.00 | 0.00% |
| 32 | Ujjivan Small Finance Bank | 42.64 | 94.16% | 5.62% | 0.22% | 0.21 | 95.46% |
| 33 | City Union Bank | 40.70 | 92.12% | 7.57% | 0.31% | 0.14 | 99.51% |
| 34 | Punjab and Sind Bank | 36.91 | 88.97% | 6.85% | 4.18% | 0.65 | 41.18% |
| 35 | Tamilnad Mercantile Bank | 36.68 | 91.40% | 6.86% | 1.75% | 0.23 | 52.03% |
| 36 | Equitas Bank | 32.26 | 92.46% | 7.26% | 0.28% | 0.17 | 96.21% |
| 37 | Andhra Pradesh Grameena Vikas Bank | 28.83 | 84.18% | 12.67% | 3.15% | 0.30 | 56.53% |
| 38 | Kerala Gramin Bank | 27.13 | 92.84% | 6.20% | 0.96% | 0.15 | 52.05% |
| 39 | DBS Bank India Limited | 26.67 | 94.70% | 5.04% | 0.26% | 0.11 | 81.96% |
| 40 | Pragathi Krishna Gramin Bank | 26.20 | 89.82% | 8.08% | 2.10% | 0.30 | 49.95% |
| 41 | Maharashtra Gramin Bank | 25.45 | 87.57% | 11.61% | 0.83% | 0.09 | 94.05% |
| 42 | Standard Chartered | 25.13 | 97.12% | 2.69% | 0.19% | 0.09 | 94.80% |
| 43 | Rajasthan Marudhara Gramin Bank | 24.86 | 83.35% | 11.87% | 4.78% | 0.29 | 41.00% |
| 44 | Saraswat Bank | 23.28 | 95.74% | 3.94% | 0.32% | 0.10 | 82.32% |
| 45 | Baroda UP Gramin Bank | 22.31 | 74.22% | 10.56% | 15.22% | 1.02 | 14.65% |
| 46 | ESAF Small Finance Bank Ltd. | 21.76 | 93.86% | 5.08% | 1.06% | 0.13 | 73.09% |
| 47 | Fincare Small Finance Bank Ltd | 21.32 | 85.10% | 14.43% | 0.47% | 0.12 | 94.35% |
| 48 | Citibank | 20.78 | 96.61% | 3.06% | 0.32% | 0.09 | 98.88% |
| 49 | Sarva Haryana Gramin Bank | 17.71 | 92.50% | 7.00% | 0.50% | 0.11 | 82.22% |
| 50 | Andhra Pragathi Grameena Bank | 17.33 | 84.52% | 13.38% | 2.10% | 0.14 | 53.68% |
| UPI Beneficiary Banks - Top 50 Banks (Mar'24) | |||||||
|---|---|---|---|---|---|---|---|
| Sr.No. | UPI Beneficiary Banks (Mar-2024) | Total Volume (In Mn) | Approved % | BD% | TD% | Deemed Approved % | |
| 1 | Yes Bank Ltd | 2,638.46 | 99.93% | 0.04% | 0.04% | 0.00% | |
| 2 | Paytm Payments Bank | 2,490.22 | 99.83% | 0.16% | 0.02% | 0.00% | |
| 3 | State Bank Of India | 1,524.71 | 99.59% | 0.13% | 0.28% | 0.04% | |
| 4 | Axis Bank Ltd. | 1,230.70 | 99.89% | 0.11% | 0.00% | 0.06% | |
| 5 | ICICI Bank | 647.55 | 99.55% | 0.40% | 0.05% | 0.04% | |
| 6 | HDFC BANK LTD | 643.37 | 98.79% | 1.19% | 0.02% | 0.02% | |
| 7 | Bank of Baroda | 372.75 | 99.56% | 0.31% | 0.13% | 0.18% | |
| 8 | Federal Bank | 370.03 | 99.62% | 0.28% | 0.11% | 0.01% | |
| 9 | Union Bank of India | 357.49 | 99.01% | 0.13% | 0.86% | 0.30% | |
| 10 | Punjab National Bank | 312.24 | 99.55% | 0.34% | 0.11% | 0.09% | |
| 11 | Canara Bank | 303.29 | 98.06% | 1.60% | 0.35% | 0.19% | |
| 12 | Kotak Mahindra Bank | 283.32 | 99.56% | 0.38% | 0.06% | 0.08% | |
| 13 | Airtel Payments Bank | 231.80 | 99.54% | 0.28% | 0.19% | 0.03% | |
| 14 | Indian Bank | 225.26 | 98.93% | 0.95% | 0.12% | 0.14% | |
| 15 | Bank of India | 197.83 | 99.54% | 0.20% | 0.26% | 0.09% | |
| 16 | INDUSIND BANK | 131.65 | 99.20% | 0.45% | 0.36% | 0.12% | |
| 17 | India Post Payment Bank | 131.52 | 95.21% | 0.41% | 4.38% | 0.34% | |
| 18 | Central Bank Of India | 93.29 | 98.14% | 0.40% | 1.46% | 0.58% | |
| 19 | Indian Overseas Bank | 87.87 | 97.75% | 0.47% | 1.78% | 0.57% | |
| 20 | UCO Bank | 84.00 | 98.67% | 0.85% | 0.48% | 0.25% | |
| 21 | IDBI Bank Limited | 65.49 | 98.13% | 0.74% | 1.13% | 0.16% | |
| 22 | Fino Payments Bank Limited | 63.82 | 96.00% | 2.83% | 1.17% | 0.19% | |
| 23 | Bank of Maharashtra | 61.24 | 95.97% | 0.19% | 3.84% | 0.41% | |
| 24 | RBL Bank Limited | 49.38 | 94.08% | 2.96% | 2.96% | 0.93% | |
| 25 | Karnataka Bank | 46.73 | 97.72% | 1.46% | 0.82% | 0.10% | |
| 26 | IDFC FIRST Bank | 36.02 | 98.06% | 1.71% | 0.23% | 0.07% | |
| 27 | Karur Vysya Bank | 35.22 | 97.58% | 1.21% | 1.21% | 0.21% | |
| 28 | Bandhan Bank | 32.36 | 98.60% | 0.26% | 1.14% | 0.01% | |
| 29 | South Indian Bank | 32.16 | 98.07% | 1.87% | 0.06% | 0.02% | |
| 30 | AU small Finance Bank | 30.19 | 96.15% | 2.96% | 0.89% | 0.19% | |
| 31 | Jammu and Kashmir Bank | 25.44 | 98.96% | 0.78% | 0.26% | 0.21% | |
| 32 | Tamilnad Mercantile Bank | 24.37 | 98.31% | 0.10% | 1.59% | 0.27% | |
| 33 | Tri O Tech Solutions Private Limited | 22.15 | 95.35% | 4.60% | 0.06% | 0.00% | |
| 34 | Ujjivan Small Finance Bank | 21.74 | 98.73% | 1.12% | 0.16% | 0.12% | |
| 35 | City Union Bank | 21.21 | 97.61% | 2.12% | 0.28% | 0.04% | |
| 36 | Punjab and Sind Bank | 16.20 | 95.93% | 1.26% | 2.81% | 0.85% | |
| 37 | Kerala Gramin Bank | 15.07 | 99.27% | 0.28% | 0.45% | 0.30% | |
| 38 | Equitas Bank | 14.44 | 97.44% | 2.28% | 0.28% | 0.02% | |
| 39 | Andhra Pradesh Grameena Vikas Bank | 13.56 | 97.46% | 0.65% | 1.89% | 0.30% | |
| 40 | Pragathi Krishna Gramin Bank | 12.98 | 98.57% | 0.39% | 1.04% | 0.67% | |
| 41 | DBS Bank India Limited | 12.36 | 97.79% | 1.75% | 0.46% | 0.15% | |
| 42 | Maharashtra Gramin Bank | 11.89 | 99.11% | 0.35% | 0.54% | 0.09% | |
| 43 | Rajasthan Marudhara Gramin Bank | 11.79 | 96.75% | 0.47% | 2.77% | 0.46% | |
| 44 | Citibank | 11.77 | 99.86% | 0.00% | 0.14% | 0.17% | |
| 45 | Jio Payments Bank | 11.55 | 98.96% | 0.59% | 0.45% | 0.08% | |
| 46 | Baroda UP Gramin Bank | 11.16 | 88.76% | 0.70% | 10.54% | 3.51% | |
| 47 | ESAF Small Finance Bank Ltd. | 10.73 | 99.17% | 0.11% | 0.72% | 0.21% | |
| 48 | Andhra Pragathi Grameena Bank | 9.12 | 97.42% | 0.68% | 1.90% | 0.05% | |
| 49 | Sarva Haryana Gramin Bank | 7.84 | 99.22% | 0.43% | 0.34% | 0.00% | |
| 50 | Saraswat Bank | 7.84 | 97.10% | 2.64% | 0.27% | 0.11% | |
| UPI Apps (Mar'24) | |||||||||||
|---|---|---|---|---|---|---|---|---|---|---|---|
| Sr.No. | Application Name | Customer Initiated Transactions | B2C Transactions | B2B Transactions | On-us Transactions | Total | |||||
| Volume (Mn) | Value (Cr) | Volume (Mn) | Value (Cr) | Volume (Mn) | Value (Cr) | Volume (Mn) | Value (Cr) | Volume (Mn) | Value (Cr) | ||
| 1 | PhonePe | 6,502.15 | 10,02,387.84 | - | - | - | - | - | - | 6,502.15 | 10,02,387.84 |
| 2 | Google Pay | 5,061.18 | 6,95,196.05 | - | - | - | - | - | - | 5,061.18 | 6,95,196.05 |
| 3 | Paytm | 1,210.64 | 1,33,707.06 | - | 0.01 | - | - | 19.40 | 699.77 | 1,230.04 | 1,34,406.85 |
| 4 | Cred | 132.31 | 44,991.57 | - | - | - | - | - | - | 132.31 | 44,991.57 |
| 5 | Axis Bank Apps | 13.59 | 3,044.92 | 81.00 | 4,389.01 | 0.01 | 1.99 | - | - | 94.60 | 7,435.92 |
| 6 | Amazon Pay | 65.35 | 6,772.89 | - | - | - | - | - | - | 65.35 | 6,772.89 |
| 7 | ICICI Bank Apps | 33.54 | 14,491.28 | 4.54 | 397.58 | 7.90 | 11,608.08 | - | - | 45.98 | 26,496.95 |
| 8 | Fampay | 43.69 | 528.01 | - | - | - | - | - | - | 43.69 | 528.01 |
| 9 | Kotak Mahindra Bank Apps | 39.14 | 5,763.37 | - | - | - | - | - | - | 39.14 | 5,763.37 |
| 10 | HDFC Bank Apps | 33.07 | 7,289.09 | 1.95 | 3.72 | 0.01 | 0.26 | - | - | 35.03 | 7,293.07 |
| 11 | 31.21 | 2,536.99 | - | - | - | - | - | - | 31.21 | 2,536.99 | |
| 12 | BHIM | 30.04 | 8,339.37 | - | - | - | - | - | - | 30.04 | 8,339.37 |
| 13 | Yes Bank Apps | 24.13 | 13,833.30 | - | - | 0.32 | 35.80 | - | - | 24.45 | 13,869.10 |
| 14 | Airtel Payments Bank Apps | 15.64 | 1,162.62 | - | - | - | 0.20 | 0.37 | 44.20 | 16.01 | 1,207.02 |
| 15 | Bajaj Finserv | 15.81 | 2,803.20 | - | - | - | - | - | - | 15.81 | 2,803.20 |
| 16 | Mobikwik | 8.27 | 2,190.01 | - | - | - | - | - | - | 8.27 | 2,190.01 |
| 17 | India Post Payments Bank Apps | 6.82 | 851.01 | - | - | - | - | - | - | 6.82 | 851.01 |
| 18 | Groww | 6.72 | 3,539.14 | - | - | - | - | - | - | 6.72 | 3,539.14 |
| 19 | State Bank of India Apps | 6.59 | 2,394.79 | - | - | 0.04 | 1.08 | - | - | 6.63 | 2,395.88 |
| 20 | IDFC Bank Apps | 6.41 | 1,581.28 | - | - | - | - | - | - | 6.41 | 1,581.28 |
| 21 | Samsung Pay | 6.24 | 530.80 | - | - | - | - | - | - | 6.24 | 530.80 |
| 22 | Jupiter | 5.57 | 709.07 | - | - | - | - | - | - | 5.57 | 709.07 |
| 23 | Flipkart | 5.00 | 197.24 | - | - | - | - | - | - | 5.00 | 197.24 |
| 24 | Deutsche Bank Apps | 3.30 | 453.57 | - | - | - | 0.02 | - | - | 3.30 | 453.59 |
| 25 | Federal Bank Apps | 6.11 | 806.45 | - | - | - | 0.01 | - | - | 6.11 | 806.46 |
| 26 | Canara Bank Apps | 3.10 | 798.84 | - | - | - | - | - | - | 3.10 | 798.84 |
| 27 | Navi | 3.00 | 94.29 | - | - | - | - | - | - | 3.00 | 94.29 |
| 28 | Slice | 5.22 | 538.12 | - | - | - | - | - | - | 5.22 | 538.12 |
| 29 | Jio Payments Bank Apps | 1.87 | 161.87 | - | - | - | - | - | - | 1.87 | 161.87 |
| 30 | Indian Bank Apps | 1.85 | 340.92 | - | - | 0.01 | 43.86 | - | - | 1.86 | 384.79 |
| 31 | RBL Bank Apps | 1.56 | 366.34 | - | 0.02 | 0.27 | 99.89 | - | - | 1.83 | 466.25 |
| 32 | Punjab National Bank Apps | 1.67 | 411.13 | - | - | - | - | - | - | 1.67 | 411.13 |
| 33 | Timepay | 1.37 | 18.50 | - | - | - | 0.02 | - | - | 1.37 | 18.52 |
| 34 | Union Bank Apps | 1.35 | 517.15 | - | - | - | 0.01 | - | - | 1.35 | 517.16 |
| 35 | Omnicard | 1.29 | 44.84 | - | - | - | - | - | - | 1.29 | 44.84 |
| 36 | Bank of Baroda Apps | 0.95 | 419.08 | - | - | - | 7.73 | - | - | 0.95 | 426.81 |
| 37 | Central Bank of India Apps | 0.86 | 195.46 | - | - | - | - | - | - | 0.86 | 195.46 |
| 38 | AU Small Finance Bank Apps | 0.78 | 279.91 | - | - | - | - | - | - | 0.78 | 279.91 |
| 39 | Gokiwi | 0.70 | 100.10 | - | - | - | - | - | - | 0.70 | 100.10 |
| 40 | DBS Digibank Apps | 0.51 | 202.89 | - | - | - | 0.29 | - | - | 0.51 | 203.18 |
| 41 | Shriram One | 0.48 | 38.71 | - | - | - | - | - | - | 0.48 | 38.71 |
| 42 | South Indian Bank Apps | 0.40 | 120.88 | - | - | - | - | - | - | 0.40 | 120.88 |
| 43 | Fino Payments bank Apps | 0.39 | 50.97 | - | - | - | - | - | - | 0.39 | 50.97 |
| 44 | IndusInd Bank Apps | 1.39 | 228.02 | - | - | - | 0.12 | - | - | 1.39 | 228.14 |
| 45 | HSBC Bank Apps | 0.31 | 138.16 | - | 0.06 | - | - | - | - | 0.31 | 138.22 |
| 46 | TataNeu | 0.25 | 25.46 | - | - | - | - | - | - | 0.25 | 25.46 |
| 47 | Bank of India Apps | 0.20 | 78.81 | - | - | - | - | - | - | 0.20 | 78.81 |
| 48 | Standard Chartered Bank Apps | 0.19 | 115.77 | - | - | - | 1.11 | - | - | 0.19 | 116.88 |
| 49 | Dhani | 0.19 | 5.98 | - | - | - | - | - | - | 0.19 | 5.98 |
| 50 | UCO Bank Apps | 0.18 | 56.32 | - | - | - | - | - | - | 0.18 | 56.32 |
| 51 | Karnataka Bank Apps | 0.16 | 25.58 | - | - | - | - | - | - | 0.16 | 25.58 |
| 52 | Jupiter Edge | 0.14 | 32.22 | - | - | - | - | - | - | 0.14 | 32.22 |
| 53 | Digikhata | 0.13 | 48.01 | - | - | - | - | - | - | 0.13 | 48.01 |
| 54 | Indian Overseas Bank Apps | 0.11 | 30.44 | - | - | - | - | - | - | 0.11 | 30.44 |
| 55 | Tamilnad Mercantile Bank Apps | 0.10 | 28.72 | - | - | - | - | - | - | 0.10 | 28.72 |
| 56 | Ultracash | 0.09 | 6.57 | - | - | - | - | - | - | 0.09 | 6.57 |
| 57 | Citi Bank Apps | 0.09 | 66.70 | - | - | - | 0.01 | - | - | 0.09 | 66.71 |
| 58 | City Union Bank Apps | 0.08 | 26.73 | - | - | - | - | - | - | 0.08 | 26.73 |
| 59 | NSDL Payments Bank Apps | 0.07 | 10.57 | - | - | - | - | - | - | 0.07 | 10.57 |
| 60 | Bank of Maharashtra Apps | 0.05 | 11.60 | - | - | - | 0.07 | - | - | 0.05 | 11.67 |
| 61 | Karur Vysya Bank Apps | 0.05 | 17.68 | - | - | - | - | - | - | 0.05 | 17.68 |
| 62 | Equitas Small Finance Bank Apps | 0.04 | 26.62 | - | - | - | - | - | - | 0.04 | 26.62 |
| 63 | MakeMyTrip | 0.03 | 18.75 | - | - | - | - | - | - | 0.03 | 18.75 |
| 64 | Go Niyo | 0.03 | 12.86 | - | - | - | - | - | - | 0.03 | 12.86 |
| 65 | Allahabad Bank Apps | 0.03 | 6.32 | - | - | - | - | - | - | 0.03 | 6.32 |
| 66 | Other Apps | 1.07 | 109.12 | - | - | 0.14 | 3.94 | - | - | 1.21 | 113.06 |
Note:-
| UPI P2P and P2M Transactions | ||||||
|---|---|---|---|---|---|---|
| Month | Total | P2P | P2M | |||
| Volume (Mn) | Value (Cr) | Volume (Mn) | Value (Cr) | Volume (Mn) | Value (Cr) | |
| Mar'24 | 13,440.00 | 19,78,353.23 | 5,144.03 | 14,60,125.24 | 8,295.97 | 5,18,227.99 |


| UPI Payer PSP Performance (Mar'24) | |||||
|---|---|---|---|---|---|
| Sr. No. | Payer PSP | Total Volume (In Mn) | Approved % | BD % | TD % |
| 1 | YES BANK LTD | 3895.71 | 93.70% | 6.18% | 0.13% |
| 2 | AXIS BANK LTD. | 3723.05 | 94.37% | 5.48% | 0.15% |
| 3 | ICICI BANK | 2690.47 | 94.21% | 5.65% | 0.14% |
| 4 | PAYTM PAYMENTS BANK | 1321.44 | 91.61% | 8.26% | 0.13% |
| 5 | STATE BANK OF INDIA | 1255.46 | 95.77% | 4.15% | 0.08% |
| 6 | HDFC BANK LTD | 1196.05 | 95.43% | 4.45% | 0.12% |
| 7 | TRI O TECH SOLUTIONS PRIVATE LIMITED | 43.69 | 100.00% | 0.00% | 0.00% |
| 8 | KOTAK MAHINDRA BANK | 39.38 | 100.00% | 0.00% | 0.00% |
| 9 | BHIM | 32.08 | 93.66% | 6.17% | 0.17% |
| 10 | AIRTEL PAYMENTS BANK | 16.43 | 95.22% | 4.72% | 0.06% |
| 11 | INDIA POST PAYMENT BANK | 6.82 | 99.97% | 0.03% | 0.00% |
| 12 | IDFC First Bank | 6.80 | 99.19% | 0.81% | 0.01% |
| 13 | RBL Bank | 5.70 | 95.02% | 4.84% | 0.14% |
| 14 | CANARA BANK | 3.43 | 95.23% | 4.45% | 0.33% |
| 15 | DEUTSCHE BANK CORP | 3.28 | 100.00% | 0.00% | 0.00% |
| UPI Payee PSP Performance (Mar'24) | |||||
|---|---|---|---|---|---|
| Sr. No. | Payee PSP | Total Volume (In Mn) | Approved % | BD % | TD % |
| 1 | YES BANK LTD | 4802.48 | 93.60% | 6.27% | 0.13% |
| 2 | PAYTM PAYMENTS BANK | 2881.30 | 94.85% | 5.03% | 0.12% |
| 3 | AXIS BANK LTD. | 2152.41 | 94.29% | 5.56% | 0.15% |
| 4 | ICICI BANK | 1513.39 | 93.75% | 6.11% | 0.14% |
| 5 | STATE BANK OF INDIA | 820.84 | 94.10% | 5.78% | 0.12% |
| 6 | HDFC BANK LTD | 748.87 | 95.06% | 4.83% | 0.11% |
| 7 | FEDERAL BANK | 299.60 | 96.81% | 3.07% | 0.12% |
| 8 | JUSPAY TECHNOLOGIES PVT LTD | 222.05 | 95.89% | 3.99% | 0.12% |
| 9 | INDUSIND BANK | 72.39 | 95.12% | 4.75% | 0.12% |
| 10 | AIRTEL PAYMENTS BANK | 48.95 | 93.83% | 6.04% | 0.13% |
| 11 | RBL Bank | 45.77 | 92.34% | 7.42% | 0.24% |
| 12 | COSMOS BANK | 44.71 | 90.54% | 9.29% | 0.17% |
| 13 | KOTAK MAHINDRA BANK | 44.60 | 94.79% | 4.94% | 0.26% |
| 14 | INDIAN BANK | 40.25 | 92.21% | 7.62% | 0.17% |
| 15 | CANARA BANK | 40.20 | 96.50% | 3.40% | 0.10% |
| UPI Merchant Category-wise Classification - March'24 (Arranged by Volume) | ||||
|---|---|---|---|---|
| Type | MCC | Description | Volume (in Mn) | Value (in Cr.) |
| High Transacting Categories | 5411 | Groceries and supermarkets | 1,799.43 | 44,040.04 |
| 5814 | Fast food restaurants | 820.41 | 10,186.11 | |
| 5812 | Eating places and restaurants | 737.41 | 12,171.30 | |
| 4814 | Telecommunication services, including local and long distance calls, credit card calls, calls through use of magnetic stripe reading telephones and faxes | 673.68 | 16,198.22 | |
| 5541 | Service stations (with or without ancillary services) | 388.32 | 24,405.35 | |
| 5816 | Digital Goods: Games | 364.59 | 11,151.01 | |
| 5311 | Department stores | 242.81 | 5,527.52 | |
| 5912 | Drug stores and pharmacies | 189.75 | 7,254.61 | |
| 5462 | Bakeries | 175.93 | 2,490.28 | |
| 4900 | Utilities electric, gas, water and sanitary | 117.00 | 11,084.55 | |
| Medium Transacting Categories | 5451 | Dairies | 116.55 | 2,579.54 |
| 7322 | Debt collection agencies | 85.87 | 67,179.02 | |
| 5813 | Drinking places (alcoholic beverages) bars, taverns, night-clubs, cocktail lounges and discothques | 84.06 | 3,268.55 | |
| 5441 | Candy, nut and confectionery shops | 71.52 | 1,237.81 | |
| 7622 | Electronics repair shops | 66.17 | 2,068.78 | |
| 5422 | Freezer and locker meat provisioners | 64.88 | 2,091.93 | |
| 5921 | Package shops beer, wine and liquor | 59.77 | 2,554.26 | |
| 5993 | Cigar shops and stands | 59.03 | 440.55 | |
| 5137 | Mens, womens and childrens uniforms and commercial clothing | 53.66 | 5,576.78 | |
| 5732 | Electronics shops | 53.12 | 6,857.05 | |
| All Other Categories | 5399 | Miscellaneous general merchandise | 52.11 | 4,601.65 |
| 7230 | Beauty and barber shops | 51.37 | 1,506.84 | |
| 6012 | Financial institutions merchandise and services | 50.65 | 18,843.85 | |
| 9399 | Government services not elsewhere classified | 49.59 | 6,064.45 | |
| 4112 | Passenger railways | 46.83 | 2,642.35 | |
| 6211 | Securities brokers and dealers | 45.58 | 38,703.88 | |
| 5331 | Variety stores | 41.03 | 2,321.55 | |
| 5691 | Mens and womens clothing shops | 40.58 | 5,382.39 | |
| 4812 | Telecommunication equipment and telephone sales | 40.46 | 2,984.11 | |
| Others | 1,653.81 | 1,96,812.94 | ||
| Total | 8,295.98 | 5,18,227.29 | ||
| State-wise UPI Product Statistics* (Mar'24) | |||||
|---|---|---|---|---|---|
| Sr. No. | State / Union Territory | Volume (in Mn ) | Volume Contribution (%) | Value (in Cr.) | Value Contribution (%) |
| 1 | MAHARASHTRA | 1,826.53 | 13.59% | 2,50,484.52 | 12.66% |
| 2 | KARNATAKA | 1,142.17 | 8.50% | 1,56,929.06 | 7.93% |
| 3 | UTTAR PRADESH | 1,000.03 | 7.44% | 1,40,637.92 | 7.11% |
| 4 | TELANGANA | 887.13 | 6.60% | 1,41,964.06 | 7.18% |
| 5 | TAMIL NADU | 656.26 | 4.88% | 1,03,876.55 | 5.25% |
| 6 | RAJASTHAN | 599.75 | 4.46% | 91,202.44 | 4.61% |
| 7 | MADHYA PRADESH | 575.54 | 4.28% | 76,913.90 | 3.89% |
| 8 | ANDHRA PRADESH | 515.34 | 3.83% | 97,168.40 | 4.91% |
| 9 | DELHI | 469.67 | 3.49% | 59,757.19 | 3.02% |
| 10 | BIHAR | 455.84 | 3.39% | 72,235.02 | 3.65% |
| 11 | GUJARAT | 439.51 | 3.27% | 68,656.44 | 3.47% |
| 12 | WEST BENGAL | 386.00 | 2.87% | 66,683.59 | 3.37% |
| 13 | HARYANA | 351.20 | 2.61% | 50,497.34 | 2.55% |
| 14 | ODISHA | 310.00 | 2.31% | 43,820.87 | 2.22% |
| 15 | KERALA | 309.81 | 2.31% | 44,213.71 | 2.23% |
| 16 | PUNJAB | 186.18 | 1.39% | 31,180.39 | 1.58% |
| 17 | ASSAM | 166.53 | 1.24% | 24,035.14 | 1.21% |
| 18 | JHARKHAND | 157.45 | 1.17% | 22,507.82 | 1.14% |
| 19 | CHHATTISGARH | 131.55 | 0.98% | 17,789.07 | 0.90% |
| 20 | UTTARAKHAND | 96.44 | 0.72% | 12,359.89 | 0.62% |
| 21 | JAMMU AND KASHMIR | 53.84 | 0.40% | 7,489.54 | 0.38% |
| 22 | HIMACHAL PRADESH | 51.93 | 0.39% | 6,624.41 | 0.33% |
| 23 | GOA | 30.22 | 0.22% | 4,197.43 | 0.21% |
| 24 | CHANDIGARH | 26.64 | 0.20% | 3,422.70 | 0.17% |
| 25 | PUDUCHERRY | 14.54 | 0.11% | 2,067.05 | 0.10% |
| 26 | ARUNACHAL PRADESH | 14.30 | 0.11% | 2,266.76 | 0.11% |
| 27 | TRIPURA | 11.03 | 0.08% | 1,789.75 | 0.09% |
| 28 | DADRA & NAGAR HAVELI & DAMAN & DIU | 9.77 | 0.07% | 1,033.38 | 0.05% |
| 29 | MEGHALAYA | 9.60 | 0.07% | 1,527.77 | 0.08% |
| 30 | MANIPUR | 8.53 | 0.06% | 2,149.56 | 0.11% |
| 31 | NAGALAND | 8.00 | 0.06% | 1,688.06 | 0.09% |
| 32 | MIZORAM | 6.53 | 0.05% | 1,328.97 | 0.07% |
| 33 | SIKKIM | 5.64 | 0.04% | 890.91 | 0.05% |
| 34 | ANDAMAN & NICOBAR | 2.95 | 0.02% | 525.36 | 0.03% |
| 35 | LADAKH | 2.11 | 0.02% | 382.57 | 0.02% |
| 36 | LAKSHADWEEP | 0.32 | 0.00% | 44.73 | 0.00% |
| 37 | UNCLASSIFIED# | 2,521.15 | 18.76% | 3,68,010.97 | 18.60% |
| UPI Remitter Banks - Top 50 Banks (Feb'24) | |||||||
|---|---|---|---|---|---|---|---|
| Sr. No. | UPI Remitter Banks (Feb-2024) | Total Volume (In Mn) | Approved % | BD % | TD% | Total Debit Reversal Count (In Mn) | Debit Reversal Success % |
| 1 | State Bank Of India | 3135.27 | 94.83% | 4.23% | 0.94% | 13.94 | 90.58% |
| 2 | HDFC BANK LTD | 1049.59 | 95.71% | 3.60% | 0.69% | 5.35 | 75.52% |
| 3 | Bank of Baroda | 786.15 | 93.46% | 5.51% | 1.03% | 3.80 | 90.07% |
| 4 | Union Bank of India | 754.01 | 93.80% | 4.52% | 1.68% | 6.41 | 38.65% |
| 5 | Punjab National Bank | 628.99 | 94.85% | 4.90% | 0.25% | 2.50 | 97.32% |
| 6 | ICICI Bank | 539.76 | 96.39% | 3.32% | 0.29% | 2.21 | 90.34% |
| 7 | Axis Bank Ltd. | 558.18 | 96.29% | 3.66% | 0.05% | 1.95 | 83.76% |
| 8 | Kotak Mahindra Bank | 609.79 | 93.10% | 5.48% | 1.42% | 2.22 | 85.84% |
| 9 | Canara Bank | 578.21 | 94.12% | 5.42% | 0.45% | 3.13 | 84.99% |
| 10 | Paytm Payments Bank | 294.20 | 94.39% | 5.60% | 0.01% | 0.66 | 98.30% |
| 11 | Bank of India | 389.19 | 94.55% | 4.55% | 0.90% | 2.12 | 67.73% |
| 12 | Indian Bank | 354.82 | 95.10% | 4.63% | 0.27% | 1.34 | 92.06% |
| 13 | Airtel Payments Bank | 344.18 | 91.11% | 8.65% | 0.24% | 1.30 | 94.30% |
| 14 | India Post Payment Bank | 271.05 | 83.20% | 13.00% | 3.81% | 2.05 | 52.38% |
| 15 | Federal Bank | 187.90 | 95.30% | 4.44% | 0.26% | 0.69 | 94.65% |
| 16 | Central Bank Of India | 179.35 | 82.62% | 9.59% | 7.80% | 4.98 | 58.09% |
| 17 | Indian Overseas Bank | 168.40 | 93.49% | 4.67% | 1.84% | 1.15 | 90.23% |
| 18 | UCO Bank | 148.69 | 94.51% | 5.38% | 0.11% | 0.63 | 87.67% |
| 19 | IDBI Bank Limited | 138.33 | 89.05% | 4.39% | 6.56% | 2.30 | 71.66% |
| 20 | Bank of Maharashtra | 135.58 | 91.92% | 4.82% | 3.26% | 0.92 | 61.29% |
| 21 | INDUSIND BANK | 129.68 | 93.37% | 5.92% | 0.71% | 0.91 | 95.30% |
| 22 | Fino Payments Bank Limited | 116.25 | 90.66% | 8.85% | 0.49% | 0.60 | 69.94% |
| 23 | Yes Bank Ltd | 93.40 | 94.70% | 5.06% | 0.24% | 0.28 | 86.09% |
| 24 | Karnataka Bank | 95.34 | 93.42% | 5.76% | 0.82% | 0.41 | 84.09% |
| 25 | Karur Vysya Bank | 60.33 | 94.05% | 5.44% | 0.50% | 0.25 | 95.11% |
| 26 | Bandhan Bank | 49.32 | 89.80% | 6.16% | 4.04% | 0.56 | 74.85% |
| 27 | South Indian Bank | 48.87 | 96.05% | 3.93% | 0.02% | 0.14 | 95.53% |
| 28 | IDFC FIRST Bank | 74.34 | 93.92% | 5.96% | 0.11% | 0.28 | 100.00% |
| 29 | Jammu and Kashmir Bank | 46.57 | 93.54% | 5.16% | 1.30% | 0.46 | 35.63% |
| 30 | City Union Bank | 36.62 | 93.36% | 6.21% | 0.43% | 0.14 | 98.29% |
| 31 | Ujjivan Small Finance Bank | 37.90 | 93.71% | 5.66% | 0.63% | 0.21 | 67.81% |
| 32 | AU small Finance Bank | 38.80 | 95.09% | 4.54% | 0.37% | 0.21 | 95.33% |
| 33 | Tamilnad Mercantile Bank | 32.68 | 93.01% | 6.45% | 0.54% | 0.12 | 84.51% |
| 34 | Equitas Bank | 28.88 | 93.09% | 6.87% | 0.04% | 0.13 | 96.46% |
| 35 | Standard Chartered | 26.59 | 95.99% | 2.23% | 1.78% | 0.14 | 67.12% |
| 36 | Punjab and Sind Bank | 31.49 | 90.85% | 6.00% | 3.16% | 0.40 | 39.67% |
| 37 | DBS Bank India Limited | 24.28 | 95.35% | 4.37% | 0.27% | 0.09 | 77.88% |
| 38 | Andhra Pradesh Grameena Vikas Bank | 26.19 | 83.85% | 15.19% | 0.96% | 0.14 | 65.48% |
| 39 | Pragathi Krishna Gramin Bank | 23.10 | 88.69% | 7.67% | 3.64% | 0.38 | 43.13% |
| 40 | CITI Bank | 18.92 | 95.17% | 4.45% | 0.37% | 0.07 | 96.14% |
| 41 | Maharashtra Gramin Bank | 22.28 | 86.73% | 11.53% | 1.75% | 0.09 | 82.26% |
| 42 | Kerala Gramin Bank | 25.18 | 90.99% | 6.13% | 2.88% | 0.31 | 40.08% |
| 43 | Saraswat Bank | 21.03 | 95.96% | 3.78% | 0.25% | 0.08 | 83.40% |
| 44 | Tri O Tech Solutions Private Limited | 37.89 | 100.00% | 0.00% | 0.00% | 0.00 | 0.00% |
| 45 | Rajasthan Marudhara Gramin Bank | 20.23 | 88.60% | 10.75% | 0.66% | 0.13 | 70.74% |
| 46 | ESAF Small Finance Bank Ltd. | 20.59 | 91.09% | 4.91% | 3.99% | 0.24 | 71.75% |
| 47 | Baroda UP Gramin Bank | 17.10 | 79.41% | 12.40% | 8.19% | 0.40 | 44.55% |
| 48 | Sarva Haryana Gramin Bank | 14.14 | 93.02% | 6.95% | 0.03% | 0.06 | 95.68% |
| 49 | RBL Bank | 15.27 | 81.63% | 8.31% | 10.06% | 0.26 | 47.24% |
| 50 | Andhra Pragathi Grameena Bank | 14.92 | 87.07% | 11.97% | 0.96% | 0.07 | 79.19% |
| UPI Beneficiary Banks - Top 50 Banks (Feb'24) | |||||||
|---|---|---|---|---|---|---|---|
| Sr.No. | UPI Beneficiary Banks (Feb-2024) | Total Volume (In Mn) | Approved % | BD% | TD% | Deemed Approved % | |
| 1 | Paytm Payments Bank | 2543.04 | 99.90% | 0.08% | 0.02% | 0.00% | |
| 2 | Yes Bank Ltd | 2408.99 | 99.95% | 0.03% | 0.01% | 0.00% | |
| 3 | State Bank Of India | 1350.11 | 98.92% | 0.14% | 0.93% | 0.09% | |
| 4 | Axis Bank Ltd. | 1029.01 | 99.91% | 0.08% | 0.01% | 0.02% | |
| 5 | ICICI Bank | 620.78 | 99.21% | 0.67% | 0.12% | 0.10% | |
| 6 | HDFC BANK LTD | 553.52 | 98.17% | 1.46% | 0.37% | 0.14% | |
| 7 | Bank of Baroda | 336.67 | 99.14% | 0.32% | 0.54% | 0.52% | |
| 8 | Union Bank of India | 322.91 | 98.90% | 0.13% | 0.97% | 0.43% | |
| 9 | Federal Bank | 316.08 | 99.47% | 0.32% | 0.21% | 0.02% | |
| 10 | Punjab National Bank | 278.27 | 99.57% | 0.33% | 0.11% | 0.12% | |
| 11 | Canara Bank | 272.27 | 98.49% | 1.23% | 0.29% | 0.17% | |
| 12 | Kotak Mahindra Bank | 242.32 | 98.58% | 0.40% | 1.01% | 0.53% | |
| 13 | Airtel Payments Bank | 200.32 | 99.35% | 0.33% | 0.32% | 0.03% | |
| 14 | Indian Bank | 197.87 | 98.92% | 0.88% | 0.20% | 0.04% | |
| 15 | Bank of India | 180.38 | 99.11% | 0.23% | 0.66% | 0.18% | |
| 16 | INDUSIND BANK | 134.71 | 99.25% | 0.31% | 0.44% | 0.21% | |
| 17 | India Post Payment Bank | 119.59 | 97.46% | 0.38% | 2.16% | 0.26% | |
| 18 | Central Bank Of India | 84.86 | 94.84% | 0.45% | 4.71% | 1.23% | |
| 19 | Indian Overseas Bank | 78.84 | 98.46% | 0.47% | 1.07% | 0.45% | |
| 20 | UCO Bank | 74.07 | 99.21% | 0.70% | 0.08% | 0.04% | |
| 21 | IDBI Bank Limited | 60.85 | 93.78% | 0.54% | 5.67% | 0.93% | |
| 22 | Bank of Maharashtra | 54.57 | 96.19% | 0.21% | 3.60% | 0.32% | |
| 23 | RBL bank | 52.57 | 94.24% | 0.42% | 5.34% | 0.49% | |
| 24 | Fino Payments Bank Limited | 48.84 | 98.31% | 1.31% | 0.38% | 0.15% | |
| 25 | Karnataka Bank | 41.82 | 98.27% | 1.00% | 0.73% | 0.04% | |
| 26 | IDFC FIRST Bank | 35.13 | 98.05% | 1.85% | 0.10% | 0.04% | |
| 27 | Karur Vysya Bank | 31.92 | 98.60% | 1.16% | 0.23% | 0.06% | |
| 28 | South Indian Bank | 29.77 | 97.88% | 2.10% | 0.02% | 0.01% | |
| 29 | Bandhan Bank | 29.22 | 96.68% | 0.23% | 3.09% | 0.23% | |
| 30 | AU small Finance Bank | 26.60 | 96.28% | 3.33% | 0.39% | 0.10% | |
| 31 | Tamilnad Mercantile Bank | 21.42 | 99.35% | 0.17% | 0.48% | 0.04% | |
| 32 | Jammu and Kashmir Bank | 20.34 | 99.07% | 0.45% | 0.48% | 0.46% | |
| 33 | Ujjivan Small Finance Bank | 19.51 | 98.59% | 1.02% | 0.39% | 0.25% | |
| 34 | City Union Bank | 19.30 | 97.55% | 2.13% | 0.32% | 0.02% | |
| 35 | Tri O Tech Solutions Private Limited | 18.51 | 96.17% | 3.80% | 0.03% | 0.01% | |
| 36 | ONE MOBIKWIK SYSTEMS LIMITED | 15.24 | 99.99% | 0.00% | 0.01% | 0.00% | |
| 37 | Punjab and Sind Bank | 14.14 | 96.07% | 1.14% | 2.79% | 0.61% | |
| 38 | Kerala Gramin Bank | 14.01 | 97.80% | 0.25% | 1.96% | 0.97% | |
| 39 | Equitas Bank | 13.15 | 97.90% | 1.85% | 0.25% | 0.01% | |
| 40 | Andhra Pradesh Grameena Vikas Bank | 12.36 | 98.38% | 1.23% | 0.40% | 0.14% | |
| 41 | DBS Bank India Limited | 12.03 | 98.53% | 1.21% | 0.26% | 0.12% | |
| 42 | Pragathi Krishna Gramin Bank | 11.61 | 97.30% | 0.61% | 2.09% | 1.18% | |
| 43 | Jio Payments Bank | 11.33 | 99.39% | 0.26% | 0.36% | 0.27% | |
| 44 | CITI Bank | 10.68 | 99.84% | 0.00% | 0.16% | 0.24% | |
| 45 | Maharashtra Gramin Bank | 10.56 | 98.15% | 0.32% | 1.53% | 0.17% | |
| 46 | Rajasthan Marudhara Gramin Bank | 10.31 | 98.04% | 0.40% | 1.55% | 0.13% | |
| 47 | ESAF Small Finance Bank Ltd. | 10.16 | 97.11% | 0.11% | 2.78% | 0.38% | |
| 48 | Baroda UP Gramin Bank | 9.18 | 92.84% | 0.82% | 6.34% | 1.71% | |
| 49 | Fincare Small Finance Bank Ltd | 8.55 | 96.27% | 3.29% | 0.44% | 0.09% | |
| 50 | Andhra Pragathi Grameena Bank | 8.07 | 98.57% | 0.45% | 0.98% | 0.04% | |
| UPI Apps (Feb'24) | |||||||||||
|---|---|---|---|---|---|---|---|---|---|---|---|
| Sr.No. | Application Name | Customer Initiated Transactions | B2C Transactions | B2B Transactions | On-us Transactions | Total | |||||
| Volume (Mn) | Value (Cr) | Volume (Mn) | Value (Cr) | Volume (Mn) | Value (Cr) | Volume (Mn) | Value (Cr) | Volume (Mn) | Value (Cr) | ||
| 1 | Phonepe # | 5,760.01 | 9,15,586.00 | 0.00 | 0.00 | 0.00 | 0.00 | 0.00 | 0.00 | 5,760.01 | 9,15,586.00 |
| 2 | Google Pay # | 4,461.29 | 6,37,219.40 | 46.83 | 45.25 | 0.00 | 0.00 | 0.00 | 0.00 | 4,508.12 | 6,37,264.65 |
| 3 | Paytm # | 1,267.27 | 1,45,305.47 | 0.17 | 0.09 | 0.55 | 971.93 | 72.36 | 13,291.98 | 1,340.35 | 1,59,569.47 |
| 4 | Cred # | 111.53 | 38,649.61 | 0.00 | 0.00 | 0.00 | 0.00 | 0.00 | 0.00 | 111.53 | 38,649.61 |
| 5 | Amazon Pay # | 59.71 | 6,278.02 | 0.00 | 0.00 | 0.00 | 0.00 | 0.00 | 0.00 | 59.71 | 6,278.02 |
| 6 | BHIM | 56.16 | 9,052.16 | 0.00 | 0.00 | 0.00 | 0.00 | 0.00 | 0.00 | 56.16 | 9,052.16 |
| 7 | ICICI Bank Apps | 28.95 | 10,492.15 | 4.27 | 416.25 | 5.69 | 8,779.07 | 0.00 | 0.00 | 38.92 | 19,687.47 |
| 8 | FamPay by Trio # | 37.89 | 432.81 | 0.00 | 0.00 | 0.00 | 0.00 | 0.00 | 0.00 | 37.89 | 432.81 |
| 9 | HDFC Bank Apps | 13.51 | 4,283.81 | 23.86 | 71.63 | 0.00 | 0.12 | 0.00 | 0.00 | 37.37 | 4,355.55 |
| 10 | Kotak Mahindra Bank Apps | 31.50 | 5,127.03 | 0.00 | 0.00 | 0.00 | 0.00 | 0.00 | 0.00 | 31.50 | 5,127.03 |
| 11 | Axis Bank Apps | 10.08 | 2,290.26 | 20.84 | 6,427.20 | 0.01 | 1.77 | 0.00 | 0.00 | 30.93 | 8,719.23 |
| 12 | Whatsapp # | 26.76 | 2,175.12 | 0.00 | 0.00 | 0.00 | 0.00 | 0.00 | 0.00 | 26.76 | 2,175.12 |
| 13 | Yes Bank Apps | 21.24 | 11,308.74 | 0.00 | 0.00 | 0.33 | 36.07 | 0.00 | 0.00 | 21.57 | 11,344.81 |
| 14 | Bajaj Finserv # | 19.22 | 2,984.70 | 0.00 | 0.00 | 0.00 | 0.00 | 0.00 | 0.00 | 19.22 | 2,984.70 |
| 15 | Airtel Payments Bank Apps | 14.06 | 1,028.15 | 0.00 | 0.00 | 0.00 | 0.17 | 0.01 | 0.03 | 14.07 | 1,028.35 |
| 16 | Mobikwik # | 6.28 | 1,793.84 | 0.00 | 0.00 | 0.00 | 0.00 | 0.00 | 0.00 | 6.28 | 1,793.84 |
| 17 | SBI Bank Apps | 6.17 | 2,350.42 | 0.00 | 0.00 | 0.03 | 1.03 | 0.00 | 0.00 | 6.20 | 2,351.46 |
| 18 | Groww # | 5.78 | 3,042.87 | 0.00 | 0.00 | 0.00 | 0.00 | 0.00 | 0.00 | 5.78 | 3,042.87 |
| 19 | Federal Bank Apps | 5.74 | 717.81 | 0.00 | 0.00 | 0.00 | 0.00 | 0.00 | 0.00 | 5.74 | 717.81 |
| 20 | Samsung Pay # | 5.61 | 494.57 | 0.00 | 0.00 | 0.00 | 0.00 | 0.00 | 0.00 | 5.61 | 494.57 |
| 21 | IDFC First Bank Apps | 5.54 | 1,440.44 | 0.00 | 0.00 | 0.00 | 0.00 | 0.00 | 0.00 | 5.54 | 1,440.44 |
| 22 | India Post Payments Bank Apps | 5.38 | 608.29 | 0.00 | 0.00 | 0.00 | 0.00 | 0.00 | 0.00 | 5.38 | 608.29 |
| 23 | Jupiter Money # | 5.00 | 669.43 | 0.00 | 0.00 | 0.00 | 0.00 | 0.00 | 0.00 | 5.00 | 669.43 |
| 24 | Standard Chartered Bank Apps | 3.10 | 675.48 | 0.00 | 0.00 | 0.92 | 911.82 | 0.00 | 0.00 | 4.02 | 1,587.30 |
| 25 | Slice # | 3.98 | 471.27 | 0.00 | 0.00 | 0.00 | 0.00 | 0.00 | 0.00 | 3.98 | 471.27 |
| 26 | Deutsche Bank Apps | 3.42 | 377.59 | 0.00 | 0.00 | 0.00 | 0.03 | 0.00 | 0.00 | 3.43 | 377.62 |
| 27 | RBL Bank Apps | 2.62 | 485.29 | 0.00 | 0.01 | 0.20 | 88.75 | 0.00 | 0.00 | 2.82 | 574.05 |
| 28 | Canara Bank Apps | 2.79 | 745.20 | 0.00 | 0.00 | 0.00 | 0.00 | 0.00 | 0.00 | 2.79 | 745.20 |
| 29 | Freecharge # | 1.65 | 416.00 | 0.00 | 0.00 | 0.00 | 0.19 | 0.00 | 0.00 | 1.65 | 416.19 |
| 30 | Jio Payments Bank Apps | 1.64 | 145.51 | 0.00 | 0.00 | 0.00 | 0.00 | 0.00 | 0.00 | 1.64 | 145.51 |
| 31 | IndusInd Bank Apps | 1.46 | 272.43 | 0.00 | 0.00 | 0.00 | 0.00 | 0.00 | 0.00 | 1.46 | 272.43 |
| 32 | Navi # | 1.42 | 68.62 | 0.00 | 0.00 | 0.00 | 0.00 | 0.00 | 0.00 | 1.42 | 68.62 |
| 33 | Punjab National Bank Apps | 1.36 | 359.72 | 0.00 | 0.00 | 0.00 | 0.00 | 0.00 | 0.00 | 1.36 | 359.72 |
| 34 | Union Bank Of India Apps | 1.20 | 483.59 | 0.00 | 0.00 | 0.00 | 0.00 | 0.00 | 0.00 | 1.20 | 483.59 |
| 35 | Omnicard # | 1.15 | 38.18 | 0.00 | 0.00 | 0.00 | 0.00 | 0.00 | 0.00 | 1.15 | 38.18 |
| 36 | Bank of Baroda Apps | 0.76 | 359.31 | 0.00 | 0.00 | 0.00 | 9.93 | 0.00 | 0.00 | 0.76 | 369.24 |
| 37 | Au Small Finance Bank Apps | 0.73 | 276.63 | 0.00 | 0.00 | 0.00 | 0.00 | 0.00 | 0.00 | 0.73 | 276.63 |
| 38 | Central Bank of India Apps | 0.72 | 165.64 | 0.00 | 0.00 | 0.00 | 0.00 | 0.00 | 0.00 | 0.72 | 165.64 |
| 39 | Kiwi # | 0.55 | 81.25 | 0.00 | 0.00 | 0.00 | 0.00 | 0.00 | 0.00 | 0.55 | 81.25 |
| 40 | DBS Bank Apps | 0.54 | 201.91 | 0.00 | 0.00 | 0.00 | 0.14 | 0.00 | 0.00 | 0.54 | 202.06 |
| 41 | Indian Bank Apps | 0.42 | 112.76 | 0.00 | 0.00 | 0.01 | 47.33 | 0.00 | 0.00 | 0.42 | 160.09 |
| 42 | Timepay # | 0.42 | 3.95 | 0.00 | 0.00 | 0.00 | 0.00 | 0.00 | 0.00 | 0.42 | 3.95 |
| 43 | Karnataka Bank Apps | 0.41 | 85.93 | 0.00 | 0.00 | 0.00 | 0.00 | 0.00 | 0.00 | 0.41 | 85.93 |
| 44 | South Indian Bank Apps | 0.36 | 104.62 | 0.00 | 0.00 | 0.00 | 0.00 | 0.00 | 0.00 | 0.36 | 104.62 |
| 45 | Shri Ram One # | 0.35 | 31.20 | 0.00 | 0.00 | 0.00 | 0.00 | 0.00 | 0.00 | 0.35 | 31.20 |
| 46 | Fino Payments Bank Apps | 0.30 | 38.14 | 0.00 | 0.00 | 0.00 | 0.00 | 0.00 | 0.00 | 0.30 | 38.14 |
| 47 | Bank of India Apps | 0.24 | 91.81 | 0.00 | 0.00 | 0.00 | 0.00 | 0.00 | 0.00 | 0.24 | 91.81 |
| 48 | HSBC Bank Apps | 0.21 | 116.46 | 0.00 | 0.06 | 0.00 | 0.00 | 0.00 | 0.00 | 0.21 | 116.52 |
| 49 | Tata Neu # | 0.20 | 17.14 | 0.00 | 0.00 | 0.00 | 0.00 | 0.00 | 0.00 | 0.20 | 17.14 |
| 50 | Fave # | 0.19 | 36.57 | 0.00 | 0.00 | 0.00 | 0.00 | 0.00 | 0.00 | 0.19 | 36.57 |
| 51 | UCO Bank Apps | 0.17 | 61.26 | 0.00 | 0.00 | 0.00 | 0.00 | 0.00 | 0.00 | 0.17 | 61.26 |
| 52 | Tamilnad Mercantile Bank Apps | 0.12 | 32.14 | 0.00 | 0.00 | 0.00 | 0.00 | 0.00 | 0.00 | 0.12 | 32.14 |
| 53 | Indian Overseas Bank Apps | 0.11 | 29.06 | 0.00 | 0.00 | 0.00 | 0.00 | 0.00 | 0.00 | 0.11 | 29.06 |
| 54 | Digikhata # | 0.10 | 35.77 | 0.00 | 0.00 | 0.00 | 0.00 | 0.00 | 0.00 | 0.10 | 35.77 |
| 55 | LivQuik Apps # | 0.09 | 28.75 | 0.00 | 0.00 | 0.00 | 0.00 | 0.00 | 0.00 | 0.09 | 28.75 |
| 56 | City Union Bank Apps | 0.08 | 24.75 | 0.00 | 0.00 | 0.00 | 0.00 | 0.00 | 0.00 | 0.08 | 24.75 |
| 57 | Citi Bank Apps | 0.07 | 70.14 | 0.00 | 0.00 | 0.00 | 0.00 | 0.00 | 0.00 | 0.07 | 70.14 |
| 58 | IDBI Bank Apps | 0.06 | 32.49 | 0.00 | 0.00 | 0.00 | 0.00 | 0.00 | 0.00 | 0.06 | 32.49 |
| 59 | Dhani # | 0.05 | 3.38 | 0.00 | 0.00 | 0.00 | 0.00 | 0.00 | 0.00 | 0.05 | 3.38 |
| 60 | NSDL Payments Bank Apps | 0.05 | 6.59 | 0.00 | 0.00 | 0.00 | 0.00 | 0.00 | 0.00 | 0.05 | 6.59 |
| 61 | Karur Vysya Bank Apps | 0.04 | 15.42 | 0.00 | 0.00 | 0.00 | 0.00 | 0.00 | 0.00 | 0.04 | 15.42 |
| 62 | Bank of Maharashtra Apps | 0.04 | 7.68 | 0.00 | 0.00 | 0.00 | 0.00 | 0.00 | 0.00 | 0.04 | 7.68 |
| 63 | Equitas Small Apps | 0.04 | 24.46 | 0.00 | 0.00 | 0.00 | 0.00 | 0.00 | 0.00 | 0.04 | 24.46 |
| 64 | Flipkart UPI # | 0.03 | 0.68 | 0.00 | 0.00 | 0.00 | 0.00 | 0.00 | 0.00 | 0.03 | 0.68 |
| 65 | Punjab And Sind Bank Apps | 0.02 | 10.71 | 0.00 | 0.00 | 0.00 | 0.00 | 0.00 | 0.00 | 0.02 | 10.71 |
| 66 | Cheq | 0.02 | 1.54 | 0.00 | 0.00 | 0.00 | 0.00 | 0.00 | 0.00 | 0.02 | 1.54 |
| 67 | Niyo Global # | 0.02 | 4.04 | 0.00 | 0.00 | 0.00 | 0.00 | 0.00 | 0.00 | 0.02 | 4.04 |
| 68 | CBDC | 0.83 | 61.46 | 0.00 | 0.00 | 0.10 | 2.67 | 0.00 | 0.00 | 0.94 | 64.13 |
| 69 | Others | 0.03 | 12.13 | 0.00 | 0.00 | 0.00 | 2.04 | 0.00 | 0.00 | 0.03 | 14.17 |
Note:-
| UPI P2P and P2M Transactions | ||||||
|---|---|---|---|---|---|---|
| Month | Total | P2P | P2M | |||
| Volume (Mn) | Value (Cr) | Volume (Mn) | Value (Cr) | Volume (Mn) | Value (Cr) | |
| Feb'24 | 12,102.68 | 18,27,869.33 | 4,742.69 | 13,48,523.03 | 7,359.98 | 4,79,346.31 |

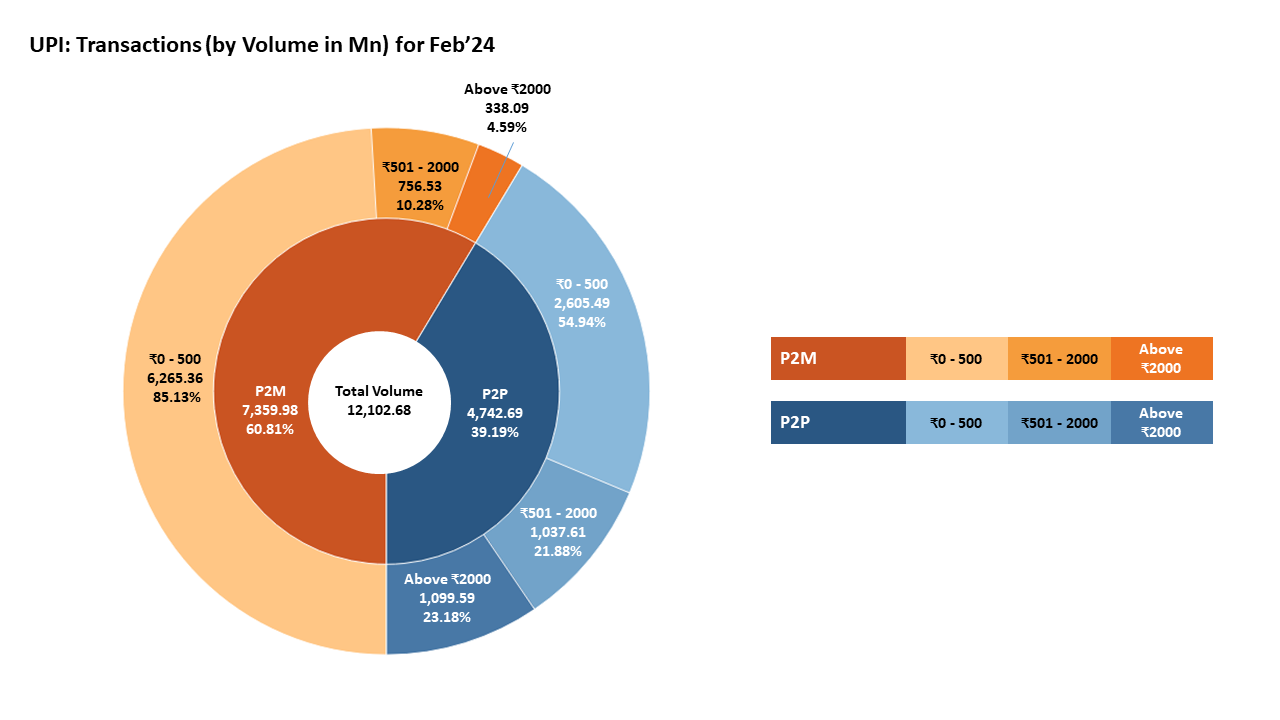
| UPI Payer PSP Performance (Feb'24) | |||||
|---|---|---|---|---|---|
| Sr. No. | Payer PSP | Total Volume (In Mn) | Approved % | BD % | TD % |
| 1 | YES BANK LTD | 3451.77 | 94.46% | 5.35% | 0.19% |
| 2 | AXIS BANK LTD. | 3208.19 | 94.73% | 5.08% | 0.19% |
| 3 | ICICI BANK | 2400.25 | 94.67% | 5.11% | 0.21% |
| 4 | PAYTM PAYMENTS BANK | 1346.19 | 93.20% | 6.64% | 0.17% |
| 5 | HDFC BANK LTD | 1097.67 | 95.62% | 4.24% | 0.15% |
| 6 | STATE BANK OF INDIA | 1082.21 | 95.73% | 4.17% | 0.10% |
| 7 | BHIM | 60.32 | 93.11% | 6.69% | 0.21% |
| 8 | TRI O TECH SOLUTIONS PRIVATE LIMITED | 37.89 | 100.00% | 0.00% | 0.00% |
| 9 | KOTAK MAHINDRA BANK | 31.70 | 100.00% | 0.00% | 0.00% |
| 10 | AIRTEL PAYMENTS BANK | 14.84 | 94.71% | 5.18% | 0.11% |
| 11 | RBL Bank | 6.26 | 95.82% | 4.04% | 0.15% |
| 12 | IDFC First Bank | 6.02 | 99.12% | 0.87% | 0.01% |
| 13 | INDIA POST PAYMENT BANK | 5.38 | 99.97% | 0.03% | 0.00% |
| 14 | STANDARD CHARTERED | 4.02 | 100.00% | 0.00% | 0.00% |
| 15 | FEDERAL BANK | 3.62 | 98.80% | 1.19% | 0.01% |
| UPI Payee PSP Performance (Feb'24) | |||||
|---|---|---|---|---|---|
| Sr. No. | Payee PSP | Total Volume (In Mn) | Approved % | BD % | TD % |
| 1 | YES BANK LTD | 4134.84 | 94.69% | 5.13% | 0.18% |
| 2 | PAYTM PAYMENTS BANK | 2845.89 | 95.39% | 4.42% | 0.19% |
| 3 | AXIS BANK LTD. | 1914.51 | 94.32% | 5.50% | 0.18% |
| 4 | ICICI BANK | 1386.09 | 93.81% | 6.02% | 0.18% |
| 5 | STATE BANK OF INDIA | 679.60 | 94.13% | 5.72% | 0.14% |
| 6 | HDFC BANK LTD | 636.88 | 94.95% | 4.89% | 0.15% |
| 7 | FEDERAL BANK | 248.51 | 96.78% | 3.05% | 0.17% |
| 8 | INDUSIND BANK | 76.56 | 94.90% | 4.91% | 0.19% |
| 9 | RBL Bank | 48.29 | 91.36% | 8.43% | 0.21% |
| 10 | COSMOS BANK | 44.02 | 90.24% | 9.53% | 0.23% |
| 11 | BHIM | 37.98 | 96.78% | 3.16% | 0.07% |
| 12 | AIRTEL PAYMENTS BANK | 35.36 | 93.80% | 6.03% | 0.17% |
| 13 | CANARA BANK | 31.60 | 96.56% | 3.30% | 0.14% |
| 14 | KOTAK MAHINDRA BANK | 31.35 | 95.26% | 4.53% | 0.20% |
| 15 | INDIAN BANK | 29.93 | 92.62% | 7.16% | 0.22% |
| UPI Merchant Category-wise Classification - February'24 (Arranged by Volume) | ||||
|---|---|---|---|---|
| Type | MCC | Description | Volume (in Mn) | Value (in Cr.) |
| High Transacting Categories | 5411 | Groceries and supermarkets | 1,440.35 | 36,600.03 |
| 5814 | Fast food restaurants | 743.17 | 8,939.06 | |
| 5812 | Eating places and restaurants | 691.44 | 11,156.54 | |
| 4814 | Telecommunication services, including local and long distance calls, credit card calls, calls through use of magnetic stripe reading telephones and faxes | 582.26 | 13,423.86 | |
| 5541 | Service stations (with or without ancillary services) | 347.94 | 22,160.43 | |
| 5311 | Department stores | 330.55 | 7,205.34 | |
| 5816 | Digital Goods: Games | 259.61 | 9,341.91 | |
| 5912 | Drug stores and pharmacies | 180.55 | 6,723.39 | |
| 5462 | Bakeries | 156.75 | 2,201.03 | |
| 4900 | Utilities electric, gas, water and sanitary | 109.52 | 10,481.38 | |
| Medium Transacting Categories | 5451 | Dairies | 95.15 | 2,200.87 |
| 6540 | Debit card to wallet credit (Wallet top up) | 76.99 | 4,618.70 | |
| 5813 | Drinking places (alcoholic beverages) bars, taverns, night-clubs, cocktail lounges and discothques | 76.15 | 2,845.30 | |
| 7322 | Debt collection agencies | 74.44 | 60,929.84 | |
| 7622 | Electronics repair shops | 63.30 | 1,917.23 | |
| 5441 | Candy, nut and confectionery shops | 58.27 | 1,050.99 | |
| 5422 | Freezer and locker meat provisioners | 56.10 | 1,768.20 | |
| 6211 | Securities brokers and dealers | 54.73 | 50,384.11 | |
| 5993 | Cigar shops and stands | 52.14 | 383.97 | |
| 5732 | Electronics shops | 49.44 | 5,866.02 | |
| All Other Categories | 5921 | Package shops beer, wine and liquor | 48.57 | 2,030.94 |
| 7230 | Beauty and barber shops | 47.96 | 1,466.61 | |
| 5137 | Mens, womens and childrens uniforms and commercial clothing | 47.93 | 4,895.21 | |
| 5399 | Miscellaneous general merchandise | 46.74 | 4,422.29 | |
| 9399 | Government services not elsewhere classified | 45.51 | 4,940.90 | |
| 6012 | Financial institutions merchandise and services | 42.44 | 16,688.53 | |
| 4112 | Passenger railways | 42.15 | 2,370.86 | |
| 4812 | Telecommunication equipment and telephone sales | 38.62 | 2,791.45 | |
| 5331 | Variety stores | 33.75 | 1,952.01 | |
| Others | 1,467.49 | 1,77,589.31 | ||
| Total | 7,359.98 | 4,79,346.31 | ||
| State-wise UPI Product Statistics* (Feb'24) | |||||
|---|---|---|---|---|---|
| Sr. No. | State / Union Territory | Volume (in Mn ) | Volume Contribution (%) | Value (in Cr.) | Value Contribution (%) |
| 1 | MAHARASHTRA | 1,738.47 | 14.36% | 2,31,170.06 | 12.65% |
| 2 | KARNATAKA | 1,038.59 | 8.58% | 1,44,752.39 | 7.92% |
| 3 | UTTAR PRADESH | 877.83 | 7.25% | 1,30,330.17 | 7.13% |
| 4 | TELANGANA | 799.49 | 6.61% | 1,31,906.83 | 7.22% |
| 5 | TAMIL NADU | 592.63 | 4.90% | 95,903.84 | 5.25% |
| 6 | RAJASTHAN | 540.32 | 4.46% | 86,997.16 | 4.76% |
| 7 | MADHYA PRADESH | 493.37 | 4.08% | 68,550.32 | 3.75% |
| 8 | ANDHRA PRADESH | 462.35 | 3.82% | 88,395.93 | 4.84% |
| 9 | DELHI | 423.75 | 3.50% | 57,779.48 | 3.16% |
| 10 | BIHAR | 400.48 | 3.31% | 65,518.15 | 3.58% |
| 11 | GUJARAT | 392.48 | 3.24% | 65,150.33 | 3.56% |
| 12 | WEST BENGAL | 354.85 | 2.93% | 61,540.67 | 3.37% |
| 13 | HARYANA | 298.65 | 2.47% | 46,490.93 | 2.54% |
| 14 | KERALA | 287.59 | 2.38% | 40,495.11 | 2.22% |
| 15 | ODISHA | 277.08 | 2.29% | 40,959.41 | 2.24% |
| 16 | PUNJAB | 160.29 | 1.32% | 28,920.21 | 1.58% |
| 17 | ASSAM | 149.14 | 1.23% | 21,725.42 | 1.19% |
| 18 | JHARKHAND | 141.46 | 1.17% | 20,410.18 | 1.12% |
| 19 | CHHATTISGARH | 115.60 | 0.96% | 16,359.98 | 0.90% |
| 20 | UTTARAKHAND | 84.78 | 0.70% | 11,651.77 | 0.64% |
| 21 | JAMMU AND KASHMIR | 45.24 | 0.37% | 6,584.35 | 0.36% |
| 22 | HIMACHAL PRADESH | 42.98 | 0.36% | 5,847.83 | 0.32% |
| 23 | GOA | 29.94 | 0.25% | 4,282.86 | 0.23% |
| 24 | CHANDIGARH | 22.07 | 0.18% | 3,029.82 | 0.17% |
| 25 | PUDUCHERRY | 13.58 | 0.11% | 1,962.33 | 0.11% |
| 26 | ARUNACHAL PRADESH | 11.96 | 0.10% | 1,942.21 | 0.11% |
| 27 | TRIPURA | 10.15 | 0.08% | 1,676.39 | 0.09% |
| 28 | DADRA & NAGAR HAVELI & DAMAN & DIU | 8.57 | 0.07% | 961.27 | 0.05% |
| 29 | MEGHALAYA | 7.73 | 0.06% | 1,350.39 | 0.07% |
| 30 | MANIPUR | 6.41 | 0.05% | 1,756.54 | 0.10% |
| 31 | NAGALAND | 6.17 | 0.05% | 1,402.90 | 0.08% |
| 32 | MIZORAM | 5.98 | 0.05% | 1,229.93 | 0.07% |
| 33 | SIKKIM | 4.82 | 0.04% | 795.78 | 0.04% |
| 34 | ANDAMAN & NICOBAR | 2.63 | 0.02% | 488.59 | 0.03% |
| 35 | LADAKH | 1.68 | 0.01% | 339.04 | 0.02% |
| 36 | LAKSHADWEEP | 0.29 | 0.00% | 40.12 | 0.00% |
| 37 | UNCLASSIFIED# | 2,253.26 | 18.62% | 3,39,170.69 | 18.56% |
| UPI Remitter Banks - Top 50 Banks (Jan'24) | |||||||
|---|---|---|---|---|---|---|---|
| Sr. No. | UPI Remitter Banks (Jan-2024) | Total Volume (In Mn) | Approved % | BD % | TD% | Total Debit Reversal Count (In Mn) | Debit Reversal Success % |
| 1 | State Bank Of India | 3128.97 | 95.62% | 4.19% | 0.19% | 11.58 | 96.85% |
| 2 | HDFC BANK LTD | 1040.25 | 96.49% | 3.51% | 0.00% | 3.34 | 98.84% |
| 3 | Bank of Baroda | 781.72 | 95.28% | 4.68% | 0.04% | 2.71 | 98.54% |
| 4 | Union Bank of India | 753.66 | 94.51% | 4.34% | 1.15% | 7.16 | 46.76% |
| 5 | Punjab National Bank | 618.95 | 94.78% | 4.95% | 0.27% | 2.61 | 88.58% |
| 6 | Kotak Mahindra Bank | 600.83 | 93.64% | 5.19% | 1.17% | 2.08 | 89.49% |
| 7 | Canara Bank | 572.16 | 94.18% | 5.38% | 0.44% | 3.02 | 85.98% |
| 8 | Axis Bank Ltd. | 559.49 | 96.11% | 3.58% | 0.30% | 2.66 | 60.21% |
| 9 | ICICI Bank | 547.55 | 96.59% | 3.32% | 0.08% | 1.64 | 95.72% |
| 10 | Paytm Payments Bank | 410.06 | 96.30% | 3.70% | 0.01% | 0.87 | 98.11% |
| 11 | Bank of India | 389.29 | 95.33% | 4.59% | 0.08% | 1.48 | 91.49% |
| 12 | Indian Bank | 348.89 | 95.15% | 4.47% | 0.37% | 1.51 | 84.37% |
| 13 | Airtel Payments Bank | 337.05 | 89.95% | 8.98% | 1.07% | 1.93 | 69.90% |
| 14 | India Post Payment Bank | 265.13 | 82.66% | 12.20% | 5.14% | 1.67 | 54.81% |
| 15 | Federal Bank | 185.90 | 95.53% | 4.28% | 0.19% | 0.65 | 93.72% |
| 16 | Central Bank Of India | 178.41 | 85.44% | 9.38% | 5.18% | 4.29 | 72.15% |
| 17 | Indian Overseas Bank | 165.09 | 94.28% | 4.41% | 1.31% | 0.99 | 90.36% |
| 18 | UCO Bank | 152.41 | 88.37% | 7.47% | 4.16% | 2.33 | 40.45% |
| 19 | IDBI Bank Limited | 141.57 | 92.73% | 4.28% | 2.98% | 1.31 | 81.40% |
| 20 | Bank of Maharashtra | 136.29 | 94.42% | 4.61% | 0.97% | 0.61 | 76.33% |
| 21 | INDUSIND BANK | 125.63 | 93.06% | 5.97% | 0.97% | 0.68 | 98.66% |
| 22 | Fino Payments Bank Limited FIP | 115.14 | 89.66% | 9.41% | 0.93% | 0.63 | 67.81% |
| 23 | Karnataka Bank | 97.36 | 91.93% | 7.49% | 0.59% | 0.42 | 77.55% |
| 24 | Yes Bank Ltd | 93.47 | 94.92% | 4.98% | 0.10% | 0.25 | 93.00% |
| 25 | IDFC FIRST Bank | 73.92 | 94.20% | 5.77% | 0.03% | 0.03 | 0.00% |
| 26 | Karur Vysya Bank | 59.56 | 94.12% | 5.54% | 0.34% | 0.24 | 92.86% |
| 27 | Bandhan Bank | 49.22 | 87.51% | 6.16% | 6.32% | 0.85 | 68.20% |
| 28 | South Indian Bank | 48.90 | 96.35% | 3.55% | 0.11% | 0.14 | 95.97% |
| 29 | Jammu and Kashmir Bank | 44.46 | 91.55% | 7.21% | 1.24% | 0.31 | 70.87% |
| 30 | Ujjivan Small Finance Bank | 38.33 | 92.75% | 5.66% | 1.59% | 0.29 | 53.05% |
| 31 | AU small Finance Bank | 37.48 | 95.19% | 4.51% | 0.29% | 0.17 | 95.13% |
| 32 | Tri O Tech Solutions Private Limited | 36.62 | 100.00% | 0.00% | 0.00% | NA | NA |
| 33 | City Union Bank | 35.87 | 93.46% | 6.23% | 0.32% | 0.13 | 94.30% |
| 34 | Tamilnad Mercantile Bank | 32.19 | 92.76% | 6.99% | 0.26% | 0.11 | 92.37% |
| 35 | Punjab and Sind Bank | 30.87 | 93.14% | 6.10% | 0.76% | 0.20 | 73.50% |
| 36 | Equitas Bank | 28.56 | 93.04% | 6.96% | 0.00% | 0.11 | 97.83% |
| 37 | Standard Chartered | 26.21 | 97.18% | 2.33% | 0.50% | 0.09 | 77.36% |
| 38 | Andhra Pradesh Grameena Vikas Bank | 25.95 | 86.69% | 11.80% | 1.51% | 0.18 | 49.75% |
| 39 | DBS Bank India Limited | 24.57 | 95.78% | 4.11% | 0.11% | 0.09 | 77.72% |
| 40 | Pragathi Krishna Gramin Bank | 24.49 | 81.75% | 7.84% | 10.41% | 0.30 | 77.98% |
| 41 | Kerala Gramin Bank | 23.61 | 90.10% | 5.94% | 3.96% | 0.25 | 66.77% |
| 42 | Maharashtra Gramin Bank | 22.84 | 84.76% | 10.98% | 4.26% | 0.12 | 58.10% |
| 43 | Saraswat Bank | 21.62 | 94.60% | 4.52% | 0.87% | 0.11 | 62.88% |
| 44 | ESAF Small Finance Bank Ltd. | 20.91 | 88.57% | 5.06% | 6.37% | 0.37 | 63.82% |
| 45 | Rajasthan Marudhara Gramin Bank | 20.02 | 88.02% | 11.36% | 0.63% | 0.09 | 76.77% |
| 46 | Baroda UP Gramin Bank | 19.44 | 54.14% | 9.55% | 36.31% | 1.89 | 27.81% |
| 47 | Citibank | 19.38 | 96.67% | 3.07% | 0.26% | 0.07 | 99.19% |
| 48 | Fincare Small Finance Bank Ltd | 17.51 | 86.69% | 12.38% | 0.92% | 0.09 | 86.11% |
| 49 | RBL Bank | 15.89 | 82.78% | 5.54% | 11.68% | 0.16 | 69.48% |
| 50 | Sarva Haryana Gramin Bank | 14.96 | 92.64% | 6.89% | 0.47% | 0.11 | 60.36% |
| UPI Beneficiary Banks - Top 50 Banks (Jan'24) | |||||||
|---|---|---|---|---|---|---|---|
| Sr.No. | UPI Beneficiary Banks (Jan-2024) | Total Volume (In Mn) | Approved % | BD% | TD% | Deemed Approved % | |
| 1 | Paytm Payments Bank | 2851.38 | 99.90% | 0.07% | 0.03% | 0.00% | |
| 2 | Yes Bank Ltd | 2105.87 | 99.92% | 0.04% | 0.04% | 0.01% | |
| 3 | State Bank Of India | 1306.23 | 99.64% | 0.18% | 0.18% | 0.04% | |
| 4 | Axis Bank Ltd. | 1008.43 | 99.76% | 0.18% | 0.06% | 0.10% | |
| 5 | ICICI Bank | 647.71 | 99.42% | 0.54% | 0.04% | 0.02% | |
| 6 | HDFC BANK LTD | 549.54 | 98.20% | 1.76% | 0.04% | 0.01% | |
| 7 | Bank of Baroda | 336.93 | 99.80% | 0.17% | 0.03% | 0.04% | |
| 8 | Union Bank of India | 324.67 | 99.00% | 0.17% | 0.84% | 0.37% | |
| 9 | Federal Bank | 301.12 | 99.53% | 0.34% | 0.13% | 0.01% | |
| 10 | Punjab National Bank | 271.75 | 99.49% | 0.38% | 0.13% | 0.23% | |
| 11 | Canara Bank | 268.36 | 98.43% | 1.30% | 0.28% | 0.17% | |
| 12 | Kotak Mahindra Bank | 236.42 | 98.61% | 0.47% | 0.92% | 0.39% | |
| 13 | Indian Bank | 192.09 | 98.96% | 0.77% | 0.27% | 0.10% | |
| 14 | Airtel Payments Bank | 184.67 | 99.03% | 0.39% | 0.58% | 0.33% | |
| 15 | Bank of India | 179.80 | 99.64% | 0.25% | 0.11% | 0.04% | |
| 16 | INDUSIND BANK | 129.00 | 98.83% | 0.54% | 0.62% | 0.10% | |
| 17 | India Post Payment Bank | 113.35 | 98.17% | 0.38% | 1.45% | 0.16% | |
| 18 | Central Bank Of India | 85.35 | 96.53% | 0.50% | 2.97% | 1.21% | |
| 19 | Indian Overseas Bank | 76.93 | 98.86% | 0.39% | 0.75% | 0.28% | |
| 20 | UCO Bank | 73.44 | 96.13% | 0.63% | 3.24% | 0.65% | |
| 21 | RBL | 62.06 | 92.29% | 0.36% | 7.35% | 0.26% | |
| 22 | IDBI Bank Limited | 62.06 | 97.83% | 0.43% | 1.74% | 0.40% | |
| 23 | Bank of Maharashtra | 53.88 | 98.92% | 0.24% | 0.84% | 0.14% | |
| 24 | Fino Payments Bank Limited FIP | 45.27 | 97.49% | 1.88% | 0.62% | 0.07% | |
| 25 | Karnataka Bank | 41.79 | 98.66% | 0.81% | 0.54% | 0.08% | |
| 26 | IDFC First Bank | 38.32 | 97.78% | 2.04% | 0.18% | 0.04% | |
| 27 | Karur Vysya Bank | 31.32 | 98.42% | 1.32% | 0.25% | 0.04% | |
| 28 | South Indian Bank | 31.07 | 96.63% | 3.23% | 0.15% | 0.02% | |
| 29 | Bandhan Bank | 28.56 | 94.91% | 0.24% | 4.85% | 0.46% | |
| 30 | AU small Finance Bank | 26.21 | 96.53% | 3.24% | 0.23% | 0.04% | |
| 31 | Tamilnad Mercantile Bank | 20.54 | 99.60% | 0.16% | 0.24% | 0.02% | |
| 32 | Ujjivan Small Finance Bank | 19.40 | 98.06% | 0.85% | 1.09% | 0.41% | |
| 33 | City Union Bank | 18.79 | 97.08% | 2.67% | 0.25% | 0.03% | |
| 34 | Jammu and Kashmir Bank | 18.46 | 99.06% | 0.60% | 0.35% | 0.14% | |
| 35 | Tri O Tech Solutions Private Limited | 17.98 | 95.28% | 4.12% | 0.60% | 0.26% | |
| 36 | Kerala Gramin Bank | 14.38 | 89.31% | 0.24% | 10.46% | 0.88% | |
| 37 | Punjab and Sind Bank | 13.75 | 98.14% | 1.24% | 0.62% | 0.62% | |
| 38 | Pragathi Krishna Gramin Bank | 13.28 | 84.28% | 0.32% | 15.40% | 0.47% | |
| 39 | Equitas Bank | 12.96 | 97.83% | 2.03% | 0.13% | 0.01% | |
| 40 | Andhra Pradesh Grameena Vikas Bank | 12.56 | 97.08% | 1.26% | 1.66% | 0.28% | |
| 41 | ONE MOBIKWIK SYSTEMS LIMITED | 11.31 | 99.99% | 0.00% | 0.01% | 0.00% | |
| 42 | Maharashtra Gramin Bank | 10.74 | 96.11% | 0.28% | 3.62% | 0.33% | |
| 43 | ESAF Small Finance Bank Ltd. | 10.37 | 95.16% | 0.13% | 4.71% | 0.58% | |
| 44 | DBS Bank India Limited | 10.30 | 98.38% | 1.56% | 0.06% | 0.06% | |
| 45 | Baroda UP Gramin Bank | 10.21 | 71.46% | 0.61% | 27.93% | 8.74% | |
| 46 | CITI | 10.02 | 99.87% | 0.00% | 0.13% | 0.20% | |
| 47 | Rajasthan Marudhara Gramin Bank | 9.82 | 99.41% | 0.30% | 0.29% | 0.10% | |
| 48 | Jio Payments Bank | 9.12 | 99.33% | 0.31% | 0.36% | 0.31% | |
| 49 | Fincare Small Finance Bank Ltd | 7.98 | 95.71% | 2.71% | 1.57% | 0.04% | |
| 50 | Andhra Pragathi Grameena Bank | 7.85 | 98.04% | 0.47% | 1.49% | 0.22% | |
| UPI Apps (Jan'24) | |||||||||||
|---|---|---|---|---|---|---|---|---|---|---|---|
| Sr.No. | Application Name | Customer Initiated Transactions | B2C Transactions | B2B Transactions | On-us Transactions | Total | |||||
| Volume (Mn) | Value (Cr) | Volume (Mn) | Value (Cr) | Volume (Mn) | Value (Cr) | Volume (Mn) | Value (Cr) | Volume (Mn) | Value (Cr) | ||
| 1 | PhonePe | 5734.54 | 9,06,793.76 | 0.00 | 0.00 | 0.00 | 0.00 | 0.00 | 0.00 | 5734.54 | 9,06,793.76 |
| 2 | Google Pay | 4442.86 | 6,35,945.58 | 0.00 | 0.00 | 0.00 | 0.00 | 0.00 | 0.00 | 4442.86 | 6,35,945.58 |
| 3 | Paytm Payments Bank App | 1442.41 | 1,64,333.33 | 3.98 | 8.32 | 0.72 | 1291.06 | 122.53 | 26,982.03 | 1569.63 | 1,92,614.74 |
| 4 | Cred | 108.86 | 38,229.82 | 0.00 | 0.00 | 0.00 | 0.00 | 0.00 | 0.00 | 108.86 | 38,229.82 |
| 5 | Axis Bank Apps | 13.31 | 2,775.63 | 66.84 | 2943.22 | 0.02 | 2.72 | 0.00 | 0.00 | 80.17 | 5,721.57 |
| 6 | Amazon Pay | 59.48 | 6,288.95 | 0.00 | 0.00 | 0.00 | 0.00 | 0.00 | 0.00 | 59.48 | 6,288.95 |
| 7 | ICICI Bank Apps | 28.93 | 12,995.05 | 4.68 | 527.09 | 7.01 | 10593.84 | 0.00 | 0.00 | 40.62 | 24,115.98 |
| 8 | FAM | 36.62 | 418.33 | 0.00 | 0.00 | 0.00 | 0.00 | 0.00 | 0.00 | 36.62 | 418.33 |
| 9 | HDFC Bank Apps | 25.05 | 5,458.04 | 5.92 | 17.83 | 0.00 | 0.08 | 0.00 | 0.00 | 30.98 | 5,475.95 |
| 10 | BHIM | 29.98 | 8,778.61 | 0.00 | 0.00 | 0.00 | 0.00 | 0.00 | 0.00 | 29.98 | 8,778.61 |
| 11 | Kotak Mahindra Bank Apps | 28.24 | 4,981.01 | 0.00 | 0.00 | 0.00 | 0.00 | 0.00 | 0.00 | 28.24 | 4,981.01 |
| 12 | 26.08 | 2,132.83 | 0.00 | 0.00 | 0.00 | 0.00 | 0.00 | 0.00 | 26.08 | 2,132.83 | |
| 13 | Yes Bank Apps | 23.01 | 11,585.54 | 0.00 | 0.00 | 0.27 | 33.23 | 0.00 | 0.00 | 23.28 | 11,618.77 |
| 14 | Bajaj Finserv | 19.87 | 2,737.66 | 0.00 | 0.00 | 0.00 | 0.00 | 0.00 | 0.00 | 19.87 | 2,737.66 |
| 15 | Airtel Payments Bank Apps | 13.24 | 902.32 | 0.00 | 0.00 | 0.00 | 0.08 | 0.00 | 0.03 | 13.24 | 902.43 |
| 16 | Groww | 9.41 | 6,540.35 | 0.00 | 0.00 | 0.00 | 0.00 | 0.00 | 0.00 | 9.41 | 6,540.35 |
| 17 | State Bank of India Apps | 6.10 | 2,425.87 | 0.00 | 0.00 | 0.03 | 0.87 | 0.00 | 0.00 | 6.13 | 2,426.73 |
| 18 | Samsung Pay | 5.73 | 518.32 | 0.00 | 0.00 | 0.00 | 0.00 | 0.00 | 0.00 | 5.73 | 518.32 |
| 19 | IDFC Bank Apps | 5.47 | 1,448.50 | 0.00 | 0.00 | 0.00 | 0.00 | 0.00 | 0.00 | 5.47 | 1,448.50 |
| 20 | Federal Bank Apps | 5.33 | 674.05 | 0.00 | 0.00 | 0.00 | 0.00 | 0.00 | 0.00 | 5.33 | 674.05 |
| 21 | Mobikwik | 5.19 | 1,625.48 | 0.00 | 0.00 | 0.00 | 0.00 | 0.00 | 0.00 | 5.19 | 1,625.48 |
| 22 | Jupiter | 4.97 | 665.54 | 0.00 | 0.00 | 0.00 | 0.00 | 0.00 | 0.00 | 4.97 | 665.54 |
| 23 | India Post Payments Bank Apps | 4.69 | 461.95 | 0.00 | 0.00 | 0.00 | 0.00 | 0.00 | 0.00 | 4.69 | 461.95 |
| 24 | Deutsche Bank Apps | 3.89 | 294.60 | 0.00 | 0.00 | 0.00 | 0.03 | 0.00 | 0.00 | 3.89 | 294.63 |
| 25 | Standard Chartered Bank Apps | 2.61 | 195.77 | 0.00 | 0.00 | 1.07 | 550.69 | 0.00 | 0.00 | 3.68 | 746.46 |
| 26 | RBL Bank Apps | 3.15 | 739.53 | 0.00 | 0.03 | 0.20 | 46.97 | 0.00 | 0.00 | 3.35 | 786.52 |
| 27 | Canara Bank Apps | 2.62 | 758.31 | 0.00 | 0.00 | 0.00 | 0.00 | 0.00 | 0.00 | 2.62 | 758.31 |
| 28 | slice | 2.01 | 407.98 | 0.00 | 0.00 | 0.00 | 0.00 | 0.00 | 0.00 | 2.01 | 407.98 |
| 29 | Jio Payments Bank Apps | 1.51 | 137.62 | 0.00 | 0.00 | 0.00 | 0.00 | 0.00 | 0.00 | 1.51 | 137.62 |
| 30 | Punjab National Bank Apps | 1.32 | 335.60 | 0.00 | 0.00 | 0.00 | 0.00 | 0.00 | 0.00 | 1.32 | 335.60 |
| 31 | Indian Bank Apps | 1.29 | 311.48 | 0.00 | 0.00 | 0.00 | 10.91 | 0.00 | 0.00 | 1.29 | 322.39 |
| 32 | SLICE | 1.26 | 41.97 | 0.00 | 0.00 | 0.00 | 0.00 | 0.00 | 0.00 | 1.26 | 41.97 |
| 33 | Omnicard | 1.15 | 37.16 | 0.00 | 0.00 | 0.00 | 0.00 | 0.00 | 0.00 | 1.15 | 37.16 |
| 34 | Bank of Baroda Apps | 1.14 | 505.93 | 0.00 | 0.00 | 0.00 | 10.66 | 0.00 | 0.00 | 1.14 | 516.58 |
| 35 | Union Bank Apps | 1.11 | 451.70 | 0.00 | 0.00 | 0.00 | 0.00 | 0.00 | 0.00 | 1.11 | 451.70 |
| 36 | Navi | 0.96 | 54.50 | 0.00 | 0.00 | 0.00 | 0.00 | 0.00 | 0.00 | 0.96 | 54.50 |
| 37 | Gokiwi | 0.74 | 105.76 | 0.00 | 0.00 | 0.00 | 0.00 | 0.00 | 0.00 | 0.74 | 105.76 |
| 38 | DBS Digibank Apps | 0.70 | 252.85 | 0.00 | 0.00 | 0.00 | 1.80 | 0.00 | 0.00 | 0.70 | 254.66 |
| 39 | Karnataka Bank Apps | 0.67 | 144.11 | 0.00 | 0.00 | 0.00 | 0.00 | 0.00 | 0.00 | 0.67 | 144.11 |
| 40 | AU Small Finance Bank Apps | 0.66 | 259.49 | 0.00 | 0.00 | 0.00 | 0.00 | 0.00 | 0.00 | 0.66 | 259.49 |
| 41 | Central Bank of India Apps | 0.63 | 150.41 | 0.00 | 0.00 | 0.00 | 0.00 | 0.00 | 0.00 | 0.63 | 150.41 |
| 42 | Shriram One | 0.59 | 31.86 | 0.00 | 0.00 | 0.00 | 0.00 | 0.00 | 0.00 | 0.59 | 31.86 |
| 43 | FIFEDERAL | 0.47 | 57.15 | 0.00 | 0.00 | 0.00 | 0.00 | 0.00 | 0.00 | 0.47 | 57.15 |
| 44 | BPAYWALLET | 0.43 | 88.49 | 0.00 | 0.00 | 0.00 | 0.00 | 0.00 | 0.00 | 0.43 | 88.49 |
| 45 | MBK | 0.39 | 57.77 | 0.00 | 0.00 | 0.00 | 0.00 | 0.00 | 0.00 | 0.39 | 57.77 |
| 46 | South Indian Bank Apps | 0.33 | 105.23 | 0.00 | 0.00 | 0.00 | 0.00 | 0.00 | 0.00 | 0.33 | 105.23 |
| 47 | Bank of India Apps | 0.29 | 108.18 | 0.00 | 0.00 | 0.00 | 0.00 | 0.00 | 0.00 | 0.29 | 108.18 |
| 48 | Fino Payments bank Apps | 0.29 | 31.67 | 0.00 | 0.00 | 0.00 | 0.00 | 0.00 | 0.00 | 0.29 | 31.67 |
| 49 | INDIE - Indus Ind | 0.25 | 42.84 | 0.00 | 0.00 | 0.00 | 0.00 | 0.00 | 0.00 | 0.25 | 42.84 |
| 50 | UCO Bank Apps | 0.21 | 76.62 | 0.00 | 0.00 | 0.00 | 0.00 | 0.00 | 0.00 | 0.21 | 76.62 |
| 51 | HSBC Bank Apps | 0.20 | 117.97 | 0.00 | 0.03 | 0.00 | 0.00 | 0.00 | 0.00 | 0.20 | 118.00 |
| 52 | Tamilnad Mercantile Bank Apps | 0.12 | 32.85 | 0.00 | 0.00 | 0.00 | 0.00 | 0.00 | 0.00 | 0.12 | 32.85 |
| 53 | Indian Overseas Bank Apps | 0.11 | 29.92 | 0.00 | 0.00 | 0.00 | 0.00 | 0.00 | 0.00 | 0.11 | 29.92 |
| 54 | Ultracash | 0.08 | 5.95 | 0.00 | 0.00 | 0.00 | 0.00 | 0.00 | 0.00 | 0.08 | 5.95 |
| 55 | Citi Bank Apps | 0.08 | 79.39 | 0.00 | 0.00 | 0.00 | 0.00 | 0.00 | 0.00 | 0.08 | 79.39 |
| 56 | Digikhata | 0.08 | 30.34 | 0.00 | 0.00 | 0.00 | 0.00 | 0.00 | 0.00 | 0.08 | 30.34 |
| 57 | TataNeu | 0.08 | 11.48 | 0.00 | 0.00 | 0.00 | 0.00 | 0.00 | 0.00 | 0.08 | 11.48 |
| 58 | City Union Bank Apps | 0.08 | 25.49 | 0.00 | 0.00 | 0.00 | 0.00 | 0.00 | 0.00 | 0.08 | 25.49 |
| 59 | IDBI Bank Apps | 0.08 | 42.31 | 0.00 | 0.00 | 0.00 | 0.00 | 0.00 | 0.00 | 0.08 | 42.31 |
| 60 | Jupiter Edge (LivQuick PPI) | 0.05 | 14.71 | 0.00 | 0.00 | 0.00 | 0.00 | 0.00 | 0.00 | 0.05 | 14.71 |
| 61 | Karur Vysya Bank Apps | 0.04 | 15.23 | 0.00 | 0.00 | 0.00 | 0.00 | 0.00 | 0.00 | 0.04 | 15.23 |
| 62 | NSDL Payments Bank Apps | 0.04 | 5.77 | 0.00 | 0.00 | 0.00 | 0.00 | 0.00 | 0.00 | 0.04 | 5.77 |
| 63 | Bank of Maharashtra Apps | 0.04 | 8.06 | 0.00 | 0.00 | 0.00 | 0.00 | 0.00 | 0.00 | 0.04 | 8.06 |
| 64 | DHANI | 0.04 | 2.71 | 0.00 | 0.00 | 0.00 | 0.00 | 0.00 | 0.00 | 0.04 | 2.71 |
| 65 | PAYTMWALLET | 0.03 | 3.11 | 0.00 | 0.00 | 0.00 | 0.00 | 0.00 | 0.00 | 0.03 | 3.11 |
| 66 | MakeMyTrip | 0.03 | 15.48 | 0.00 | 0.00 | 0.00 | 0.00 | 0.00 | 0.00 | 0.03 | 15.48 |
| 67 | Equitas Small Finance Bank Apps | 0.03 | 23.19 | 0.00 | 0.00 | 0.00 | 0.00 | 0.00 | 0.00 | 0.03 | 23.19 |
| 68 | Timepay | 0.03 | 0.33 | 0.00 | 0.00 | 0.00 | 0.00 | 0.00 | 0.00 | 0.03 | 0.33 |
| 69 | Allahabad Bank Apps | 0.03 | 6.51 | 0.00 | 0.00 | 0.00 | 0.00 | 0.00 | 0.00 | 0.03 | 6.51 |
| 70 | Other Apps | 0.13 | 31.46 | 0.00 | 0.00 | 0.00 | 0.00 | 0.00 | 0.00 | 0.13 | 31.46 |
| 71 | CBDC Apps | 0.80 | 46.45 | 0.00 | 0.00 | 0.07 | 1.63 | 0.00 | 0.00 | 0.88 | 48.08 |
Note:-
| UPI P2P and P2M Transactions | ||||||
|---|---|---|---|---|---|---|
| Month | Total | P2P | P2M | |||
| Volume (Mn) | Value (Cr) | Volume (Mn) | Value (Cr) | Volume (Mn) | Value (Cr) | |
| Jan'24 | 12,203.02 | 18,41,083.97 | 4,753.09 | 13,40,323.61 | 7,449.93 | 5,00,760.37 |


| UPI Payer PSP Performance (Jan'24) | |||||
|---|---|---|---|---|---|
| Sr. No. | Payer PSP | Total Volume (In Mn) | Approved % | BD % | TD % |
| 1 | YES BANK LTD | 3419.78 | 94.65% | 5.21% | 0.15% |
| 2 | AXIS BANK LTD. | 3183.17 | 94.91% | 4.93% | 0.16% |
| 3 | ICICI BANK | 2320.91 | 94.82% | 4.99% | 0.19% |
| 4 | PAYTM PAYMENTS BANK | 1543.98 | 93.73% | 6.12% | 0.16% |
| 5 | HDFC BANK LTD | 1146.07 | 95.81% | 4.07% | 0.12% |
| 6 | STATE BANK OF INDIA | 1088.91 | 95.73% | 4.18% | 0.09% |
| 7 | TRI O TECH SOLUTIONS PRIVATE LIMITED | 36.62 | 100.00% | 0.00% | 0.00% |
| 8 | BHIM | 31.82 | 94.20% | 5.67% | 0.14% |
| 9 | KOTAK MAHINDRA BANK | 28.42 | 100.00% | 0.00% | 0.00% |
| 10 | AIRTEL PAYMENTS BANK | 14.13 | 93.67% | 6.22% | 0.11% |
| 11 | RBL Bank | 6.46 | 96.06% | 3.81% | 0.13% |
| 12 | IDFC First Bank | 5.77 | 99.21% | 0.78% | 0.01% |
| 13 | FEDERAL BANK | 5.42 | 98.44% | 1.55% | 0.01% |
| 14 | INDIA POST PAYMENT BANK | 4.69 | 99.98% | 0.02% | 0.00% |
| 15 | DEUTSCHE BANK CORP | 3.87 | 100.00% | 0.00% | 0.00% |
| UPI Payee PSP Performance (Jan'24) | |||||
|---|---|---|---|---|---|
| Sr. No. | Payee PSP | Total Volume (In Mn) | Approved % | BD % | TD % |
| 1 | YES BANK LTD | 4044.35 | 94.81% | 5.04% | 0.15% |
| 2 | PAYTM PAYMENTS BANK | 3141.54 | 95.68% | 4.17% | 0.15% |
| 3 | AXIS BANK LTD. | 1696.08 | 94.20% | 5.63% | 0.17% |
| 4 | ICICI BANK | 1408.71 | 93.92% | 5.92% | 0.16% |
| 5 | STATE BANK OF INDIA | 637.86 | 94.43% | 5.44% | 0.13% |
| 6 | HDFC BANK LTD | 627.74 | 95.04% | 4.84% | 0.12% |
| 7 | FEDERAL BANK | 231.87 | 96.82% | 3.04% | 0.14% |
| 8 | INDUSIND BANK | 69.20 | 95.19% | 4.68% | 0.14% |
| 9 | RBL Bank | 56.69 | 90.97% | 8.80% | 0.23% |
| 10 | COSMOS BANK | 43.80 | 90.19% | 9.60% | 0.20% |
| 11 | KOTAK MAHINDRA BANK | 28.77 | 95.25% | 4.61% | 0.14% |
| 12 | INDIAN BANK | 29.15 | 92.06% | 7.72% | 0.22% |
| 13 | CANARA BANK | 27.55 | 96.63% | 3.26% | 0.11% |
| 14 | AIRTEL PAYMENTS BANK | 25.58 | 93.62% | 6.22% | 0.16% |
| 15 | TRI O TECH SOLUTIONS PRIVATE LIMITED | 18.29 | 93.24% | 6.52% | 0.24% |
| UPI Merchant Category-wise Classification - January'24 (Arranged by Volume) | ||||
|---|---|---|---|---|
| Type | MCC | Description | Volume (in Mn) | Value (in Cr.) |
| High Transacting Categories | 5411 | Groceries and supermarkets | 1,480.21 | 38,445.30 |
| 5814 | Fast food restaurants | 701.14 | 8,761.88 | |
| 5812 | Eating places and restaurants | 694.81 | 11,761.04 | |
| 4814 | Telecommunication services, including local and long distance calls, credit card calls, calls through use of magnetic stripe reading telephones and faxes | 613.87 | 14,435.34 | |
| 5541 | Service stations (with or without ancillary services) | 337.69 | 21,988.27 | |
| 5311 | Department stores | 335.56 | 7,136.98 | |
| 5816 | Digital Goods: Games | 294.54 | 9,634.28 | |
| 5912 | Drug stores and pharmacies | 176.21 | 6,648.95 | |
| 5462 | Bakeries | 152.35 | 2,220.59 | |
| 4900 | Utilities electric, gas, water and sanitary | 106.31 | 10,140.11 | |
| Medium Transacting Categories | 5451 | Dairies | 88.70 | 2,030.76 |
| 6540 | Debit card to wallet credit (Wallet top up) | 85.79 | 5,622.90 | |
| 7299 | Miscellaneous personal services not elsewhere classified | 83.30 | 2,677.88 | |
| 5499 | Miscellaneous food shops convenience and speciality retail outlets | 78.96 | 3,173.55 | |
| 5813 | Drinking places (alcoholic beverages) bars, taverns, night-clubs, cocktail lounges and discothques | 76.62 | 2,903.74 | |
| 7322 | Debt collection agencies | 74.28 | 60,916.27 | |
| 6211 | Securities brokers and dealers | 58.64 | 62,812.48 | |
| 5422 | Freezer and locker meat provisioners | 57.38 | 1,808.70 | |
| 5137 | Mens, womens and childrens uniforms and commercial clothing | 56.59 | 5,782.09 | |
| 5441 | Candy, nut and confectionery shops | 53.41 | 1,010.06 | |
| All Other Categories | 5732 | Electronics shops | 50.02 | 5,711.27 |
| 6012 | Financial institutions merchandise and services | 49.76 | 16,448.32 | |
| 9399 | Government services not elsewhere classified | 46.84 | 5,162.98 | |
| 7230 | Beauty and barber shops | 44.87 | 1,343.90 | |
| 5399 | Miscellaneous general merchandise | 43.43 | 4,228.39 | |
| 5921 | Package shops beer, wine and liquor | 43.28 | 1,853.47 | |
| 4112 | Passenger railways | 37.13 | 2,126.07 | |
| 5691 | Mens and womens clothing shops | 34.84 | 4,380.93 | |
| 5943 | Stationery, office and school supply shops | 34.24 | 942.15 | |
| Others | 1,459.16 | 1,78,651.72 | ||
| Total | 7,449.92 | 5,00,760.37 | ||
| State-wise UPI Product Statistics* (Jan'24) | |||||
|---|---|---|---|---|---|
| Sr. No. | State / Union Territory | Volume (in Mn ) | Volume Contribution (%) | Value (in Cr.) | Value Contribution (%) |
| 1 | MAHARASHTRA | 1,729.30 | 14.17% | 2,30,102.34 | 12.50% |
| 2 | KARNATAKA | 987.74 | 8.09% | 1,36,780.78 | 7.43% |
| 3 | UTTAR PRADESH | 821.19 | 6.73% | 1,18,540.28 | 6.44% |
| 4 | TELANGANA | 736.18 | 6.03% | 1,23,049.67 | 6.68% |
| 5 | TAMIL NADU | 551.15 | 4.52% | 88,612.57 | 4.81% |
| 6 | RAJASTHAN | 506.55 | 4.15% | 81,026.02 | 4.40% |
| 7 | ANDHRA PRADESH | 465.48 | 3.81% | 90,296.94 | 4.90% |
| 8 | MADHYA PRADESH | 451.90 | 3.70% | 62,297.59 | 3.38% |
| 9 | DELHI | 393.65 | 3.23% | 53,572.83 | 2.91% |
| 10 | GUJARAT | 376.73 | 3.09% | 62,424.28 | 3.39% |
| 11 | BIHAR | 359.24 | 2.94% | 57,546.14 | 3.13% |
| 12 | WEST BENGAL | 334.00 | 2.74% | 57,876.90 | 3.14% |
| 13 | HARYANA | 302.68 | 2.48% | 46,875.26 | 2.55% |
| 14 | KERALA | 282.00 | 2.31% | 40,654.71 | 2.21% |
| 15 | ODISHA | 259.26 | 2.12% | 37,962.41 | 2.06% |
| 16 | PUNJAB | 154.33 | 1.26% | 28,653.41 | 1.56% |
| 17 | JHARKHAND | 137.14 | 1.12% | 19,328.20 | 1.05% |
| 18 | ASSAM | 130.05 | 1.07% | 19,230.38 | 1.04% |
| 19 | CHHATTISGARH | 112.52 | 0.92% | 15,870.58 | 0.86% |
| 20 | UTTARAKHAND | 85.68 | 0.70% | 11,783.03 | 0.64% |
| 21 | JAMMU AND KASHMIR | 43.49 | 0.36% | 6,368.15 | 0.35% |
| 22 | HIMACHAL PRADESH | 41.92 | 0.34% | 5,787.90 | 0.31% |
| 23 | GOA | 29.59 | 0.24% | 4,317.69 | 0.23% |
| 24 | CHANDIGARH | 20.64 | 0.17% | 2,843.49 | 0.15% |
| 25 | PUDUCHERRY | 13.25 | 0.11% | 1,889.21 | 0.10% |
| 26 | ARUNACHAL PRADESH | 11.25 | 0.09% | 1,838.79 | 0.10% |
| 27 | TRIPURA | 8.93 | 0.07% | 1,475.69 | 0.08% |
| 28 | DADRA & NAGAR HAVELI & DAMAN & DIU | 8.70 | 0.07% | 952.91 | 0.05% |
| 29 | MEGHALAYA | 6.53 | 0.05% | 1,178.38 | 0.06% |
| 30 | MANIPUR | 6.47 | 0.05% | 1,730.66 | 0.09% |
| 31 | NAGALAND | 5.33 | 0.04% | 1,259.10 | 0.07% |
| 32 | MIZORAM | 5.23 | 0.04% | 1,092.04 | 0.06% |
| 33 | SIKKIM | 4.58 | 0.04% | 786.07 | 0.04% |
| 34 | ANDAMAN & NICOBAR | 2.65 | 0.02% | 493.51 | 0.03% |
| 35 | LADAKH | 1.73 | 0.01% | 345.77 | 0.02% |
| 36 | LAKSHADWEEP | 0.28 | 0.00% | 41.42 | 0.00% |
| 37 | UNCLASSIFIED# | 2,815.68 | 23.07% | 4,26,198.87 | 23.15% |
| UPI Remitter Banks - Top 50 Banks (Dec'23) | |||||||
|---|---|---|---|---|---|---|---|
| Sr. No. | UPI Remitter Banks (Sep-2023) | Total Volume (In Mn) | Approved % | BD % | TD% | Total Debit Reversal Count (In Mn) | Debit Reversal Success % |
| 1 | State Bank Of India | 3073.18 | 95.23% | 4.34% | 0.43% | 12.75 | 83.74% |
| 2 | HDFC BANK LTD | 1040.77 | 96.50% | 3.44% | 0.06% | 3.63 | 97.57% |
| 3 | Bank of Baroda | 766.81 | 94.55% | 4.94% | 0.51% | 3.30 | 87.02% |
| 4 | Union Bank of India | 745.87 | 94.86% | 4.38% | 0.76% | 5.38 | 59.66% |
| 5 | Punjab National Bank | 607.36 | 95.25% | 4.59% | 0.17% | 2.35 | 97.94% |
| 6 | Kotak Mahindra Bank | 588.94 | 94.40% | 5.11% | 0.49% | 2.47 | 68.44% |
| 7 | Canara Bank | 563.67 | 94.26% | 5.38% | 0.37% | 2.43 | 86.37% |
| 8 | Axis Bank Ltd. | 562.18 | 96.43% | 3.57% | 0.01% | 1.67 | 87.70% |
| 9 | ICICI Bank | 556.61 | 96.39% | 3.28% | 0.33% | 2.06 | 82.59% |
| 10 | Paytm Payments Bank | 410.19 | 96.37% | 3.63% | 0.00% | 0.79 | 97.55% |
| 11 | Bank of India | 384.87 | 95.78% | 4.03% | 0.18% | 1.47 | 86.96% |
| 12 | Indian Bank | 338.76 | 95.28% | 4.52% | 0.20% | 1.19 | 90.68% |
| 13 | Airtel Payments Bank | 320.02 | 88.41% | 8.15% | 3.43% | 3.34 | 0.00% |
| 14 | India Post Payment Bank | 247.32 | 82.43% | 11.85% | 5.72% | 2.43 | 32.30% |
| 15 | Federal Bank | 184.64 | 95.56% | 4.34% | 0.10% | 0.49 | 98.15% |
| 16 | Central Bank Of India | 177.99 | 86.46% | 11.95% | 1.59% | 1.98 | 82.45% |
| 17 | Indian Overseas Bank | 160.68 | 93.86% | 4.42% | 1.72% | 1.06 | 91.36% |
| 18 | UCO Bank | 147.86 | 94.38% | 5.06% | 0.56% | 0.70 | 68.51% |
| 19 | IDBI Bank Limited | 139.37 | 94.99% | 3.80% | 1.21% | 0.84 | 90.96% |
| 20 | Bank of Maharashtra | 133.33 | 94.32% | 4.68% | 1.00% | 0.57 | 75.93% |
| 21 | INDUSIND BANK | 120.30 | 92.92% | 6.12% | 0.97% | 0.76 | 88.04% |
| 22 | Fino Payments Bank Limited FIP | 107.84 | 90.01% | 8.54% | 1.45% | 0.49 | 71.76% |
| 23 | Yes Bank Ltd | 97.36 | 95.39% | 4.51% | 0.10% | 0.22 | 96.73% |
| 24 | Karnataka Bank | 96.35 | 92.95% | 5.48% | 1.57% | 0.54 | 52.69% |
| 25 | IDFC FIRST Bank | 75.11 | 93.58% | 6.38% | 0.04% | 0.25 | 90.45% |
| 26 | Karur Vysya Bank | 58.61 | 93.73% | 5.71% | 0.56% | 0.29 | 97.83% |
| 27 | South Indian Bank | 48.80 | 96.11% | 3.82% | 0.08% | 0.12 | 97.34% |
| 28 | Jammu and Kashmir Bank | 48.75 | 69.74% | 25.78% | 4.48% | 0.65 | 13.43% |
| 29 | Bandhan Bank | 47.39 | 92.57% | 6.71% | 0.72% | 0.20 | 98.39% |
| 30 | Ujjivan Small Finance Bank | 36.67 | 93.65% | 5.57% | 0.78% | 0.19 | 68.80% |
| 31 | AU small Finance Bank | 36.18 | 94.68% | 4.30% | 1.02% | 0.26 | 99.01% |
| 32 | City Union Bank | 34.96 | 93.56% | 6.10% | 0.34% | 0.11 | 94.31% |
| 33 | Tri O Tech Solutions Private Limited | 34.24 | 100.00% | 0.00% | 0.00% | NA | NA |
| 34 | Punjab and Sind Bank | 31.50 | 89.74% | 6.25% | 4.01% | 0.57 | 24.84% |
| 35 | Tamilnad Mercantile Bank | 30.97 | 94.34% | 5.15% | 0.51% | 0.12 | 89.05% |
| 36 | Equitas Bank | 28.13 | 93.09% | 6.89% | 0.02% | 0.10 | 97.07% |
| 37 | Standard Chartered | 27.13 | 95.82% | 2.10% | 2.08% | 0.19 | 48.75% |
| 38 | Kerala Gramin Bank | 25.29 | 93.63% | 6.11% | 0.27% | 0.08 | 92.04% |
| 39 | DBS Bank India Limited | 24.94 | 95.90% | 4.08% | 0.02% | 0.08 | 78.43% |
| 40 | Andhra Pradesh Grameena Vikas Bank | 24.85 | 88.05% | 10.56% | 1.39% | 0.10 | 76.31% |
| 41 | Pragathi Krishna Gramin Bank | 23.88 | 91.21% | 8.32% | 0.46% | 0.11 | 88.68% |
| 42 | Maharashtra Gramin Bank | 22.04 | 85.60% | 10.75% | 3.65% | 0.09 | 67.31% |
| 43 | Saraswat Bank | 21.70 | 94.44% | 4.88% | 0.68% | 0.09 | 67.20% |
| 44 | Baroda UP Gramin Bank | 20.77 | 51.12% | 9.10% | 39.78% | 2.65 | 12.92% |
| 45 | Citibank | 20.47 | 96.75% | 3.06% | 0.19% | 0.07 | 98.45% |
| 46 | ESAF Small Finance Bank Ltd. | 19.79 | 94.55% | 5.13% | 0.31% | 0.08 | 93.77% |
| 47 | HDFC Bank Credit Card HCB | 19.02 | 94.17% | 5.61% | 0.21% | 0.16 | 97.49% |
| 48 | Rajasthan Marudhara Gramin Bank | 18.75 | 87.95% | 10.82% | 1.23% | 0.09 | 69.57% |
| 49 | Fincare Small Finance Bank Ltd | 16.01 | 87.76% | 11.47% | 0.76% | 0.07 | 92.37% |
| 50 | RBL Bank | 14.97 | 80.11% | 6.09% | 13.80% | 0.25 | 39.77% |
| UPI Beneficiary Banks - Top 50 Banks (Dec'23) | |||||||
|---|---|---|---|---|---|---|---|
| Sr.No. | UPI Beneficiary Banks (Sep-2023) | Total Volume (In Mn) | Approved % | BD% | TD% | Deemed Approved % | |
| 1 | Paytm Payments Bank | 2835.27 | 99.90% | 0.07% | 0.03% | 0.00% | |
| 2 | Yes Bank Ltd | 2269.48 | 99.95% | 0.04% | 0.01% | 0.00% | |
| 3 | State Bank Of India | 1252.21 | 99.50% | 0.19% | 0.30% | 0.07% | |
| 4 | Axis Bank Ltd. | 967.52 | 99.90% | 0.09% | 0.01% | 0.01% | |
| 5 | ICICI Bank | 647.97 | 99.36% | 0.48% | 0.16% | 0.07% | |
| 6 | HDFC BANK LTD | 549.41 | 97.80% | 2.13% | 0.06% | 0.05% | |
| 7 | Bank of Baroda | 333.64 | 99.32% | 0.25% | 0.43% | 0.13% | |
| 8 | Union Bank of India | 326.55 | 99.49% | 0.19% | 0.33% | 0.26% | |
| 9 | Federal Bank | 291.79 | 99.65% | 0.29% | 0.06% | 0.00% | |
| 10 | Punjab National Bank | 270.17 | 99.41% | 0.51% | 0.08% | 0.11% | |
| 11 | Canara Bank | 268.75 | 99.06% | 0.67% | 0.27% | 0.12% | |
| 12 | Kotak Mahindra Bank | 233.06 | 99.28% | 0.46% | 0.26% | 0.22% | |
| 13 | Indian Bank | 182.11 | 98.93% | 0.67% | 0.40% | 0.04% | |
| 14 | Bank of India | 179.90 | 99.58% | 0.24% | 0.17% | 0.08% | |
| 15 | Airtel Payments Bank | 174.41 | 97.63% | 0.43% | 1.94% | 0.59% | |
| 16 | INDUSIND BANK | 135.25 | 99.07% | 0.34% | 0.59% | 0.50% | |
| 17 | India Post Payment Bank | 108.03 | 96.76% | 0.37% | 2.87% | 0.25% | |
| 18 | Central Bank Of India | 85.35 | 98.70% | 0.51% | 0.80% | 0.45% | |
| 19 | Indian Overseas Bank | 75.21 | 98.44% | 0.32% | 1.23% | 0.50% | |
| 20 | UCO Bank | 73.18 | 98.84% | 0.68% | 0.48% | 0.11% | |
| 21 | IDBI Bank Limited | 62.13 | 98.98% | 0.43% | 0.59% | 0.15% | |
| 22 | RBL Bank | 55.75 | 91.43% | 0.30% | 8.27% | 0.41% | |
| 23 | Bank of Maharashtra | 52.68 | 98.84% | 0.28% | 0.88% | 0.15% | |
| 24 | Fino Payments Bank Limited | 50.18 | 97.67% | 1.33% | 1.00% | 0.05% | |
| 25 | IDFC FIRST Bank | 47.49 | 98.43% | 1.53% | 0.04% | 0.03% | |
| 26 | Karnataka Bank | 42.03 | 98.09% | 0.54% | 1.37% | 0.23% | |
| 27 | South Indian Bank | 31.89 | 99.52% | 0.41% | 0.07% | 0.01% | |
| 28 | Karur Vysya Bank | 31.85 | 98.07% | 1.58% | 0.35% | 0.04% | |
| 29 | Bandhan Bank | 28.20 | 98.57% | 0.43% | 1.00% | 0.00% | |
| 30 | AU small Finance Bank | 24.92 | 96.89% | 2.38% | 0.73% | 0.36% | |
| 31 | Tamilnad Mercantile Bank | 19.90 | 99.35% | 0.19% | 0.47% | 0.03% | |
| 32 | Ujjivan Small Finance Bank | 19.06 | 98.60% | 0.82% | 0.59% | 0.26% | |
| 33 | City Union Bank | 18.56 | 98.56% | 1.13% | 0.31% | 0.05% | |
| 34 | Jammu and Kashmir Bank | 17.46 | 97.22% | 0.37% | 2.41% | 1.04% | |
| 35 | Tri O Tech Solutions Private Limited | 16.54 | 95.50% | 4.49% | 0.01% | 0.00% | |
| 36 | Kerala Gramin Bank | 14.38 | 99.62% | 0.25% | 0.12% | 0.15% | |
| 37 | Punjab and Sind Bank | 14.18 | 97.23% | 0.45% | 2.32% | 0.95% | |
| 38 | Equitas Bank | 12.95 | 97.93% | 1.91% | 0.15% | 0.01% | |
| 39 | Pragathi Krishna Gramin Bank | 12.34 | 99.42% | 0.42% | 0.17% | 0.20% | |
| 40 | Andhra Pradesh Grameena Vikas Bank | 11.92 | 98.71% | 0.97% | 0.32% | 0.07% | |
| 41 | Baroda UP Gramin Bank | 10.80 | 71.76% | 0.67% | 27.57% | 10.95% | |
| 42 | Maharashtra Gramin Bank | 10.40 | 96.73% | 0.28% | 2.99% | 0.17% | |
| 43 | DBS Bank India Limited | 10.08 | 98.53% | 1.44% | 0.03% | 0.03% | |
| 44 | ESAF Small Finance Bank Ltd. | 10.01 | 99.62% | 0.13% | 0.24% | 0.11% | |
| 45 | Rajasthan Marudhara Gramin Bank | 9.36 | 98.92% | 0.50% | 0.58% | 0.10% | |
| 46 | ONE MOBIKWIK SYSTEMS LIMITED | 8.95 | 99.65% | 0.00% | 0.35% | 0.01% | |
| 47 | Andhra Pragathi Grameena Bank | 7.80 | 95.75% | 1.02% | 3.22% | 0.18% | |
| 48 | Saraswat Bank | 7.54 | 99.25% | 0.19% | 0.56% | 0.18% | |
| 49 | CITI Bank | 7.31 | 99.82% | 0.00% | 0.18% | 0.22% | |
| 50 | Fincare Small Finance Bank Ltd | 7.26 | 95.90% | 1.92% | 2.17% | 0.01% | |
| UPI Apps (Dec'23) | |||||||||||
|---|---|---|---|---|---|---|---|---|---|---|---|
| Sr.No. | Application Name | Customer Initiated Transactions | B2C Transactions | B2B Transactions | On-us Transactions | Total | |||||
| Volume (Mn) | Value (Cr) | Volume (Mn) | Value (Cr) | Volume (Mn) | Value (Cr) | Volume (Mn) | Value (Cr) | Volume (Mn) | Value (Cr) | ||
| 1 | PhonePe | 5642.66 | 9,01,006.65 | 0.00 | 0.00 | 0.00 | 0.00 | 0.00 | 0.00 | 5642.66 | 9,01,006.65 |
| 2 | Google Pay | 4375.29 | 6,29,285.36 | 0.00 | 0.00 | 0.00 | 0.00 | 0.00 | 0.00 | 4375.29 | 6,29,285.36 |
| 3 | Paytm Payments Bank App | 1442.58 | 1,65,694.96 | 4.38 | 8.39 | 0.75 | 1342.34 | 125.89 | 24,510.03 | 1573.61 | 1,91,555.71 |
| 4 | Cred | 105.31 | 37,293.27 | 0.00 | 0.00 | 0.00 | 0.00 | 0.00 | 0.00 | 105.31 | 37,293.27 |
| 5 | Axis Bank Apps | 13.29 | 2,657.21 | 73.58 | 3439.12 | 0.03 | 3.68 | 0.00 | 0.00 | 86.90 | 6,100.01 |
| 6 | Amazon Pay | 54.16 | 5,982.84 | 0.00 | 0.00 | 0.00 | 0.00 | 0.00 | 0.00 | 54.16 | 5,982.84 |
| 7 | ICICI Bank Apps | 28.73 | 11,167.31 | 4.46 | 534.86 | 6.90 | 9182.39 | 0.00 | 0.00 | 40.09 | 20,884.56 |
| 8 | Fampay | 34.23 | 392.53 | 0.00 | 0.00 | 0.00 | 0.00 | 0.00 | 0.00 | 34.23 | 392.53 |
| 9 | Yes Bank Apps | 27.99 | 12,305.58 | 0.00 | 0.00 | 0.37 | 63.28 | 0.00 | 0.00 | 28.37 | 12,368.87 |
| 10 | Kotak Mahindra Bank Apps | 26.36 | 4,738.20 | 0.00 | 0.00 | 0.00 | 0.00 | 0.00 | 0.00 | 26.36 | 4,738.20 |
| 11 | 25.25 | 2,113.01 | 0.00 | 0.00 | 0.00 | 0.00 | 0.00 | 0.00 | 25.25 | 2,113.01 | |
| 12 | BHIM | 24.30 | 8,431.47 | 0.00 | 0.00 | 0.00 | 0.00 | 0.00 | 0.00 | 24.30 | 8,431.47 |
| 13 | HDFC Bank Apps | 23.68 | 6,095.52 | 0.00 | 0.00 | 0.00 | 0.03 | 0.00 | 0.00 | 23.68 | 6,095.54 |
| 14 | Bajaj Finserv | 18.08 | 2,580.43 | 0.00 | 0.00 | 0.00 | 0.00 | 0.00 | 0.00 | 18.08 | 2,580.43 |
| 15 | Airtel Payments Bank Apps | 12.26 | 851.64 | 0.00 | 0.00 | 0.00 | 0.00 | 0.28 | 31.71 | 12.54 | 883.36 |
| 16 | Groww | 6.58 | 4,039.81 | 0.00 | 0.00 | 0.00 | 0.00 | 0.00 | 0.00 | 6.58 | 4,039.81 |
| 17 | State Bank of India Apps | 6.13 | 2,362.05 | 0.00 | 0.00 | 0.03 | 0.85 | 0.00 | 0.00 | 6.16 | 2,362.90 |
| 18 | Samsung Pay | 6.08 | 557.26 | 0.00 | 0.00 | 0.00 | 0.00 | 0.00 | 0.00 | 6.08 | 557.26 |
| 19 | Federal Bank Apps | 5.95 | 745.40 | 0.00 | 0.00 | 0.00 | 0.01 | 0.00 | 0.00 | 5.95 | 745.41 |
| 20 | IDFC Bank Apps | 5.24 | 1,306.50 | 0.00 | 0.00 | 0.00 | 0.00 | 0.00 | 0.00 | 5.24 | 1,306.50 |
| 21 | Mobikwik | 4.95 | 1,580.30 | 0.00 | 0.00 | 0.00 | 0.00 | 0.00 | 0.00 | 4.95 | 1,580.30 |
| 22 | India Post Payments Bank Apps | 4.87 | 454.50 | 0.00 | 0.00 | 0.00 | 0.00 | 0.00 | 0.00 | 4.87 | 454.50 |
| 23 | Jupiter | 4.86 | 656.67 | 0.00 | 0.00 | 0.00 | 0.00 | 0.00 | 0.00 | 4.86 | 656.67 |
| 24 | Deutsche Bank Apps | 3.71 | 223.34 | 0.00 | 0.00 | 0.00 | 0.03 | 0.00 | 0.00 | 3.71 | 223.36 |
| 25 | Standard Chartered Bank Apps | 3.17 | 249.27 | 0.00 | 0.00 | 0.47 | 157.36 | 0.00 | 0.00 | 3.63 | 406.63 |
| 26 | Canara Bank Apps | 2.55 | 719.50 | 0.00 | 0.00 | 0.00 | 0.00 | 0.00 | 0.00 | 2.55 | 719.50 |
| 27 | RBL Bank Apps | 1.93 | 697.43 | 0.00 | 0.01 | 0.21 | 55.79 | 0.00 | 0.00 | 2.14 | 753.23 |
| 28 | slice | 1.96 | 403.07 | 0.00 | 0.00 | 0.00 | 0.00 | 0.00 | 0.00 | 1.96 | 403.07 |
| 29 | Jio Payments Bank Apps | 1.35 | 125.06 | 0.00 | 0.00 | 0.00 | 0.00 | 0.00 | 0.00 | 1.35 | 125.06 |
| 30 | Punjab National Bank Apps | 1.26 | 276.47 | 0.00 | 0.00 | 0.00 | 0.00 | 0.00 | 0.00 | 1.26 | 276.47 |
| 31 | Omnicard | 1.16 | 36.26 | 0.00 | 0.00 | 0.00 | 0.00 | 0.00 | 0.00 | 1.16 | 36.26 |
| 32 | Bank of Baroda Apps | 1.05 | 453.40 | 0.00 | 0.00 | 0.00 | 10.68 | 0.00 | 0.00 | 1.05 | 464.08 |
| 33 | IndusInd Bank Apps | 1.05 | 203.58 | 0.00 | 0.00 | 0.00 | 0.00 | 0.00 | 0.00 | 1.05 | 203.58 |
| 34 | Union Bank Apps | 1.02 | 405.74 | 0.00 | 0.00 | 0.00 | 0.00 | 0.00 | 0.00 | 1.02 | 405.74 |
| 35 | SLICE | 0.95 | 32.65 | 0.00 | 0.00 | 0.00 | 0.00 | 0.00 | 0.00 | 0.95 | 32.65 |
| 36 | DBS Digibank Apps | 0.78 | 245.47 | 0.00 | 0.00 | 0.00 | 1.47 | 0.00 | 0.00 | 0.79 | 246.94 |
| 37 | GoKiwi | 0.77 | 104.27 | 0.00 | 0.00 | 0.00 | 0.00 | 0.00 | 0.00 | 0.77 | 104.27 |
| 38 | Karnataka Bank Apps | 0.72 | 144.87 | 0.00 | 0.00 | 0.00 | 0.01 | 0.00 | 0.00 | 0.72 | 144.89 |
| 39 | Navi | 0.69 | 43.86 | 0.00 | 0.00 | 0.00 | 0.00 | 0.00 | 0.00 | 0.69 | 43.86 |
| 40 | AU Small Finance Bank Apps | 0.68 | 252.89 | 0.00 | 0.00 | 0.00 | 0.00 | 0.00 | 0.00 | 0.68 | 252.89 |
| 41 | Central Bank of India Apps | 0.58 | 136.84 | 0.00 | 0.00 | 0.00 | 0.00 | 0.00 | 0.00 | 0.58 | 136.84 |
| 42 | Indian Bank Apps | 0.40 | 98.27 | 0.00 | 0.00 | 0.00 | 8.79 | 0.00 | 0.00 | 0.40 | 107.06 |
| 43 | Shriram One | 0.33 | 19.47 | 0.00 | 0.00 | 0.00 | 0.00 | 0.00 | 0.00 | 0.33 | 19.47 |
| 44 | Bajaj Pay Wallet | 0.32 | 72.38 | 0.00 | 0.00 | 0.00 | 0.00 | 0.00 | 0.00 | 0.32 | 72.38 |
| 45 | South Indian Bank Apps | 0.30 | 86.96 | 0.00 | 0.00 | 0.00 | 0.00 | 0.00 | 0.00 | 0.30 | 86.96 |
| 46 | Bank of India Apps | 0.29 | 103.82 | 0.00 | 0.00 | 0.00 | 0.00 | 0.00 | 0.00 | 0.29 | 103.82 |
| 47 | UCO Bank Apps | 0.29 | 94.81 | 0.00 | 0.00 | 0.00 | 0.00 | 0.00 | 0.00 | 0.29 | 94.81 |
| 48 | Mobikwik | 0.28 | 38.53 | 0.00 | 0.00 | 0.00 | 0.00 | 0.00 | 0.00 | 0.28 | 38.53 |
| 49 | Fino Payments bank Apps | 0.27 | 26.70 | 0.00 | 0.00 | 0.00 | 0.00 | 0.00 | 0.00 | 0.27 | 26.70 |
| 50 | INDIE - Indus Ind | 0.20 | 35.32 | 0.00 | 0.00 | 0.00 | 0.00 | 0.00 | 0.00 | 0.20 | 35.32 |
| 51 | HSBC Bank Apps | 0.20 | 123.63 | 0.00 | 0.08 | 0.00 | 0.00 | 0.00 | 0.00 | 0.20 | 123.70 |
| 52 | Tamilnad Mercantile Bank Apps | 0.11 | 31.47 | 0.00 | 0.00 | 0.00 | 0.00 | 0.00 | 0.00 | 0.11 | 31.47 |
| 53 | Indian Overseas Bank Apps | 0.11 | 27.85 | 0.00 | 0.00 | 0.00 | 0.00 | 0.00 | 0.00 | 0.11 | 27.85 |
| 54 | Ultracash | 0.08 | 5.06 | 0.00 | 0.00 | 0.00 | 0.00 | 0.00 | 0.00 | 0.08 | 5.06 |
| 55 | TataNeu | 0.08 | 10.49 | 0.00 | 0.00 | 0.00 | 0.00 | 0.00 | 0.00 | 0.08 | 10.49 |
| 56 | IDBI Bank Apps | 0.07 | 38.61 | 0.00 | 0.00 | 0.00 | 0.00 | 0.00 | 0.00 | 0.07 | 38.61 |
| 57 | City Union Bank Apps | 0.07 | 22.76 | 0.00 | 0.00 | 0.00 | 0.00 | 0.00 | 0.00 | 0.07 | 22.76 |
| 58 | DIGIKHATA | 0.07 | 25.80 | 0.00 | 0.00 | 0.00 | 0.00 | 0.00 | 0.00 | 0.07 | 25.80 |
| 59 | PAYTMWALLET | 0.07 | 4.53 | 0.00 | 0.00 | 0.00 | 0.00 | 0.00 | 0.00 | 0.07 | 4.53 |
| 60 | Citi Bank Apps | 0.07 | 70.44 | 0.00 | 0.00 | 0.00 | 0.00 | 0.00 | 0.00 | 0.07 | 70.44 |
| 61 | Fave | 0.06 | 4.28 | 0.00 | 0.00 | 0.00 | 0.00 | 0.00 | 0.00 | 0.06 | 4.28 |
| 62 | FIFEDERAL | 0.05 | 7.12 | 0.00 | 0.00 | 0.00 | 0.00 | 0.00 | 0.00 | 0.05 | 7.12 |
| 63 | Bank of Maharashtra Apps | 0.04 | 8.10 | 0.00 | 0.00 | 0.00 | 0.00 | 0.00 | 0.00 | 0.04 | 8.10 |
| 64 | MakeMyTrip | 0.04 | 22.20 | 0.00 | 0.00 | 0.00 | 0.00 | 0.00 | 0.00 | 0.04 | 22.20 |
| 65 | NSDL Payments Bank Apps | 0.04 | 6.36 | 0.00 | 0.00 | 0.00 | 0.00 | 0.00 | 0.00 | 0.04 | 6.36 |
| 66 | Karur Vysya Bank Apps | 0.04 | 13.69 | 0.00 | 0.00 | 0.00 | 0.00 | 0.00 | 0.00 | 0.04 | 13.69 |
| 67 | Equitas Small Finance Bank Apps | 0.03 | 21.86 | 0.00 | 0.00 | 0.00 | 0.00 | 0.00 | 0.00 | 0.03 | 21.86 |
| 68 | Allahabad Bank Apps | 0.03 | 7.01 | 0.00 | 0.00 | 0.00 | 0.00 | 0.00 | 0.00 | 0.03 | 7.01 |
| 69 | DHANI | 0.03 | 2.01 | 0.00 | 0.00 | 0.00 | 0.00 | 0.00 | 0.00 | 0.03 | 2.01 |
| 70 | CBDC Apps | 0.72 | 25.12 | 0.00 | 0.00 | 0.05 | 0.80 | 0.00 | 0.00 | 0.77 | 25.91 |
| 71 | Other | 0.12 | 38.33 | 0.00 | 0.00 | 0.00 | 0.00 | 0.00 | 0.00 | 0.12 | 38.33 |
Note:-
| UPI P2P and P2M Transactions | ||||||
|---|---|---|---|---|---|---|
| Month | Total | P2P | P2M | |||
| Volume (Mn) | Value (Cr) | Volume (Mn) | Value (Cr) | Volume (Mn) | Value (Cr) | |
| Dec'23 | 12,020.23 | 18,22,949.42 | 4,754.79 | 13,47,696.13 | 7,265.44 | 4,75,253.29 |
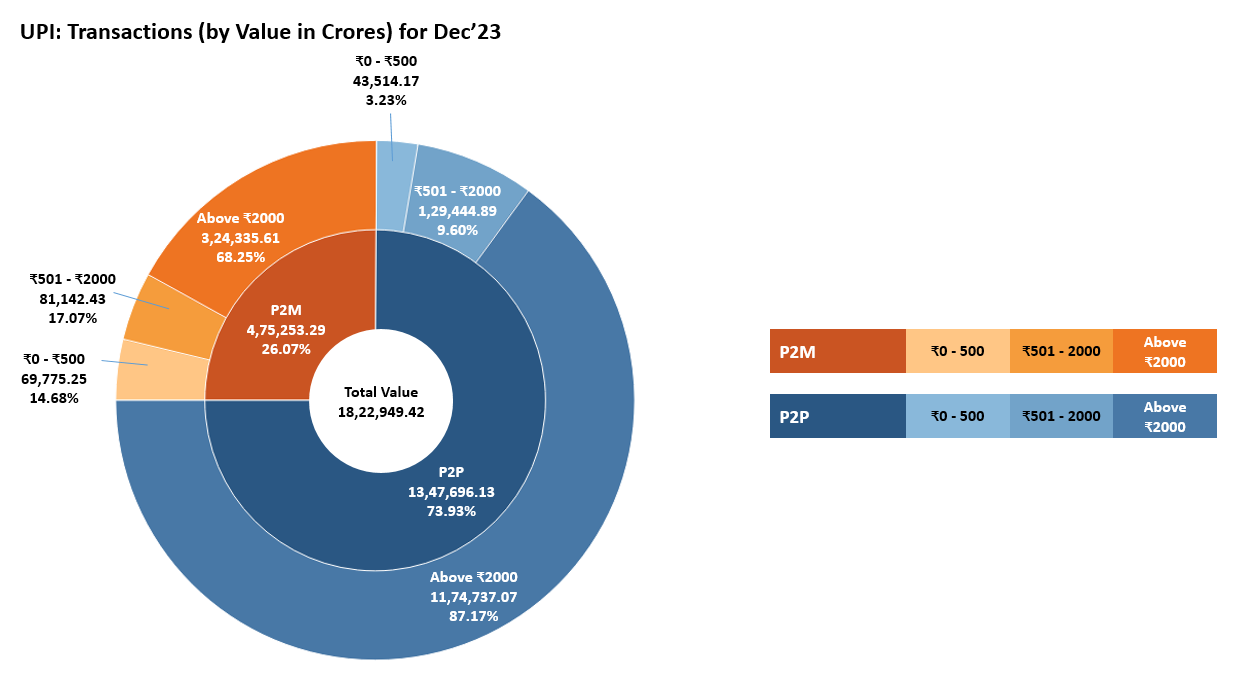
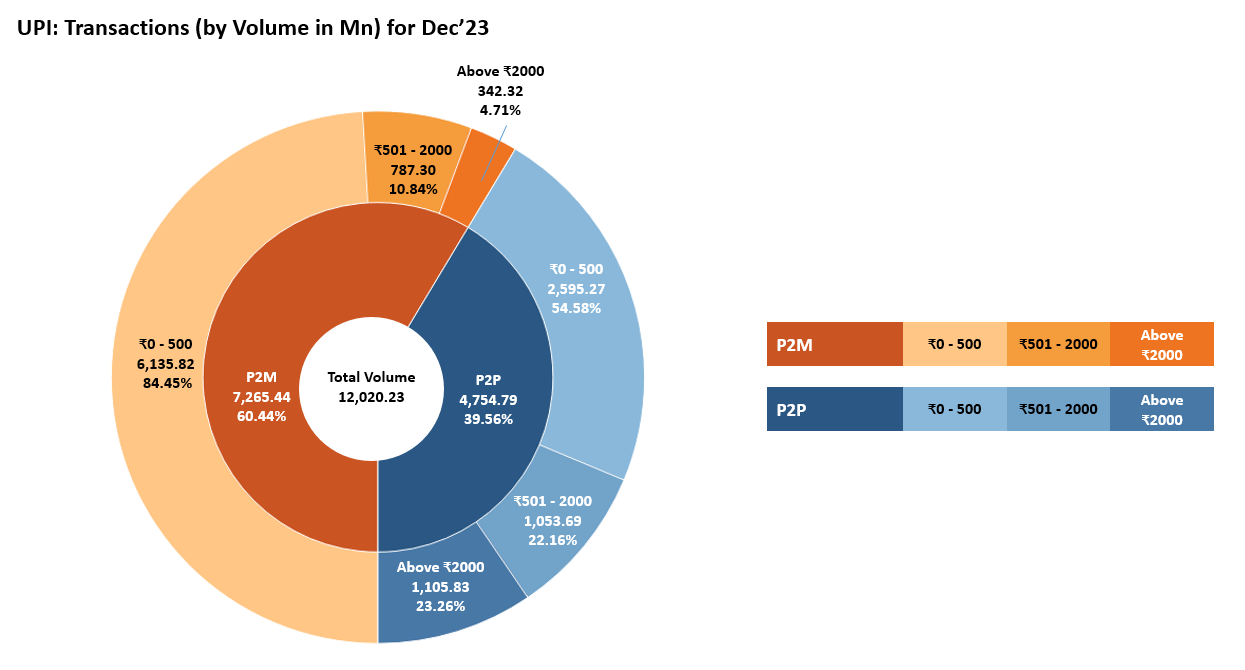
| UPI Payer PSP Performance (Dec'23) | |||||
|---|---|---|---|---|---|
| Sr. No. | Payer PSP | Total Volume (In Mn) | Approved % | BD % | TD % |
| 1 | YES BANK LTD | 3445.89 | 94.66% | 5.22% | 0.12% |
| 2 | AXIS BANK LTD. | 3095.94 | 94.93% | 4.95% | 0.12% |
| 3 | ICICI BANK | 2325.23 | 94.83% | 5.04% | 0.13% |
| 4 | PAYTM PAYMENTS BANK | 1542.33 | 93.87% | 6.00% | 0.13% |
| 5 | HDFC BANK LTD | 1124.24 | 95.79% | 4.12% | 0.09% |
| 6 | STATE BANK OF INDIA | 990.39 | 95.58% | 4.36% | 0.06% |
| 7 | TRI O TECH SOLUTIONS PRIVATE LIMITED | 34.24 | 100.00% | 0.00% | 0.00% |
| 8 | KOTAK MAHINDRA BANK | 26.48 | 100.00% | 0.00% | 0.00% |
| 9 | BHIM | 25.74 | 94.40% | 5.47% | 0.13% |
| 10 | AIRTEL PAYMENTS BANK | 13.24 | 92.57% | 7.35% | 0.09% |
| 11 | FEDERAL BANK | 6.07 | 98.09% | 1.86% | 0.04% |
| 12 | IDFC First Bank | 5.61 | 99.21% | 0.78% | 0.01% |
| 13 | INDIA POST PAYMENT BANK | 4.88 | 99.96% | 0.04% | 0.00% |
| 14 | RBL Bank | 4.52 | 95.38% | 4.50% | 0.12% |
| 15 | DEUTSCHE BANK CORP | 3.68 | 100.00% | 0.00% | 0.00% |
| UPI Payee PSP Performance (Dec'23) | |||||
|---|---|---|---|---|---|
| Sr. No. | Payee PSP | Total Volume (In Mn) | Approved % | BD % | TD % |
| 1 | YES BANK LTD | 4038.99 | 94.86% | 5.02% | 0.12% |
| 2 | PAYTM PAYMENTS BANK | 3120.84 | 95.72% | 4.17% | 0.11% |
| 3 | AXIS BANK LTD. | 1671.49 | 94.41% | 5.46% | 0.13% |
| 4 | ICICI BANK | 1444.29 | 93.91% | 5.97% | 0.12% |
| 5 | HDFC BANK LTD | 683.37 | 94.91% | 5.00% | 0.09% |
| 6 | STATE BANK OF INDIA | 628.41 | 94.75% | 5.16% | 0.09% |
| 7 | FEDERAL BANK | 222.45 | 96.80% | 3.09% | 0.11% |
| 8 | INDUSIND BANK | 75.01 | 94.03% | 5.83% | 0.14% |
| 9 | RBL Bank | 49.91 | 89.74% | 10.06% | 0.20% |
| 10 | COSMOS BANK | 35.39 | 87.08% | 12.69% | 0.22% |
| 11 | KOTAK MAHINDRA BANK | 26.91 | 95.30% | 4.60% | 0.10% |
| 12 | INDIAN BANK | 26.59 | 92.33% | 7.47% | 0.20% |
| 13 | CANARA BANK | 25.32 | 96.69% | 3.23% | 0.07% |
| 14 | IDFC First Bank | 23.60 | 92.35% | 7.51% | 0.13% |
| 15 | AIRTEL PAYMENTS BANK | 22.10 | 92.68% | 7.20% | 0.12% |
| UPI Merchant Category-wise Classification - December'23 (Arranged by Volume) | ||||
|---|---|---|---|---|
| Type | MCC | Description | Volume (in Mn) | Value (in Cr.) |
| High Transacting Categories | 5411 | Groceries and supermarkets | 1,424.63 | 37,752.00 |
| 5812 | Eating places and restaurants | 698.13 | 12,030.42 | |
| 5814 | Fast food restaurants | 653.35 | 8,127.68 | |
| 4814 | Telecommunication services, including local and long distance calls, credit card calls, calls through use of magnetic stripe reading telephones and faxes | 600.93 | 14,268.65 | |
| 5541 | Service stations (with or without ancillary services) | 344.29 | 22,251.43 | |
| 5311 | Department stores | 326.53 | 7,046.58 | |
| 5816 | Digital Goods: Games | 287.00 | 9,193.30 | |
| 5912 | Drug stores and pharmacies | 177.32 | 6,703.23 | |
| 5462 | Bakeries | 154.90 | 2,385.90 | |
| 4900 | Utilities electric, gas, water and sanitary | 96.24 | 10,077.12 | |
| Medium Transacting Categories | 6540 | Debit card to wallet credit (Wallet top up) | 90.97 | 5,931.84 |
| 5451 | Dairies | 86.85 | 1,972.87 | |
| 7299 | Miscellaneous personal services not elsewhere classified | 85.48 | 2,764.63 | |
| 5813 | Drinking places (alcoholic beverages) bars, taverns, night-clubs, cocktail lounges and discothques | 85.22 | 3,303.45 | |
| 7322 | Debt collection agencies | 71.57 | 59,869.88 | |
| 5137 | Mens, womens and childrens uniforms and commercial clothing | 58.10 | 5,963.70 | |
| 6012 | Financial institutions merchandise and services | 58.04 | 16,412.51 | |
| 5422 | Freezer and locker meat provisioners | 56.92 | 1,806.09 | |
| 5441 | Candy, nut and confectionery shops | 50.80 | 1,035.22 | |
| 5732 | Electronics shops | 49.16 | 5,559.82 | |
| All Other Categories | 5499 | Miscellaneous food shops convenience and speciality retail outlets | 46.87 | 1,926.47 |
| 7230 | Beauty and barber shops | 45.64 | 1,435.11 | |
| 9399 | Government services not elsewhere classified | 43.82 | 4,983.27 | |
| 6211 | Securities brokers and dealers | 42.68 | 38,997.04 | |
| 5921 | Package shops beer, wine and liquor | 41.24 | 1,772.32 | |
| 5399 | Miscellaneous general merchandise | 38.08 | 3,892.49 | |
| 7399 | Business services not elsewhere classified | 36.74 | 4,399.86 | |
| 5691 | Mens and womens clothing shops | 36.63 | 4,706.87 | |
| 5943 | Stationery, office and school supply shops | 34.07 | 960.13 | |
| Others | 1,443.24 | 1,77,723.40 | ||
| Total | 7,265.44 | 4,75,253.29 | ||
| State-wise UPI Product Statistics* (Dec'23) | |||||
|---|---|---|---|---|---|
| Sr. No. | State / Union Territory | Volume (in Mn ) | Volume Contribution (%) | Value (in Cr.) | Value Contribution (%) |
| 1 | MAHARASHTRA | 1,746.49 | 14.53% | 2,29,753.56 | 12.60% |
| 2 | KARNATAKA | 921.02 | 7.66% | 1,28,746.92 | 7.06% |
| 3 | UTTAR PRADESH | 774.15 | 6.44% | 1,15,581.23 | 6.34% |
| 4 | TELANGANA | 679.54 | 5.65% | 1,18,318.89 | 6.49% |
| 5 | TAMIL NADU | 511.92 | 4.26% | 83,498.19 | 4.58% |
| 6 | RAJASTHAN | 458.04 | 3.81% | 74,773.60 | 4.10% |
| 7 | ANDHRA PRADESH | 437.75 | 3.64% | 84,149.99 | 4.62% |
| 8 | MADHYA PRADESH | 384.08 | 3.20% | 53,739.43 | 2.95% |
| 9 | DELHI | 358.56 | 2.98% | 49,607.10 | 2.72% |
| 10 | GUJARAT | 341.58 | 2.84% | 57,762.41 | 3.17% |
| 11 | BIHAR | 332.74 | 2.77% | 55,538.69 | 3.05% |
| 12 | WEST BENGAL | 303.96 | 2.53% | 53,216.78 | 2.92% |
| 13 | HARYANA | 290.86 | 2.42% | 45,897.55 | 2.52% |
| 14 | KERALA | 273.68 | 2.28% | 39,059.74 | 2.14% |
| 15 | ODISHA | 239.01 | 1.99% | 34,650.83 | 1.90% |
| 16 | PUNJAB | 151.53 | 1.26% | 28,595.01 | 1.57% |
| 17 | JHARKHAND | 132.25 | 1.10% | 19,260.59 | 1.06% |
| 18 | ASSAM | 117.11 | 0.97% | 17,256.71 | 0.95% |
| 19 | CHHATTISGARH | 106.17 | 0.88% | 14,542.44 | 0.80% |
| 20 | UTTARAKHAND | 82.74 | 0.69% | 11,377.31 | 0.62% |
| 21 | HIMACHAL PRADESH | 42.16 | 0.35% | 5,760.84 | 0.32% |
| 22 | JAMMU AND KASHMIR | 39.71 | 0.33% | 6,135.21 | 0.34% |
| 23 | GOA | 27.96 | 0.23% | 4,110.01 | 0.23% |
| 24 | CHANDIGARH | 20.47 | 0.17% | 2,737.91 | 0.15% |
| 25 | PUDUCHERRY | 12.87 | 0.11% | 1,834.69 | 0.10% |
| 26 | ARUNACHAL PRADESH | 11.55 | 0.10% | 1,937.35 | 0.11% |
| 27 | TRIPURA | 8.26 | 0.07% | 1,381.10 | 0.08% |
| 28 | DADRA & NAGAR HAVELI & DAMAN & DIU | 8.22 | 0.07% | 907.49 | 0.05% |
| 29 | MEGHALAYA | 7.04 | 0.06% | 1,341.47 | 0.07% |
| 30 | MANIPUR | 5.71 | 0.05% | 1,630.29 | 0.09% |
| 31 | NAGALAND | 5.56 | 0.05% | 1,401.33 | 0.08% |
| 32 | MIZORAM | 5.49 | 0.05% | 1,217.18 | 0.07% |
| 33 | SIKKIM | 4.59 | 0.04% | 806.34 | 0.04% |
| 34 | ANDAMAN & NICOBAR | 2.64 | 0.02% | 491.18 | 0.03% |
| 35 | LADAKH | 1.74 | 0.01% | 368.70 | 0.02% |
| 36 | LAKSHADWEEP | 0.25 | 0.00% | 36.40 | 0.00% |
| 37 | UNCLASSIFIED# | 3,172.83 | 26.40% | 4,75,524.96 | 26.09% |
| UPI Remitter Banks - Top 50 Banks (Nov'23) | |||||||
|---|---|---|---|---|---|---|---|
| Sr. No. | UPI Remitter Banks (Sep-2023) | Total Volume (In Mn) | Approved % | BD % | TD% | Total Debit Reversal Count (In Mn) | Debit Reversal Success % |
| 1 | State Bank Of India | 2861.65 | 94.81% | 4.47% | 0.72% | 10.71 | 87% |
| 2 | HDFC BANK LTD | 974.06 | 96.39% | 3.57% | 0.04% | 2.66 | 98% |
| 3 | Bank of Baroda | 721.89 | 95.07% | 4.82% | 0.11% | 2.24 | 97% |
| 4 | Union Bank of India | 700.46 | 95.55% | 4.03% | 0.42% | 3.02 | 78% |
| 5 | Punjab National Bank | 564.71 | 95.09% | 4.47% | 0.44% | 1.76 | 98% |
| 6 | Kotak Mahindra Bank | 543.50 | 94.87% | 5.05% | 0.08% | 1.34 | 93% |
| 7 | Canara Bank | 527.96 | 94.11% | 5.22% | 0.66% | 2.23 | 76% |
| 8 | ICICI Bank | 526.20 | 96.32% | 3.44% | 0.23% | 1.45 | 91% |
| 9 | Axis Bank Ltd. | 512.13 | 96.38% | 3.57% | 0.05% | 1.25 | 93% |
| 10 | Paytm Payments Bank | 412.00 | 96.42% | 3.57% | 0.01% | 0.62 | 98% |
| 11 | Bank of India | 366.39 | 92.32% | 3.72% | 3.96% | 3.21 | 43% |
| 12 | Indian Bank | 317.62 | 95.18% | 4.64% | 0.18% | 0.92 | 90% |
| 13 | Airtel Payments Bank | 286.95 | 91.14% | 8.22% | 0.64% | 1.02 | 0% |
| 14 | India Post Payment Bank | 226.01 | 84.48% | 13.19% | 2.33% | 1.17 | 53% |
| 15 | Federal Bank | 172.99 | 95.22% | 4.21% | 0.58% | 0.52 | 83% |
| 16 | Central Bank Of India | 165.88 | 89.27% | 8.84% | 1.88% | 1.82 | 85% |
| 17 | Indian Overseas Bank | 151.39 | 94.62% | 4.41% | 0.98% | 0.61 | 94% |
| 18 | UCO Bank | 139.38 | 94.08% | 5.04% | 0.87% | 0.58 | 71% |
| 19 | IDBI Bank Limited | 132.00 | 93.91% | 3.83% | 2.26% | 1.25 | 83% |
| 20 | Bank of Maharashtra | 122.25 | 94.84% | 4.75% | 0.41% | 0.38 | 88% |
| 21 | INDUSIND BANK | 112.00 | 93.43% | 5.86% | 0.71% | 0.40 | 94% |
| 22 | Fino Payments Bank Limited FIP | 100.60 | 89.84% | 8.33% | 1.83% | 0.49 | 57% |
| 23 | Karnataka Bank | 89.24 | 94.13% | 5.33% | 0.55% | 0.22 | 88% |
| 24 | Yes Bank Ltd | 88.32 | 95.78% | 4.16% | 0.06% | 0.18 | 94% |
| 25 | IDFC FIRST Bank | 69.99 | 93.90% | 5.87% | 0.22% | 0.27 | 66% |
| 26 | Karur Vysya Bank | 55.13 | 93.81% | 5.54% | 0.65% | 0.17 | 89% |
| 27 | South Indian Bank | 45.79 | 95.52% | 4.11% | 0.37% | 0.09 | 93% |
| 28 | Bandhan Bank | 43.79 | 91.71% | 6.91% | 1.38% | 0.16 | 98% |
| 29 | Jammu and Kashmir Bank | 43.20 | 91.56% | 5.50% | 2.94% | 0.41 | 12% |
| 30 | Ujjivan Small Finance Bank | 33.77 | 93.71% | 5.43% | 0.86% | 0.14 | 60% |
| 31 | City Union Bank | 33.22 | 93.96% | 5.80% | 0.25% | 0.09 | 99% |
| 32 | AU small Finance Bank | 33.01 | 95.58% | 4.18% | 0.25% | 0.13 | 98% |
| 33 | Tamilnad Mercantile Bank | 29.10 | 94.60% | 5.11% | 0.29% | 0.08 | 79% |
| 34 | Punjab and Sind Bank | 28.90 | 93.62% | 5.83% | 0.55% | 0.18 | 67% |
| 35 | Tri O Tech Solutions Private Limited | 28.43 | 100.00% | 0.00% | 0.00% | NA | NA |
| 36 | Equitas Bank | 26.50 | 92.55% | 7.39% | 0.06% | 0.08 | 98% |
| 37 | Standard Chartered | 26.22 | 97.42% | 2.23% | 0.35% | 0.07 | 75% |
| 38 | Kerala Gramin Bank | 23.92 | 90.19% | 7.84% | 1.97% | 0.19 | 54% |
| 39 | DBS Bank India Limited | 23.67 | 95.97% | 3.98% | 0.04% | 0.06 | 83% |
| 40 | Andhra Pradesh Grameena Vikas Bank | 23.04 | 88.90% | 10.34% | 0.76% | 0.07 | 77% |
| 41 | Pragathi Krishna Gramin Bank | 21.81 | 92.21% | 6.66% | 1.13% | 0.12 | 66% |
| 42 | Saraswat Bank | 20.40 | 96.37% | 3.34% | 0.29% | 0.07 | 87% |
| 43 | Maharashtra Gramin Bank | 19.82 | 86.91% | 10.90% | 2.19% | 0.07 | 71% |
| 44 | Citibank | 18.89 | 95.62% | 3.26% | 1.12% | 0.07 | 97% |
| 45 | Baroda UP Gramin Bank | 18.78 | 69.42% | 9.05% | 21.53% | 1.21 | 13% |
| 46 | ESAF Small Finance Bank Ltd. | 18.18 | 94.76% | 4.90% | 0.34% | 0.05 | 97% |
| 47 | Rajasthan Marudhara Gramin Bank | 16.90 | 89.38% | 10.18% | 0.45% | 0.06 | 82% |
| 48 | RBL Bank | 14.75 | 84.95% | 7.10% | 7.95% | 0.23 | 44% |
| 49 | Fincare Small Finance Bank Ltd | 14.66 | 87.00% | 11.11% | 1.89% | 0.09 | 60% |
| 50 | Sarva Haryana Gramin Bank | 14.28 | 89.89% | 6.71% | 3.40% | 0.22 | 20% |
| UPI Beneficiary Banks - Top 50 Banks (Nov'23) | |||||||
|---|---|---|---|---|---|---|---|
| Sr.No. | UPI Beneficiary Banks (Sep-2023) | Total Volume (In Mn) | Approved % | BD% | TD% | Deemed Approved % | |
| 1 | Paytm Payments Bank | 2617.76 | 99.90% | 0.08% | 0.01% | 0.00% | |
| 2 | Yes Bank Ltd | 2146.74 | 99.96% | 0.03% | 0.01% | 0.00% | |
| 3 | State Bank Of India | 1163.73 | 99.15% | 0.27% | 0.58% | 0.06% | |
| 4 | Axis Bank Ltd. | 856.15 | 99.52% | 0.34% | 0.15% | 0.07% | |
| 5 | ICICI Bank | 651.71 | 99.28% | 0.60% | 0.12% | 0.01% | |
| 6 | HDFC BANK LTD | 508.67 | 99.29% | 0.65% | 0.06% | 0.04% | |
| 7 | Bank of Baroda | 317.76 | 99.43% | 0.48% | 0.09% | 0.10% | |
| 8 | Union Bank of India | 310.09 | 99.55% | 0.25% | 0.20% | 0.12% | |
| 9 | Federal Bank | 266.30 | 99.40% | 0.32% | 0.29% | 0.04% | |
| 10 | Punjab National Bank | 254.47 | 99.39% | 0.47% | 0.14% | 0.24% | |
| 11 | Canara Bank | 252.28 | 99.05% | 0.53% | 0.42% | 0.13% | |
| 12 | Kotak Mahindra Bank | 219.84 | 99.31% | 0.64% | 0.05% | 0.06% | |
| 13 | Bank of India | 173.07 | 96.65% | 0.31% | 3.04% | 0.43% | |
| 14 | Indian Bank | 167.39 | 99.49% | 0.44% | 0.07% | 0.04% | |
| 15 | Airtel Payments Bank | 160.79 | 99.07% | 0.51% | 0.43% | 0.15% | |
| 16 | INDUSIND BANK | 135.40 | 98.93% | 0.43% | 0.64% | 0.43% | |
| 17 | India Post Payment Bank | 100.15 | 98.67% | 0.42% | 0.90% | 0.14% | |
| 18 | Central Bank Of India | 82.64 | 98.41% | 0.57% | 1.02% | 0.45% | |
| 19 | Indian Overseas Bank | 70.94 | 99.24% | 0.35% | 0.40% | 0.32% | |
| 20 | UCO Bank | 67.33 | 98.39% | 0.79% | 0.82% | 0.08% | |
| 21 | IDBI Bank Limited | 58.83 | 98.43% | 0.48% | 1.09% | 0.47% | |
| 22 | Bank of Maharashtra | 48.50 | 98.98% | 0.61% | 0.41% | 0.10% | |
| 23 | Fino Payments Bank Limited FIP | 44.77 | 98.15% | 0.70% | 1.15% | 0.10% | |
| 24 | Karnataka Bank | 39.12 | 98.76% | 0.67% | 0.58% | 0.02% | |
| 25 | IDFC FIRST Bank | 48.61 | 98.45% | 1.39% | 0.16% | 0.15% | |
| 26 | Karur Vysya Bank | 30.60 | 98.98% | 0.59% | 0.43% | 0.09% | |
| 27 | South Indian Bank | 29.58 | 99.15% | 0.43% | 0.42% | 0.02% | |
| 28 | Bandhan Bank | 26.18 | 98.07% | 0.53% | 1.40% | 0.00% | |
| 29 | AU small Finance Bank | 22.96 | 97.60% | 2.24% | 0.16% | 0.11% | |
| 30 | Tamilnad Mercantile Bank | 18.71 | 99.50% | 0.31% | 0.19% | 0.03% | |
| 31 | City Union Bank | 17.92 | 98.36% | 1.45% | 0.19% | 0.06% | |
| 32 | RBL Bank | 44.40 | 95.83% | 0.55% | 3.62% | 0.31% | |
| 33 | Ujjivan Small Finance Bank | 17.99 | 99.31% | 0.19% | 0.50% | 0.25% | |
| 34 | Jammu and Kashmir Bank | 19.18 | 98.00% | 0.35% | 1.64% | 0.27% | |
| 35 | Equitas Bank | 12.50 | 97.55% | 2.37% | 0.08% | 0.00% | |
| 36 | Punjab and Sind Bank | 13.25 | 99.37% | 0.28% | 0.35% | 0.21% | |
| 37 | Kerala Gramin Bank | 13.43 | 98.41% | 0.22% | 1.38% | 0.59% | |
| 38 | Pragathi Krishna Gramin Bank | 11.60 | 99.00% | 0.49% | 0.51% | 0.33% | |
| 39 | CITIBank | 10.35 | 99.79% | 0.00% | 0.21% | 0.00% | |
| 40 | Andhra Pradesh Grameena Vikas Bank | 11.19 | 98.76% | 0.87% | 0.37% | 0.07% | |
| 41 | DBS Bank India Limited | 9.60 | 98.21% | 1.70% | 0.08% | 0.04% | |
| 42 | Maharashtra Gramin Bank | 9.60 | 98.29% | 0.26% | 1.45% | 0.14% | |
| 43 | Tri O Tech Solutions Private Limited | 13.88 | 94.64% | 5.32% | 0.04% | 0.01% | |
| 44 | Rajasthan Marudhara Gramin Bank | 8.76 | 99.17% | 0.61% | 0.22% | 0.06% | |
| 45 | Baroda UP Gramin Bank | 10.63 | 83.36% | 0.85% | 15.80% | 5.43% | |
| 46 | ESAF Small Finance Bank Ltd. | 9.33 | 99.66% | 0.17% | 0.18% | 0.05% | |
| 47 | Andhra Pragathi Grameena Bank | 7.17 | 97.88% | 0.74% | 1.38% | 0.04% | |
| 48 | Saraswat Bank | 7.23 | 99.35% | 0.37% | 0.28% | 0.11% | |
| 49 | Sarva Haryana Gramin Bank | 6.55 | 97.20% | 0.43% | 2.37% | 0.60% | |
| 50 | Baroda Rajasthan Kshetriya Gramin Bank | 5.20 | 94.07% | 1.31% | 4.62% | 1.32% | |
| UPI Apps (Nov'23) | |||||||||||
|---|---|---|---|---|---|---|---|---|---|---|---|
| Sr.No. | Application Name | Customer Initiated Transactions | B2C Transactions | B2B Transactions | On-us Transactions | Total | |||||
| Volume (Mn) | Value (Cr) | Volume (Mn) | Value (Cr) | Volume (Mn) | Value (Cr) | Volume (Mn) | Value (Cr) | Volume (Mn) | Value (Cr) | ||
| 1 | PhonePe | 5281.68 | 854,939.06 | 0.00 | 0.00 | 0.00 | 0.00 | - | - | 5281.68 | 854,939.06 |
| 2 | Google Pay | 4099.08 | 599,748.64 | 0.00 | 0.00 | 0.00 | 0.00 | - | - | 4099.08 | 599,748.64 |
| 3 | Paytm Payments Bank App | 1360.45 | 166,257.62 | 4.68 | 8.00 | 0.73 | 1314.75 | 113.61 | 23569.92 | 1479.47 | 191,150.29 |
| 4 | Cred | 93.31 | 34,541.32 | 0.00 | 0.00 | 0.00 | 0.00 | - | - | 93.31 | 34,541.32 |
| 5 | Axis Bank Apps | 11.52 | 2,305.08 | 54.43 | 1453.30 | 0.07 | 7.27 | - | - | 66.02 | 3,765.68 |
| 6 | Amazon Pay | 48.62 | 5,737.75 | 0.00 | 0.00 | 0.00 | 0.00 | - | - | 48.62 | 5,737.75 |
| 7 | ICICI Bank Apps | 27.41 | 11,134.92 | 4.79 | 456.40 | 8.55 | 12088.53 | - | - | 40.75 | 23,679.82 |
| 8 | Fampay | 28.43 | 336.92 | 0.00 | 0.00 | 0.00 | 0.00 | - | - | 28.43 | 336.92 |
| 9 | Yes Bank Apps | 25.77 | 11,004.32 | 0.00 | 0.00 | 0.28 | 66.93 | - | - | 26.06 | 11,071.25 |
| 10 | Kotak Mahindra Bank Apps | 23.88 | 4,341.61 | 0.00 | 0.00 | 0.00 | 0.00 | - | - | 23.88 | 4,341.61 |
| 11 | BHIM | 23.49 | 7,957.46 | 0.00 | 0.00 | 0.00 | 0.00 | - | - | 23.49 | 7,957.46 |
| 12 | 22.29 | 1,917.47 | 0.00 | 0.00 | 0.00 | 0.00 | - | - | 22.29 | 1,917.47 | |
| 13 | HDFC Bank Apps | 20.68 | 5,511.35 | 0.00 | 0.00 | 0.00 | 0.00 | - | - | 20.68 | 5,511.35 |
| 14 | Bajaj Finserv | 15.95 | 2,406.06 | 0.00 | 0.00 | 0.00 | 0.00 | - | - | 15.95 | 2,406.06 |
| 15 | Airtel Payments Bank Apps | 11.06 | 795.35 | 0.00 | 0.00 | 0.00 | 0.00 | 0.28 | 31.71 | 11.34 | 827.06 |
| 16 | Samsung Pay | 5.84 | 557.36 | 0.00 | 0.00 | 0.00 | 0.00 | - | - | 5.84 | 557.36 |
| 17 | Federal Bank Apps | 5.51 | 698.05 | 0.00 | 0.00 | 0.00 | 0.01 | - | - | 5.51 | 698.06 |
| 18 | State Bank of India Apps | 5.36 | 2,162.43 | 0.00 | 0.00 | 0.02 | 0.66 | - | - | 5.38 | 2,163.09 |
| 19 | India Post Payments Bank Apps | 5.27 | 532.66 | 0.00 | 0.00 | 0.00 | 0.00 | - | - | 5.27 | 532.66 |
| 20 | IDFC Bank Apps | 4.96 | 1,306.91 | 0.00 | 0.00 | 0.00 | 0.00 | - | - | 4.96 | 1,306.91 |
| 21 | Groww | 4.59 | 2,528.81 | 0.00 | 0.00 | 0.00 | 0.00 | - | - | 4.59 | 2,528.81 |
| 22 | Mobikwik | 4.52 | 1,467.04 | 0.00 | 0.00 | 0.00 | 0.00 | - | - | 4.52 | 1,467.04 |
| 23 | Standard Chartered Bank Apps | 3.82 | 262.18 | 0.00 | 0.00 | 0.57 | 244.75 | - | - | 4.39 | 506.93 |
| 24 | Jupiter | 4.29 | 577.81 | 0.00 | 0.00 | 0.00 | 0.00 | - | - | 4.29 | 577.81 |
| 25 | Deutsche Bank Apps | 3.26 | 268.83 | 0.00 | 0.00 | 0.00 | 0.02 | - | - | 3.26 | 268.85 |
| 26 | Canara Bank Apps | 2.29 | 667.04 | 0.00 | 0.00 | 0.00 | 0.00 | - | - | 2.29 | 667.04 |
| 27 | RBL Bank Apps | 1.85 | 621.67 | 0.00 | 0.00 | 0.37 | 18.30 | - | - | 2.23 | 639.97 |
| 28 | slice | 1.58 | 359.47 | 0.00 | 0.00 | 0.00 | 0.00 | - | - | 1.58 | 359.47 |
| 29 | Jio Payments Bank Apps | 1.26 | 117.05 | 0.00 | 0.00 | 0.00 | 0.00 | - | - | 1.26 | 117.05 |
| 30 | Omnicard | 1.09 | 37.85 | 0.00 | 0.00 | 0.00 | 0.00 | - | - | 1.09 | 37.85 |
| 31 | Punjab National Bank Apps | 1.04 | 214.29 | 0.00 | 0.00 | 0.00 | 0.00 | - | - | 1.04 | 214.29 |
| 32 | Union Bank Apps | 0.95 | 376.07 | 0.00 | 0.00 | 0.00 | 0.00 | - | - | 0.95 | 376.07 |
| 33 | Bank of Baroda Apps | 0.95 | 412.54 | 0.00 | 0.00 | 0.00 | 7.13 | - | - | 0.95 | 419.67 |
| 34 | IndusInd Bank Apps | 0.90 | 193.07 | 0.00 | 0.00 | 0.00 | 0.00 | - | - | 0.90 | 193.07 |
| 35 | GoKiwi | 0.76 | 93.99 | 0.00 | 0.00 | 0.00 | 0.00 | - | - | 0.76 | 93.99 |
| 36 | SLICE | 0.69 | 27.42 | 0.00 | 0.00 | 0.00 | 0.00 | - | - | 0.69 | 27.42 |
| 37 | Karnataka Bank Apps | 0.68 | 138.91 | 0.00 | 0.00 | 0.00 | 0.01 | - | - | 0.68 | 138.92 |
| 38 | AU Small Finance Bank Apps | 0.66 | 239.22 | 0.00 | 0.00 | 0.00 | 0.00 | - | - | 0.66 | 239.22 |
| 39 | Navi | 0.60 | 37.44 | 0.00 | 0.00 | 0.00 | 0.00 | - | - | 0.60 | 37.44 |
| 40 | DBS Digibank Apps | 0.52 | 196.26 | 0.00 | 0.00 | 0.00 | 0.61 | - | - | 0.52 | 196.87 |
| 41 | Central Bank of India Apps | 0.51 | 117.17 | 0.00 | 0.00 | 0.00 | 0.27 | - | - | 0.51 | 117.44 |
| 42 | Indian Bank Apps | 0.36 | 89.84 | 0.00 | 0.00 | 0.00 | 4.10 | - | - | 0.36 | 93.94 |
| 43 | Fino Payments bank Apps | 0.27 | 25.00 | 0.00 | 0.00 | 0.00 | 0.00 | - | - | 0.27 | 25.00 |
| 44 | UCO Bank Apps | 0.26 | 81.93 | 0.00 | 0.00 | 0.00 | 0.00 | - | - | 0.26 | 81.93 |
| 45 | Bajaj Pay Wallet | 0.26 | 62.02 | 0.00 | 0.00 | 0.00 | 0.00 | - | - | 0.26 | 62.02 |
| 46 | South Indian Bank Apps | 0.25 | 74.07 | 0.00 | 0.00 | 0.00 | 0.00 | - | - | 0.25 | 74.07 |
| 47 | Bank of India Apps | 0.24 | 88.76 | 0.00 | 0.00 | 0.00 | 0.00 | - | - | 0.24 | 88.76 |
| 48 | HSBC Bank Apps | 0.18 | 110.45 | 0.00 | 0.10 | 0.00 | 0.00 | - | - | 0.18 | 110.56 |
| 49 | INDIE - Indus Ind | 0.16 | 30.77 | 0.00 | 0.00 | 0.00 | 0.00 | - | - | 0.16 | 30.77 |
| 50 | Tamilnad Mercantile Bank Apps | 0.10 | 29.13 | 0.00 | 0.00 | 0.00 | 0.00 | - | - | 0.10 | 29.13 |
| 51 | Indian Overseas Bank Apps | 0.09 | 24.83 | 0.00 | 0.00 | 0.00 | 0.00 | - | - | 0.09 | 24.83 |
| 52 | Fave | 0.09 | 8.29 | 0.00 | 0.00 | 0.00 | 0.00 | - | - | 0.09 | 8.29 |
| 53 | Shriram One | 0.09 | 10.06 | 0.00 | 0.00 | 0.00 | 0.00 | - | - | 0.09 | 10.06 |
| 54 | Ultracash | 0.08 | 5.50 | 0.00 | 0.00 | 0.00 | 0.00 | - | - | 0.08 | 5.50 |
| 55 | TataNeu | 0.08 | 11.36 | 0.00 | 0.00 | 0.00 | 0.00 | - | - | 0.08 | 11.36 |
| 56 | City Union Bank Apps | 0.07 | 22.07 | 0.00 | 0.00 | 0.00 | 0.00 | - | - | 0.07 | 22.07 |
| 57 | IDBI Bank Apps | 0.07 | 35.22 | 0.00 | 0.00 | 0.00 | 0.00 | - | - | 0.07 | 35.22 |
| 58 | Citi Bank Apps | 0.07 | 60.24 | 0.00 | 0.00 | 0.00 | 0.00 | - | - | 0.07 | 60.24 |
| 59 | Mobikwik | 0.06 | 8.71 | 0.00 | 0.0 | 0.00 | 0.00 | - | - | 0.06 | 8.71 |
| 60 | DIGIKHATA | 0.05 | 20.12 | 0.00 | 0.00 | 0.00 | 0.00 | - | - | 0.05 | 20.12 |
| 61 | Bank of Maharashtra Apps | 0.04 | 8.79 | 0.00 | 0.00 | 0.00 | 0.00 | - | - | 0.04 | 8.79 |
| 62 | MakeMyTrip | 0.04 | 22.58 | 0.00 | 0.00 | 0.00 | 0.00 | - | - | 0.04 | 22.58 |
| 63 | Karur Vysya Bank Apps | 0.04 | 14.83 | 0.00 | 0.00 | 0.00 | 0.00 | - | - | 0.04 | 14.83 |
| 64 | Timepay | 0.04 | 1.20 | 0.00 | 0.00 | 0.00 | 0.00 | - | - | 0.04 | 1.20 |
| 65 | NSDL Payments Bank Apps | 0.03 | 5.89 | 0.00 | 0.00 | 0.00 | 0.00 | - | - | 0.03 | 5.89 |
| 66 | Equitas Small Finance Bank Apps | 0.03 | 19.96 | 0.00 | 0.00 | 0.00 | 0.00 | - | - | 0.03 | 19.96 |
| 67 | Punjab Sind Bank Apps | 0.03 | 14.19 | 0.00 | 0.00 | 0.00 | 0.00 | - | - | 0.03 | 14.19 |
| 68 | Allahabad Bank Apps | 0.03 | 6.93 | 0.00 | 0.00 | 0.00 | 0.00 | - | - | 0.03 | 6.93 |
| 69 | CBDC Apps | 0.20 | 8.49 | 0.00 | 0.00 | 0.01 | 0.46 | - | - | 0.22 | 8.95 |
| 70 | Others | 0.11 | 26.81 | 0.00 | 0.00 | 0.00 | 0.00 | - | - | 0.11 | 26.81 |
Note:-
| UPI P2P and P2M Transactions | ||||||
|---|---|---|---|---|---|---|
| Month | Total | P2P | P2M | |||
| Volume (Mn) | Value (Cr) | Volume (Mn) | Value (Cr) | Volume (Mn) | Value (Cr) | |
| Nov'23 | 11,235.29 | 17,39,740.61 | 4,649.47 | 12,92,866.82 | 6,585.81 | 4,46,873.79 |
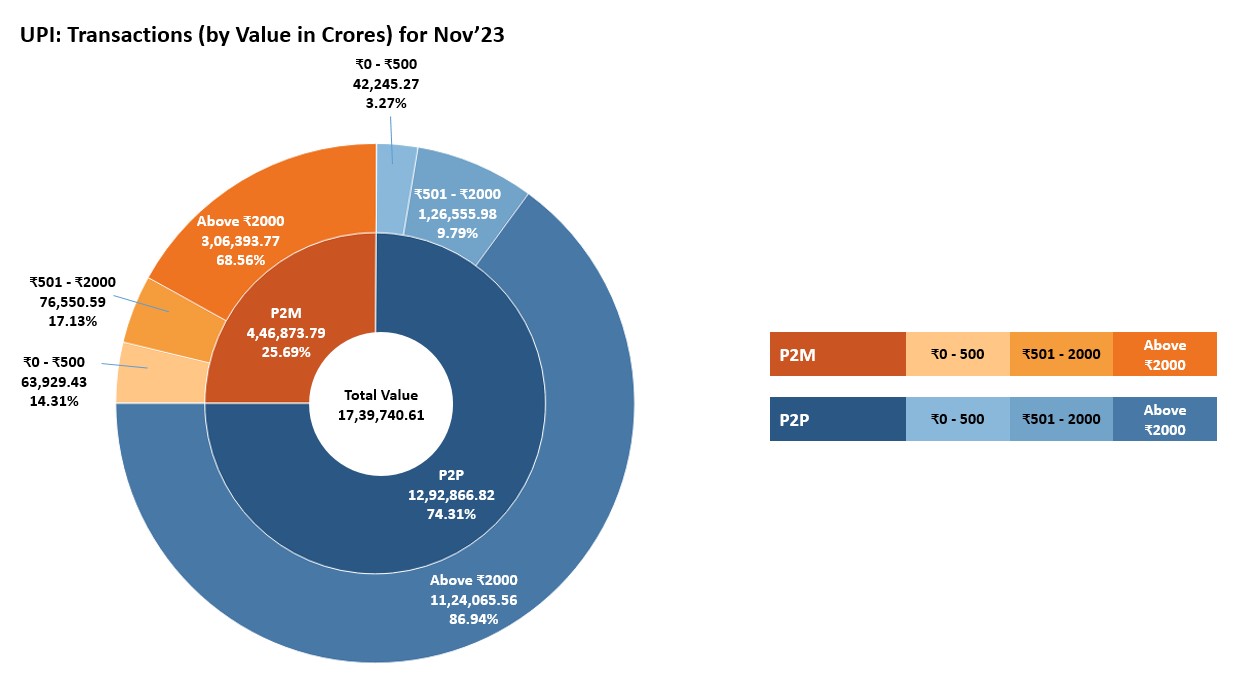
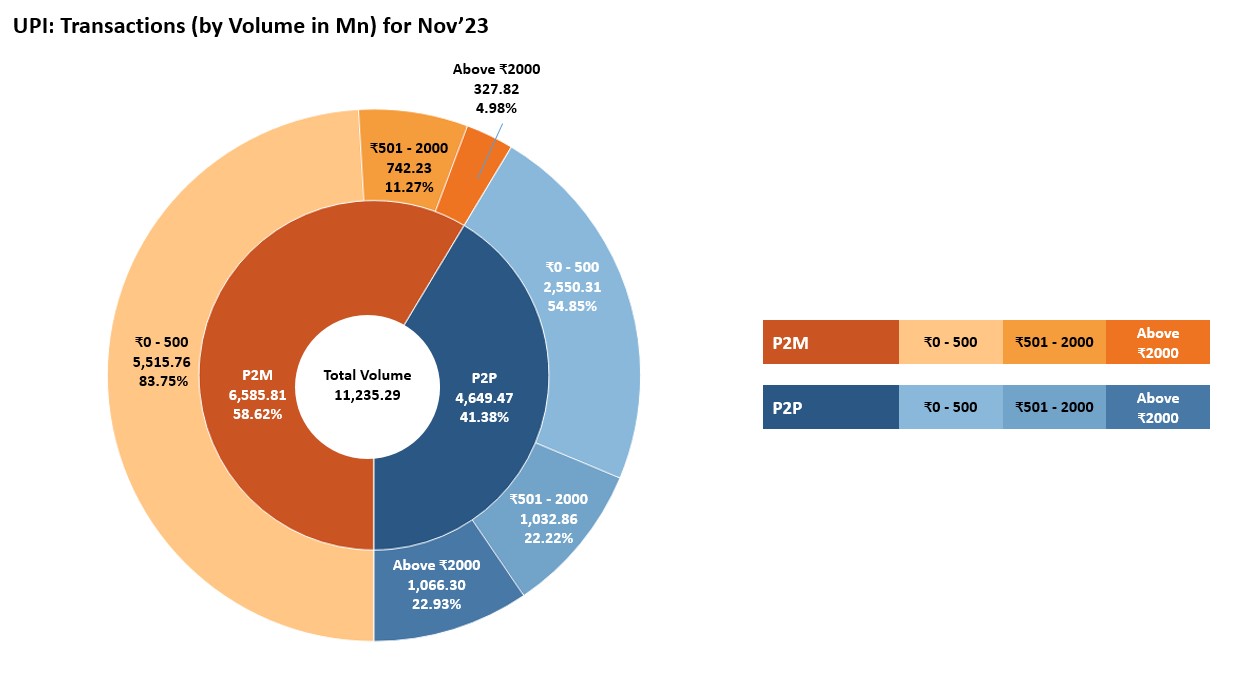
| UPI Payer PSP Performance (Nov'23) | |||||
|---|---|---|---|---|---|
| Sr. No. | Payer PSP | Total Volume (In Mn) | Approved % | BD % | TD % |
| 1 | YES BANK LTD | 3511.25 | 94.97% | 4.95% | 0.08% |
| 2 | AXIS BANK LTD. | 2610.39 | 95.16% | 4.75% | 0.09% |
| 3 | ICICI BANK | 2077.75 | 95.12% | 4.79% | 0.09% |
| 4 | PAYTM PAYMENTS BANK | 1451.32 | 94.11% | 5.80% | 0.09% |
| 5 | HDFC BANK LTD | 1044.71 | 96.04% | 3.89% | 0.07% |
| 6 | STATE BANK OF INDIA | 983.74 | 95.70% | 4.26% | 0.04% |
| 7 | TRI O TECH SOLUTIONS PRIVATE LIMITED | 28.43 | 100.00% | 0.00% | 0.00% |
| 8 | KOTAK MAHINDRA BANK | 23.97 | 100.00% | 0.00% | 0.00% |
| 9 | BHIM | 24.75 | 94.88% | 5.02% | 0.10% |
| 10 | AIRTEL PAYMENTS BANK | 11.95 | 92.59% | 7.35% | 0.06% |
| 11 | FEDERAL BANK | 5.61 | 98.19% | 1.79% | 0.02% |
| 12 | INDIA POST PAYMENT BANK | 5.27 | 99.98% | 0.02% | 0.00% |
| 13 | IDFC FIRST Bank | 5.21 | 98.99% | 1.00% | 0.01% |
| 14 | STANDARD CHARTERED | 4.39 | 100.00% | 0.00% | 0.00% |
| 15 | RBL Bank Ltd | 4.07 | 95.85% | 4.09% | 0.06% |
| UPI Payee PSP Performance (Nov'23) | |||||
|---|---|---|---|---|---|
| Sr. No. | Payee PSP | Total Volume (In Mn) | Approved % | BD % | TD % |
| 1 | Yes Bank Ltd | 3895.63 | 95.06% | 4.86% | 0.08% |
| 2 | PayTM Payments Bank Ltd | 2876.53 | 95.86% | 4.06% | 0.08% |
| 3 | Axis Bank Ltd | 1473.31 | 94.65% | 5.26% | 0.09% |
| 4 | ICICI Bank | 1367.32 | 94.30% | 5.62% | 0.09% |
| 5 | HDFC Bank Ltd | 628.18 | 95.16% | 4.77% | 0.07% |
| 6 | State Bank Of India | 580.84 | 95.02% | 4.91% | 0.07% |
| 7 | Federal Bank | 199.54 | 96.90% | 3.04% | 0.06% |
| 8 | INDIAN Bank | 76.60 | 93.91% | 5.98% | 0.11% |
| 9 | RBL Bank | 39.40 | 91.86% | 8.00% | 0.13% |
| 10 | Kotak Mahindra Bank | 28.13 | 95.06% | 4.83% | 0.11% |
| 11 | IDFC FIRST Bank | 26.61 | 92.29% | 7.54% | 0.17% |
| 12 | Cosmos Bank | 24.88 | 90.84% | 8.96% | 0.20% |
| 13 | Canara Bank | 22.04 | 96.69% | 3.25% | 0.06% |
| 14 | Indian Bank | 21.35 | 92.91% | 6.95% | 0.14% |
| 15 | Airtel Payments Bank | 20.10 | 91.92% | 7.96% | 0.12% |
| UPI Merchant Category-wise Classification - November'23 (Arranged by Volume) | ||||
|---|---|---|---|---|
| Type | MCC | Description | Volume (in Mn) | Value (in Cr.) |
| High Transacting Categories | 5411 | Groceries and supermarkets | 1,267.00 | 36,180.22 |
| 5812 | Eating places and restaurants | 647.84 | 11,832.39 | |
| 5814 | Fast food restaurants | 564.41 | 7,222.90 | |
| 4814 | Telecommunication services, including local and long distance calls, credit card calls, calls through use of magnetic stripe reading telephones and faxes | 549.29 | 12,456.25 | |
| 5311 | Department stores | 380.46 | 8,755.82 | |
| 5541 | Service stations (with or without ancillary services) | 326.19 | 20,710.18 | |
| 5816 | Digital Goods: Games | 289.47 | 8,486.20 | |
| 5912 | Drug stores and pharmacies | 166.91 | 6,397.46 | |
| 5462 | Bakeries | 139.54 | 2,199.23 | |
| 4900 | Utilities electric, gas, water and sanitary | 94.20 | 11,143.81 | |
| Medium Transacting Categories | 5813 | Drinking places (alcoholic beverages) bars, taverns, night-clubs, cocktail lounges and discothques | 92.10 | 3,443.69 |
| 7299 | Miscellaneous personal services not elsewhere classified | 82.85 | 3,026.75 | |
| 5451 | Dairies | 79.99 | 1,934.91 | |
| 7322 | Debt collection agencies | 69.22 | 58,929.16 | |
| 6540 | Debit card to wallet credit (Wallet top up) | 68.05 | 5,217.95 | |
| 6012 | Financial institutions merchandise and services | 64.87 | 14,744.90 | |
| 5137 | Mens, womens and childrens uniforms and commercial clothing | 63.26 | 7,348.08 | |
| 5441 | Candy, nut and confectionery shops | 48.36 | 1,129.79 | |
| 5732 | Electronics shops | 48.17 | 6,224.73 | |
| 5422 | Freezer and locker meat provisioners | 46.66 | 1,490.06 | |
| All Other Categories | 5993 | Cigar shops and stands | 43.35 | 351.69 |
| 7230 | Beauty and barber shops | 42.26 | 1,365.75 | |
| 5399 | Miscellaneous general merchandise | 38.07 | 4,199.51 | |
| 5691 | Mens and womens clothing shops | 35.47 | 4,914.66 | |
| 9399 | Government services not elsewhere classified | 34.79 | 4,016.81 | |
| 6211 | Securities brokers and dealers | 34.76 | 30,154.85 | |
| 5722 | Household appliance shops | 33.67 | 3,653.18 | |
| 5651 | Family clothing shops | 33.33 | 2,926.50 | |
| 5921 | Package shops beer, wine and liquor | 32.33 | 1,355.61 | |
| Others | 1,168.93 | 1,65,060.76 | ||
| Total | 6,585.81 | 4,46,873.80 | ||
| State-wise UPI Product Statistics* (Nov'23) | |||||
|---|---|---|---|---|---|
| Sr. No. | State / Union Territory | Volume (in Mn ) | Volume Contribution (%) | Value (in Cr.) | Value Contribution (%) |
| 1 | MAHARASHTRA | 2,083.44 | 18.54% | 2,89,387.43 | 16.63% |
| 2 | KARNATAKA | 935.02 | 8.32% | 1,32,126.57 | 7.59% |
| 3 | UTTAR PRADESH | 786.83 | 7.00% | 1,18,988.81 | 6.84% |
| 4 | TELANGANA | 764.77 | 6.81% | 1,31,905.47 | 7.58% |
| 5 | TAMIL NADU | 525.30 | 4.68% | 87,369.93 | 5.02% |
| 6 | MADHYA PRADESH | 510.51 | 4.54% | 72,171.99 | 4.15% |
| 7 | RAJASTHAN | 451.81 | 4.02% | 74,471.53 | 4.28% |
| 8 | DELHI | 431.73 | 3.84% | 61,568.09 | 3.54% |
| 9 | ANDHRA PRADESH | 376.19 | 3.35% | 74,054.42 | 4.26% |
| 10 | BIHAR | 375.47 | 3.34% | 60,451.55 | 3.47% |
| 11 | GUJARAT | 338.54 | 3.01% | 58,262.18 | 3.35% |
| 12 | WEST BENGAL | 312.97 | 2.79% | 53,753.80 | 3.09% |
| 13 | HARYANA | 279.29 | 2.49% | 45,139.63 | 2.59% |
| 14 | KERALA | 258.38 | 2.30% | 36,759.86 | 2.11% |
| 15 | ODISHA | 244.19 | 2.17% | 34,247.19 | 1.97% |
| 16 | PUNJAB | 154.30 | 1.37% | 28,826.50 | 1.66% |
| 17 | JHARKHAND | 122.61 | 1.09% | 17,742.21 | 1.02% |
| 18 | ASSAM | 120.23 | 1.07% | 17,829.16 | 1.02% |
| 19 | CHHATTISGARH | 93.91 | 0.84% | 13,195.54 | 0.76% |
| 20 | UTTARAKHAND | 90.04 | 0.80% | 12,869.19 | 0.74% |
| 21 | HIMACHAL PRADESH | 40.70 | 0.36% | 5,732.29 | 0.33% |
| 22 | JAMMU AND KASHMIR | 40.66 | 0.36% | 6,345.35 | 0.36% |
| 23 | GOA | 24.47 | 0.22% | 3,516.93 | 0.20% |
| 24 | CHANDIGARH | 22.35 | 0.20% | 3,189.81 | 0.18% |
| 25 | PUDUCHERRY | 11.83 | 0.11% | 1,749.00 | 0.10% |
| 26 | ARUNACHAL PRADESH | 10.24 | 0.09% | 1,663.05 | 0.10% |
| 27 | TRIPURA | 7.98 | 0.07% | 1,343.51 | 0.08% |
| 28 | DADRA & NAGAR HAVELI & DAMAN & DIU | 7.13 | 0.06% | 835.34 | 0.05% |
| 29 | MEGHALAYA | 6.55 | 0.06% | 1,169.90 | 0.07% |
| 30 | NAGALAND | 5.82 | 0.05% | 1,349.79 | 0.08% |
| 31 | MIZORAM | 5.40 | 0.05% | 1,170.88 | 0.07% |
| 32 | MANIPUR | 4.29 | 0.04% | 1,434.65 | 0.08% |
| 33 | SIKKIM | 3.84 | 0.03% | 662.18 | 0.04% |
| 34 | ANDAMAN & NICOBAR | 2.22 | 0.02% | 427.62 | 0.02% |
| 35 | LADAKH | 1.71 | 0.02% | 369.58 | 0.02% |
| 36 | LAKSHADWEEP | 0.20 | 0.00% | 32.30 | 0.00% |
| 37 | UNCLASSIFIED# | 1,784.35 | 15.88% | 2,87,627.38 | 16.53% |
| UPI Remitter Banks - Top 50 Banks (Oct'23) | |||||||
|---|---|---|---|---|---|---|---|
| Sr. No. | UPI Remitter Banks (Sep-2023) | Total Volume (In Mn) | Approved % | BD % | TD% | Total Debit Reversal Count (In Mn) | Debit Reversal Success % |
| 1 | State Bank Of India | 2930.95 | 92.62% | 4.45% | 2.93% | 29.12 | 89% |
| 2 | HDFC BANK LTD | 1005.24 | 96.26% | 3.55% | 0.20% | 3.23 | 96% |
| 3 | Bank of Baroda | 746.16 | 93.72% | 5.11% | 1.17% | 4.89 | 86% |
| 4 | Union Bank of India | 717.97 | 94.43% | 4.16% | 1.41% | 4.54 | 58% |
| 5 | Punjab National Bank | 576.75 | 94.44% | 4.82% | 0.74% | 2.63 | 95% |
| 6 | ICICI Bank | 542.07 | 95.69% | 3.65% | 0.66% | 2.06 | 85% |
| 7 | Axis Bank Ltd | 533.42 | 96.43% | 3.55% | 0.01% | 1.28 | 99% |
| 8 | Kotak Mahindra Bank | 553.74 | 94.24% | 4.94% | 0.81% | 2.15 | 73% |
| 9 | Canara Bank | 530.06 | 94.48% | 5.09% | 0.43% | 2.34 | 85% |
| 10 | Paytm Payments Bank | 441.45 | 96.35% | 3.65% | 0.00% | 0.69 | 99% |
| 11 | Bank of India | 373.98 | 95.79% | 3.91% | 0.29% | 1.45 | 80% |
| 12 | Indian Bank | 321.72 | 94.93% | 4.91% | 0.16% | 1.11 | 91% |
| 13 | Airtel Payments Bank | 285.50 | 91.12% | 8.63% | 0.25% | 0.97 | 0% |
| 14 | India Post Payment Bank | 218.45 | 86.20% | 12.46% | 1.34% | 0.81 | 81% |
| 15 | Federal Bank | 175.29 | 95.30% | 4.55% | 0.15% | 0.43 | 99% |
| 16 | Central Bank Of India | 172.01 | 88.14% | 9.57% | 2.29% | 2.23 | 83% |
| 17 | Indian Overseas Bank | 151.31 | 94.84% | 4.48% | 0.67% | 0.69 | 89% |
| 18 | UCO Bank | 143.86 | 94.08% | 5.17% | 0.75% | 0.92 | 54% |
| 19 | IDBI Bank Limited | 136.12 | 94.64% | 3.77% | 1.59% | 0.94 | 87% |
| 20 | Bank of Maharashtra | 126.73 | 94.62% | 4.90% | 0.48% | 0.42 | 86% |
| 21 | INDUSIND BANK | 116.32 | 92.20% | 5.73% | 2.06% | 0.47 | 85% |
| 22 | Fino Payments Bank Limited FIP | 105.67 | 85.45% | 11.77% | 2.78% | 0.41 | 80% |
| 23 | Yes Bank Ltd | 94.16 | 95.49% | 4.39% | 0.12% | 0.20 | 89% |
| 24 | Karnataka Bank | 90.33 | 93.61% | 5.57% | 0.82% | 0.27 | 79% |
| 25 | Karur Vysya Bank | 56.39 | 93.67% | 5.71% | 0.62% | 0.26 | 93% |
| 26 | Bandhan Bank | 39.99 | 89.22% | 9.71% | 1.07% | 0.54 | 36% |
| 27 | South Indian Bank | 45.73 | 96.08% | 3.84% | 0.08% | 0.11 | 80% |
| 28 | IDFC FIRST Bank | 71.76 | 94.27% | 5.54% | 0.19% | 0.29 | 68% |
| 29 | Jammu and Kashmir Bank | 41.53 | 91.11% | 6.00% | 2.89% | 0.30 | 5% |
| 30 | City Union Bank | 33.89 | 93.79% | 5.98% | 0.22% | 0.10 | 99% |
| 31 | Ujjivan Small Finance Bank | 34.85 | 92.15% | 5.57% | 2.28% | 0.18 | 64% |
| 32 | AU small Finance Bank | 33.85 | 95.45% | 4.24% | 0.31% | 0.16 | 98% |
| 33 | Tamilnad Mercantile Bank | 29.57 | 93.69% | 5.18% | 1.12% | 0.12 | 62% |
| 34 | Equitas Small Finance Bank | 27.66 | 92.15% | 7.82% | 0.03% | 0.09 | 98% |
| 35 | Standard Chartered | 30.00 | 97.09% | 2.50% | 0.41% | 0.07 | 79% |
| 36 | Punjab and Sind Bank | 27.65 | 91.68% | 6.34% | 1.99% | 0.34 | 37% |
| 37 | DBS Bank India Limited | 24.94 | 95.54% | 3.91% | 0.55% | 0.06 | 84% |
| 38 | Andhra Pradesh Grameena Vikas Bank | 23.22 | 88.00% | 11.27% | 0.74% | 0.09 | 76% |
| 39 | Pragathi Krishna Gramin Bank | 21.54 | 91.33% | 6.68% | 1.99% | 0.17 | 59% |
| 40 | Citibank | 19.79 | 95.28% | 3.00% | 1.72% | 0.06 | 96% |
| 41 | Maharashtra Gramin Bank | 20.84 | 86.25% | 11.68% | 2.07% | 0.09 | 64% |
| 42 | Kerala Gramin Bank | 22.94 | 89.93% | 7.97% | 2.10% | 0.18 | 57% |
| 43 | Saraswat Bank | 20.94 | 96.38% | 3.40% | 0.22% | 0.06 | 92% |
| 44 | Tri O Tech Solutions Private Limited | 27.54 | 100.00% | 0.00% | 0.00% | 0.00 | NA |
| 45 | Rajasthan Marudhara Gramin Bank | 17.72 | 87.47% | 11.85% | 0.68% | 0.07 | 82% |
| 46 | ESAF Small Finance Bank Ltd. | 18.06 | 94.04% | 5.47% | 0.49% | 0.05 | 98% |
| 47 | Baroda UP Gramin Bank | 17.16 | 80.46% | 10.92% | 8.62% | 0.47 | 22% |
| 48 | Sarva Haryana Gramin Bank | 14.65 | 90.62% | 6.76% | 2.62% | 0.16 | 35% |
| 49 | RBL Bank | 14.89 | 87.52% | 7.32% | 5.15% | 0.16 | 61% |
| 50 | Andhra Pragathi Grameena Bank | 12.89 | 86.03% | 12.97% | 1.00% | 0.05 | 77% |
| UPI Beneficiary Banks - Top 50 Banks (Oct'23) | |||||||
|---|---|---|---|---|---|---|---|
| Sr.No. | UPI Beneficiary Banks (Sep-2023) | Total Volume (In Mn) | Approved % | BD% | TD% | Deemed Approved % | |
| 1 | Paytm Payments Bank | 2709.07 | 99.87% | 0.11% | 0.02% | 0.00% | |
| 2 | Yes Bank Ltd | 2224.58 | 99.94% | 0.02% | 0.03% | 0.00% | |
| 3 | State Bank Of India | 1183.73 | 97.26% | 0.28% | 2.46% | 0.41% | |
| 4 | Axis Bank Ltd. | 798.18 | 99.73% | 0.22% | 0.05% | 0.03% | |
| 5 | ICICI Bank | 651.16 | 99.28% | 0.49% | 0.23% | 0.08% | |
| 6 | HDFC BANK LTD | 535.56 | 99.39% | 0.50% | 0.11% | 0.06% | |
| 7 | Bank of Baroda | 326.93 | 98.09% | 0.84% | 1.07% | 0.16% | |
| 8 | Union Bank of India | 314.34 | 98.97% | 0.24% | 0.80% | 0.22% | |
| 9 | Federal Bank | 271.01 | 99.65% | 0.30% | 0.04% | 0.00% | |
| 10 | Punjab National Bank | 256.32 | 99.04% | 0.45% | 0.52% | 0.22% | |
| 11 | Canara Bank | 252.42 | 99.24% | 0.51% | 0.25% | 0.15% | |
| 12 | Kotak Mahindra Bank | 237.72 | 98.74% | 0.64% | 0.62% | 0.17% | |
| 13 | Bank of India | 175.96 | 99.44% | 0.29% | 0.27% | 0.13% | |
| 14 | Indian Bank | 169.62 | 99.44% | 0.46% | 0.10% | 0.03% | |
| 15 | Airtel Payments Bank | 158.70 | 99.23% | 0.59% | 0.18% | 0.10% | |
| 16 | INDUSIND BANK | 129.76 | 98.36% | 0.37% | 1.28% | 0.30% | |
| 17 | India Post Payment Bank | 96.97 | 98.51% | 0.39% | 1.10% | 0.04% | |
| 18 | Central Bank Of India | 84.25 | 97.64% | 0.64% | 1.72% | 0.53% | |
| 19 | Indian Overseas Bank | 72.39 | 99.28% | 0.40% | 0.32% | 0.30% | |
| 20 | UCO Bank | 67.14 | 98.84% | 0.80% | 0.36% | 0.17% | |
| 21 | IDBI Bank Limited | 60.68 | 98.77% | 0.46% | 0.77% | 0.29% | |
| 22 | Bank of Maharashtra | 49.66 | 98.99% | 0.57% | 0.45% | 0.10% | |
| 23 | Fino Payments Bank Limited FIP | 50.88 | 97.26% | 0.69% | 2.05% | 0.06% | |
| 24 | Karnataka Bank | 39.45 | 98.47% | 0.71% | 0.82% | 0.05% | |
| 25 | IDFC FIRST Bank | 52.06 | 98.85% | 1.07% | 0.08% | 0.00% | |
| 26 | Karur Vysya Bank | 31.11 | 99.07% | 0.61% | 0.32% | 0.08% | |
| 27 | South Indian Bank | 29.03 | 99.60% | 0.33% | 0.07% | 0.02% | |
| 28 | Bandhan Bank | 25.96 | 85.26% | 0.40% | 14.34% | 0.17% | |
| 29 | AU small Finance Bank | 22.86 | 97.95% | 1.90% | 0.15% | 0.14% | |
| 30 | Tamilnad Mercantile Bank | 18.78 | 98.79% | 0.34% | 0.87% | 0.13% | |
| 31 | City Union Bank | 18.00 | 98.69% | 1.13% | 0.19% | 0.05% | |
| 32 | RBL Bank | 39.79 | 96.25% | 1.44% | 2.31% | 0.27% | |
| 33 | Ujjivan Small Finance Bank | 18.20 | 98.24% | 0.24% | 1.51% | 0.45% | |
| 34 | Jammu and Kashmir Bank | 18.65 | 98.03% | 0.33% | 1.63% | 0.17% | |
| 35 | Equitas Small Finance Bank | 13.31 | 97.38% | 2.52% | 0.10% | 0.01% | |
| 36 | Punjab and Sind Bank | 13.64 | 91.02% | 0.21% | 8.77% | 0.58% | |
| 37 | Kerala Gramin Bank | 12.93 | 98.25% | 0.24% | 1.51% | 0.55% | |
| 38 | Pragathi Krishna Gramin Bank | 11.58 | 98.38% | 0.41% | 1.22% | 0.49% | |
| 39 | CITIBANK | 9.77 | 99.87% | 0.00% | 0.13% | 0.14% | |
| 40 | Andhra Pradesh Grameena Vikas Bank | 11.32 | 98.92% | 0.73% | 0.35% | 0.07% | |
| 41 | DBS Bank India Limited | 10.00 | 97.67% | 1.69% | 0.64% | 0.04% | |
| 42 | Maharashtra Gramin Bank | 10.08 | 96.48% | 0.47% | 3.04% | 0.24% | |
| 43 | Tri O Tech Solutions Private Limited | 13.24 | 94.13% | 5.79% | 0.08% | 0.03% | |
| 44 | Rajasthan Marudhara Gramin Bank | 8.94 | 99.06% | 0.50% | 0.43% | 0.08% | |
| 45 | Baroda UP Gramin Bank | 9.59 | 92.97% | 0.80% | 6.24% | 2.18% | |
| 46 | ESAF Small Finance Bank Ltd. | 9.26 | 99.67% | 0.14% | 0.19% | 0.23% | |
| 47 | Andhra Pragathi Grameena Bank | 7.09 | 97.79% | 0.56% | 1.65% | 0.03% | |
| 48 | Saraswat Bank | 7.50 | 99.47% | 0.34% | 0.18% | 0.10% | |
| 49 | Sarva Haryana Gramin Bank | 6.75 | 97.60% | 0.41% | 1.99% | 0.51% | |
| 50 | Baroda Rajasthan Kshetriya Gramin Bank | 5.26 | 97.70% | 1.07% | 1.24% | 0.26% | |
| UPI Apps (Oct'23) | |||||||||||
|---|---|---|---|---|---|---|---|---|---|---|---|
| Sr.No. | Application Name | Customer Initiated Transactions | B2C Transactions | B2B Transactions | On-us Transactions | Total | |||||
| Volume (Mn) | Value (Cr) | Volume (Mn) | Value (Cr) | Volume (Mn) | Value (Cr) | Volume (Mn) | Value (Cr) | Volume (Mn) | Value (Cr) | ||
| 1 | Airtel Payments Bank Apps | 11.32 | 778.26 | 0.00 | 0.00 | 0.00 | 0.00 | 0.31 | 32.39 | 11.62 | 810.65 |
| 2 | Allahabad Bank Apps | 0.03 | 7.30 | 0.00 | 0.00 | 0.00 | 0.00 | - | - | 0.03 | 7.30 |
| 3 | Amazon Pay | 54.39 | 6,297.17 | 0.00 | 0.00 | 0.00 | 0.00 | - | - | 54.39 | 6,297.17 |
| 4 | AU Small Finance Bank Apps | 0.71 | 235.99 | 0.00 | 0.00 | 0.00 | 0.00 | - | - | 0.71 | 235.99 |
| 5 | Axis Bank Apps | 12.10 | 2,202.41 | 62.24 | 2,721.47 | 0.08 | 7.63 | - | - | 74.42 | 4,931.50 |
| 6 | Bajaj Finserv | 14.19 | 2,373.17 | 0.00 | 0.00 | 0.00 | 0.00 | - | - | 14.19 | 2,373.17 |
| 7 | Bajaj Finserv PPI | 0.23 | 48.79 | 0.00 | 0.00 | 0.00 | 0.00 | - | - | 0.23 | 48.79 |
| 8 | Bank of Baroda Apps | 0.93 | 393.21 | 0.00 | 0.00 | 0.00 | 4.28 | - | - | 0.93 | 397.49 |
| 9 | Bank of India Apps | 0.27 | 93.46 | 0.00 | 0.00 | 0.00 | 0.00 | - | - | 0.27 | 93.46 |
| 10 | Bank of Maharashtra Apps | 0.06 | 10.85 | 0.00 | 0.00 | 0.00 | 0.00 | - | - | 0.06 | 10.85 |
| 11 | BHIM | 25.74 | 8,174.71 | 0.00 | 0.00 | 0.00 | 0.00 | - | - | 25.74 | 8,174.71 |
| 12 | Canara Bank Apps | 2.21 | 665.24 | 0.00 | 0.00 | 0.01 | 0.19 | - | - | 2.22 | 665.43 |
| 13 | Central Bank of India Apps | 0.52 | 114.69 | 0.00 | 0.00 | 0.00 | 0.24 | - | - | 0.52 | 114.94 |
| 14 | Citi Bank Apps | 0.08 | 66.07 | 0.00 | 0.00 | 0.00 | 0.00 | - | - | 0.08 | 66.07 |
| 15 | City Union Bank Apps | 0.07 | 21.55 | 0.00 | 0.00 | 0.00 | 0.00 | - | - | 0.07 | 21.55 |
| 16 | Cred | 94.52 | 34,691.49 | 0.00 | 0.00 | 0.00 | 0.00 | - | - | 94.52 | 34,691.49 |
| 17 | DBS Digibank Apps | 0.50 | 197.14 | 0.00 | 0.00 | 0.00 | 0.56 | - | - | 0.51 | 197.70 |
| 18 | Deutsche Bank Apps | 2.37 | 350.45 | 0.00 | 0.00 | 0.00 | 0.02 | - | - | 2.37 | 350.47 |
| 19 | Dhani PPI | 0.02 | 1.49 | 0.00 | 0.00 | 0.00 | 0.00 | - | - | 0.02 | 1.49 |
| 20 | Digikhata PPI | 0.04 | 15.33 | 0.00 | 0.00 | 0.00 | 0.00 | - | - | 0.04 | 15.33 |
| 21 | Equitas Small Finance Bank Apps | 0.03 | 21.65 | 0.00 | 0.00 | 0.00 | 0.00 | - | - | 0.03 | 21.65 |
| 22 | Fampay PPI | 27.54 | 314.13 | 0.00 | 0.00 | 0.00 | 0.00 | - | - | 27.54 | 314.13 |
| 23 | Fave | 0.11 | 10.38 | 0.00 | 0.00 | 0.00 | 0.00 | - | - | 0.11 | 10.38 |
| 24 | Federal Bank Apps | 5.89 | 720.68 | 0.00 | 0.00 | 0.00 | 0.00 | - | - | 5.89 | 720.68 |
| 25 | Fino Payments bank Apps | 0.27 | 20.01 | 0.00 | 0.00 | 0.00 | 0.00 | - | - | 0.27 | 20.01 |
| 26 | GoKiwi | 0.76 | 79.21 | 0.00 | 0.00 | 0.00 | 0.00 | - | - | 0.76 | 79.21 |
| 27 | Google Pay | 4,139.92 | 589,299.18 | 0.00 | 0.00 | 0.00 | 0.00 | - | - | 4,139.92 | 589,299.18 |
| 28 | Groww | 5.89 | 3,354.83 | 0.00 | 0.00 | 0.00 | 0.00 | - | - | 5.89 | 3,354.83 |
| 29 | HDFC Bank Apps | 21.35 | 5,453.76 | 0.00 | 0.00 | 0.00 | 0.00 | - | - | 21.35 | 5,453.76 |
| 30 | HSBC Bank Apps | 0.18 | 105.98 | 0.00 | 0.08 | 0.00 | 0.00 | - | - | 0.18 | 106.07 |
| 31 | ICICI Bank Apps | 27.54 | 11,273.30 | 4.82 | 437.19 | 6.52 | 9,607.29 | - | - | 38.88 | 21,317.78 |
| 32 | IDBI Bank Apps | 0.07 | 36.89 | 0.00 | 0.00 | 0.00 | 0.00 | - | - | 0.07 | 36.89 |
| 33 | IDFC Bank Apps | 5.26 | 1,312.45 | 0.00 | 0.00 | 0.00 | 0.01 | - | - | 5.26 | 1,312.46 |
| 34 | India Post Payments Bank Apps | 5.54 | 464.95 | 0.00 | 0.00 | 0.00 | 0.00 | - | - | 5.54 | 464.95 |
| 35 | Indian Bank Apps | 0.36 | 90.37 | 0.00 | 0.00 | 0.00 | 20.56 | - | - | 0.36 | 110.93 |
| 36 | Indian Overseas Bank Apps | 0.09 | 23.85 | 0.00 | 0.00 | 0.00 | 0.00 | - | - | 0.09 | 23.85 |
| 37 | IndusInd Bank Apps | 1.07 | 217.98 | 0.00 | 0.00 | 0.00 | 0.00 | - | - | 1.07 | 217.98 |
| 38 | Jammu and Kashmir Bank Apps | 0.01 | 3.39 | 0.00 | 0.00 | 0.00 | 0.00 | - | - | 0.01 | 3.39 |
| 39 | Jio Payments Bank Apps | 1.35 | 112.84 | 0.00 | 0.00 | 0.00 | 0.00 | - | - | 1.35 | 112.84 |
| 40 | Jupiter | 4.45 | 571.06 | 0.00 | 0.00 | 0.00 | 0.00 | - | - | 4.45 | 571.06 |
| 41 | Karnataka Bank Apps | 0.69 | 138.58 | 0.00 | 0.00 | 0.00 | 0.00 | - | - | 0.69 | 138.58 |
| 42 | Karur Vysya Bank Apps | 0.04 | 16.95 | 0.00 | 0.00 | 0.00 | 0.00 | - | - | 0.04 | 16.95 |
| 43 | Kotak Mahindra Bank Apps | 23.83 | 4,205.76 | 0.00 | 0.00 | 0.00 | 0.00 | - | - | 23.83 | 4,205.77 |
| 44 | MakeMyTrip | 0.04 | 21.47 | 0.00 | 0.00 | 0.00 | 0.00 | - | - | 0.04 | 21.47 |
| 45 | Mobikwik | 4.43 | 1,378.88 | 0.00 | 0.00 | 0.00 | 0.00 | - | - | 4.43 | 1,378.88 |
| 46 | Mobikwik PPI | 0.02 | 2.15 | 0.00 | 0.00 | 0.00 | 0.00 | - | - | 0.02 | 2.15 |
| 47 | Navi | 0.53 | 33.92 | 0.00 | 0.00 | 0.00 | 0.00 | - | - | 0.53 | 33.92 |
| 48 | NSDL Payments Bank Apps | 0.04 | 5.79 | 0.00 | 0.00 | 0.00 | 0.00 | - | - | 0.04 | 5.79 |
| 49 | Omnicard PPI | 1.20 | 45.90 | 0.00 | 0.00 | 0.00 | 0.00 | - | - | 1.20 | 45.90 |
| 50 | Paytm Payments Bank App | 1,417.81 | 167,819.30 | 3.36 | 6.88 | 0.74 | 1,244.89 | 122.51 | 23,903.73 | 1,544.41 | 192,974.80 |
| 51 | PhonePe | 5,337.96 | 838,371.70 | 0.00 | 0.00 | 0.00 | 0.00 | - | - | 5,337.96 | 838,371.70 |
| 52 | Punjab National Bank Apps | 0.99 | 211.45 | 0.00 | 0.00 | 0.00 | 0.00 | - | - | 0.99 | 211.45 |
| 53 | Punjab Sind Bank Apps | 0.03 | 12.94 | 0.00 | 0.00 | 0.00 | 0.00 | - | - | 0.03 | 12.94 |
| 54 | RBL Bank Apps | 1.87 | 642.63 | 0.00 | 0.02 | 0.27 | 16.09 | - | - | 2.14 | 658.74 |
| 55 | Samsung Pay | 6.17 | 562.28 | 0.00 | 0.00 | 0.00 | 0.00 | - | - | 6.17 | 562.28 |
| 56 | Shriram One | 0.15 | 9.43 | 0.00 | 0.00 | 0.00 | 0.00 | - | - | 0.15 | 9.43 |
| 57 | slice | 1.33 | 340.40 | 0.00 | 0.00 | 0.00 | 0.00 | - | - | 1.33 | 340.40 |
| 58 | slice PPI | 0.33 | 18.41 | 0.00 | 0.00 | 0.00 | 0.00 | - | - | 0.33 | 18.41 |
| 59 | South Indian Bank Apps | 0.22 | 69.36 | 0.00 | 0.00 | 0.00 | 0.00 | - | - | 0.22 | 69.36 |
| 60 | Standard Chartered Bank Apps | 4.41 | 240.59 | 0.00 | 0.00 | 2.61 | 1,462.00 | - | - | 7.02 | 1,702.59 |
| 61 | State Bank of India Apps | 5.51 | 2,185.45 | 0.00 | 0.00 | 0.02 | 0.60 | - | - | 5.53 | 2,186.05 |
| 62 | Tamilnad Mercantile Bank Apps | 0.10 | 29.14 | 0.00 | 0.00 | 0.00 | 0.00 | - | - | 0.10 | 29.14 |
| 63 | TataNeu | 0.09 | 14.51 | 0.00 | 0.00 | 0.00 | 0.00 | - | - | 0.09 | 14.51 |
| 64 | UCO Bank Apps | 0.28 | 85.33 | 0.00 | 0.00 | 0.00 | 0.00 | - | - | 0.28 | 85.33 |
| 65 | Ultracash | 0.09 | 5.60 | 0.00 | 0.00 | 0.00 | 0.00 | - | - | 0.09 | 5.60 |
| 66 | Union Bank Apps | 0.89 | 360.41 | 0.00 | 0.00 | 0.00 | 0.00 | - | - | 0.89 | 360.42 |
| 67 | Utkarsh Small Finance Bank Apps | 0.02 | 7.44 | 0.00 | 0.00 | 0.00 | 0.00 | - | - | 0.02 | 7.44 |
| 68 | 22.72 | 1,903.10 | 0.00 | 0.00 | 0.00 | 0.00 | - | - | 22.72 | 1,903.10 | |
| 69 | Yes Bank Apps | 27.97 | 11,183.85 | 0.00 | 0.00 | 0.30 | 75.25 | - | - | 28.27 | 11,259.10 |
| 70 | Others | 0.06 | 14.29 | 0.00 | 0.00 | 0.00 | 0.00 | 0.00 | 0.00 | 0.06 | 14.29 |
Note:-
| UPI P2P and P2M Transactions | ||||||
|---|---|---|---|---|---|---|
| Month | Total | P2P | P2M | |||
| Volume (Mn) | Value (Cr) | Volume (Mn) | Value (Cr) | Volume (Mn) | Value (Cr) | |
| Oct'23 | 11,408.79 | 17,15,768.34 | 4,689.42 | 12,73,587.62 | 6,719.37 | 4,42,180.74 |


| UPI Payer PSP Performance (Oct'23) | |||||
|---|---|---|---|---|---|
| Sr. No. | Payer PSP | Total Volume (In Mn) | Approved % | BD % | TD % |
| 1 | Yes Bank Ltd | 3691.75 | 98.95% | 1.04% | 0.00% |
| 2 | Axis Bank Ltd | 2269.64 | 98.96% | 1.03% | 0.00% |
| 3 | ICICI Bank | 2151.88 | 99.02% | 0.98% | 0.00% |
| 4 | Paytm Payments Bank | 1439.34 | 98.79% | 1.21% | 0.00% |
| 5 | HDFC Bank Ltd | 1029.19 | 99.05% | 0.95% | 0.00% |
| 6 | State Bank Of India | 815.90 | 98.45% | 1.55% | 0.00% |
| 7 | Fampay (PPI) | 27.98 | 98.46% | 1.54% | 0.00% |
| 8 | BHIM | 27.00 | 95.32% | 4.67% | 0.01% |
| 9 | Kotak Mahindra Bank | 24.19 | 98.52% | 1.47% | 0.00% |
| 10 | Airtel Payments Bank | 11.53 | 98.13% | 1.81% | 0.05% |
| 11 | Standard Chartered | 7.03 | 99.87% | 0.13% | 0.00% |
| 12 | Federal Bank | 6.00 | 98.13% | 1.87% | 0.00% |
| 13 | India Post Payment Bank | 5.62 | 98.67% | 1.31% | 0.02% |
| 14 | IDFC FIRST Bank | 5.55 | 98.14% | 1.86% | 0.01% |
| 15 | RBL Bank | 3.70 | 98.53% | 1.46% | 0.01% |
| UPI Payee PSP Performance (Oct'23) | |||||
|---|---|---|---|---|---|
| Sr. No. | Payee PSP | Total Volume (In Mn) | Approved % | BD % | TD % |
| 1 | Yes Bank Ltd | 3874.42 | 99.74% | 0.25% | 0.01% |
| 2 | Paytm Payments Bank | 2868.53 | 99.60% | 0.39% | 0.01% |
| 3 | ICICI Bank | 1324.05 | 99.36% | 0.61% | 0.04% |
| 4 | Axis Bank Ltd | 1274.76 | 99.56% | 0.40% | 0.04% |
| 5 | HDFC Bank Ltd | 644.52 | 99.37% | 0.62% | 0.01% |
| 6 | State Bank Of India | 498.49 | 99.21% | 0.69% | 0.10% |
| 7 | Federal Bank | 208.16 | 95.46% | 4.54% | 0.00% |
| 8 | IndusInd Bank | 69.70 | 98.31% | 0.88% | 0.81% |
| 9 | Kotak Mahindra Bank | 40.33 | 99.36% | 0.51% | 0.13% |
| 10 | IDFC FIRST Bank | 26.91 | 99.26% | 0.46% | 0.28% |
| 11 | RBL Bank | 22.18 | 96.42% | 2.94% | 0.64% |
| 12 | Indian Bank | 21.13 | 99.45% | 0.51% | 0.04% |
| 13 | Canara Bank | 19.83 | 96.88% | 3.07% | 0.05% |
| 14 | Airtel Payments Bank | 19.09 | 99.49% | 0.13% | 0.38% |
| 15 | Cosmos Bank | 16.44 | 98.00% | 1.73% | 0.27% |
| UPI Merchant Category-wise Classification - October'23 (Arranged by Volume) | ||||
|---|---|---|---|---|
| Type | MCC | Description | Volume (in Mn) | Value (in Cr.) |
| High Transacting Categories | 5411 | Groceries and supermarkets | 1,288.51 | 34,201.73 |
| 5812 | Eating places and restaurants | 818.40 | 12,897.01 | |
| 4814 | Telecommunication services, including local and long distance calls, credit card calls, calls through use of magnetic stripe reading telephones and faxes | 536.62 | 12,031.65 | |
| 5814 | Fast food restaurants | 444.47 | 5,570.60 | |
| 5311 | Department stores | 437.65 | 9,363.45 | |
| 5541 | Service stations (with or without ancillary services) | 327.17 | 20,242.04 | |
| 5816 | Digital Goods: Games | 283.45 | 8,451.03 | |
| 5912 | Drug stores and pharmacies | 178.38 | 6,618.67 | |
| 5462 | Bakeries | 144.49 | 2,069.01 | |
| 4900 | Utilities electric, gas, water and sanitary | 95.76 | 11,949.30 | |
| Medium Transacting Categories | 5813 | Drinking places (alcoholic beverages) bars, taverns, night-clubs, cocktail lounges and discothques | 92.27 | 3,392.74 |
| 5451 | Dairies | 91.81 | 1,897.50 | |
| 7299 | Miscellaneous personal services not elsewhere classified | 85.89 | 2,901.13 | |
| 7322 | Debt collection agencies | 70.01 | 58,951.17 | |
| 6012 | Financial institutions merchandise and services | 66.30 | 14,937.85 | |
| 6540 | Debit card to wallet credit (Wallet top up) | 60.72 | 5,054.93 | |
| 5137 | Mens, womens and childrens uniforms and commercial clothing | 53.03 | 5,634.86 | |
| 5441 | Candy, nut and confectionery shops | 50.11 | 916.94 | |
| 5732 | Electronics shops | 46.97 | 5,647.12 | |
| 5422 | Freezer and locker meat provisioners | 46.69 | 1,533.05 | |
| All Other Categories | 5993 | Cigar shops and stands | 45.25 | 351.31 |
| 7230 | Beauty and barber shops | 42.08 | 1,291.90 | |
| 5399 | Miscellaneous general merchandise | 40.15 | 4,203.38 | |
| 5722 | Household appliance shops | 40.15 | 4,208.25 | |
| 6211 | Securities brokers and dealers | 37.10 | 35,766.63 | |
| 5262 | Online Marketplaces | 36.80 | 4,096.47 | |
| 9399 | Government services not elsewhere classified | 33.78 | 3,990.93 | |
| 4121 | Taxi-cabs and limousines | 33.54 | 752.67 | |
| 4214 | Motor freight carriers and trucking local and long distance, moving and storage companies and local delivery | 33.42 | 3,055.49 | |
| Others | 1,158.41 | 1,60,201.91 | ||
| Total | 6,719.37 | 4,42,180.74 | ||
| State-wise UPI Product Statistics* (Oct'23) | |||||
|---|---|---|---|---|---|
| Sr. No. | State / Union Territory | Volume (in Mn ) | Volume Contribution (%) | Value (in Cr.) | Value Contribution (%) |
| 1 | MAHARASHTRA | 2,225.55 | 19.51% | 2,97,168.32 | 17.32% |
| 2 | KARNATAKA | 957.72 | 8.39% | 1,33,243.89 | 7.77% |
| 3 | TELANGANA | 778.04 | 6.82% | 1,32,269.35 | 7.71% |
| 4 | UTTAR PRADESH | 752.99 | 6.60% | 1,07,856.43 | 6.29% |
| 5 | MADHYA PRADESH | 588.01 | 5.15% | 81,040.70 | 4.72% |
| 6 | TAMIL NADU | 538.52 | 4.72% | 87,385.36 | 5.09% |
| 7 | RAJASTHAN | 461.98 | 4.05% | 72,771.58 | 4.24% |
| 8 | DELHI | 449.90 | 3.94% | 60,577.68 | 3.53% |
| 9 | GUJARAT | 364.34 | 3.19% | 57,809.55 | 3.37% |
| 10 | ANDHRA PRADESH | 361.83 | 3.17% | 71,941.95 | 4.19% |
| 11 | BIHAR | 343.88 | 3.01% | 54,202.12 | 3.16% |
| 12 | WEST BENGAL | 321.25 | 2.82% | 54,677.68 | 3.19% |
| 13 | HARYANA | 293.23 | 2.57% | 44,962.40 | 2.62% |
| 14 | KERALA | 254.32 | 2.23% | 36,657.16 | 2.14% |
| 15 | ODISHA | 243.43 | 2.13% | 34,574.49 | 2.02% |
| 16 | PUNJAB | 159.72 | 1.40% | 27,543.17 | 1.61% |
| 17 | ASSAM | 120.12 | 1.05% | 17,712.04 | 1.03% |
| 18 | JHARKHAND | 118.93 | 1.04% | 16,946.85 | 0.99% |
| 19 | CHHATTISGARH | 101.78 | 0.89% | 13,782.56 | 0.80% |
| 20 | UTTARAKHAND | 96.06 | 0.84% | 13,132.59 | 0.77% |
| 21 | HIMACHAL PRADESH | 41.56 | 0.36% | 5,717.15 | 0.33% |
| 22 | JAMMU AND KASHMIR | 39.88 | 0.35% | 6,198.21 | 0.36% |
| 23 | GOA | 24.06 | 0.21% | 3,467.39 | 0.20% |
| 24 | CHANDIGARH | 23.01 | 0.20% | 3,120.47 | 0.18% |
| 25 | PUDUCHERRY | 12.31 | 0.11% | 1,767.06 | 0.10% |
| 26 | ARUNACHAL PRADESH | 9.81 | 0.09% | 1,604.37 | 0.09% |
| 27 | TRIPURA | 8.47 | 0.07% | 1,429.11 | 0.08% |
| 28 | DADRA & NAGAR HAVELI & DAMAN & DIU | 7.10 | 0.06% | 787.39 | 0.05% |
| 29 | NAGALAND | 6.03 | 0.05% | 1,350.30 | 0.08% |
| 30 | MEGHALAYA | 5.93 | 0.05% | 1,063.95 | 0.06% |
| 31 | MIZORAM | 4.87 | 0.04% | 1,067.95 | 0.06% |
| 32 | MANIPUR | 4.09 | 0.04% | 1,333.58 | 0.08% |
| 33 | SIKKIM | 3.85 | 0.03% | 697.17 | 0.04% |
| 34 | ANDAMAN & NICOBAR | 2.11 | 0.02% | 396.87 | 0.02% |
| 35 | LADAKH | 2.02 | 0.02% | 468.85 | 0.03% |
| 36 | LAKSHADWEEP | 0.17 | 0.00% | 30.13 | 0.00% |
| 37 | UNCLASSIFIED# | 1,681.93 | 14.74% | 2,69,012.53 | 15.68% |
| UPI Remitter Banks - Top 50 Banks (Sep'23) | |||||||
|---|---|---|---|---|---|---|---|
| Sr. No. | UPI Remitter Banks (Sep-2023) | Total Volume (In Mn) | Approved % | BD % | TD% | Total Debit Reversal Count (In Mn) | Debit Reversal Success % |
| 1 | State Bank of India | 2730.35 | 95.55% | 4.19% | 0.26% | 9.45 | 96% |
| 2 | HDFC BANK LTD | 912.87 | 95.78% | 3.66% | 0.56% | 3.55 | 81% |
| 3 | Bank of Baroda | 681.10 | 94.47% | 5.18% | 0.35% | 2.13 | 92% |
| 4 | Union Bank of India | 657.95 | 94.38% | 4.46% | 1.16% | 3.26 | 59% |
| 5 | Punjab National Bank | 526.67 | 95.01% | 4.75% | 0.24% | 1.83 | 95% |
| 6 | Kotak Mahindra Bank | 501.84 | 94.49% | 5.18% | 0.33% | 1.17 | 91% |
| 7 | ICICI Bank | 484.28 | 96.33% | 3.27% | 0.40% | 1.43 | 80% |
| 8 | Canara Bank | 486.91 | 94.38% | 5.24% | 0.38% | 1.74 | 81% |
| 9 | Axis Bank Ltd. | 486.35 | 96.27% | 3.58% | 0.15% | 1.10 | 90% |
| 10 | Paytm Payments Bank | 426.45 | 96.30% | 3.67% | 0.03% | 0.57 | 94% |
| 11 | Bank of India | 340.89 | 95.80% | 3.95% | 0.25% | 1.06 | 81% |
| 12 | Indian Bank | 294.13 | 91.03% | 4.47% | 4.50% | 3.30 | 65% |
| 13 | Airtel Payments Bank | 258.59 | 91.11% | 8.69% | 0.20% | 0.80 | 0% |
| 14 | India Post Payment Bank | 203.54 | 82.83% | 14.35% | 2.82% | 0.92 | 72% |
| 15 | Federal Bank | 162.00 | 95.55% | 4.41% | 0.04% | 0.34 | 97% |
| 16 | Central Bank of India | 159.29 | 88.16% | 8.99% | 2.85% | 2.10 | 68% |
| 17 | Indian Overseas Bank | 138.04 | 93.73% | 4.48% | 1.79% | 0.69 | 81% |
| 18 | UCO Bank | 135.33 | 90.15% | 5.19% | 4.65% | 2.02 | 46% |
| 19 | IDBI Bank Limited | 123.74 | 95.55% | 3.73% | 0.71% | 0.60 | 87% |
| 20 | Bank of Maharashtra | 114.21 | 93.20% | 4.99% | 1.81% | 0.60 | 59% |
| 21 | INDUSIND BANK | 103.02 | 92.10% | 6.11% | 1.79% | 0.53 | 64% |
| 22 | Fino Payments Bank Limited FIP | 96.47 | 84.96% | 13.10% | 1.94% | 0.39 | 68% |
| 23 | Yes Bank Ltd | 86.02 | 95.48% | 4.30% | 0.22% | 0.16 | 91% |
| 24 | Karnataka Bank | 83.65 | 93.99% | 5.47% | 0.54% | 0.17 | 91% |
| 25 | IDFC FIRST Bank | 63.89 | 94.98% | 4.84% | 0.18% | 0.21 | 72% |
| 26 | Karur Vysya Bank | 52.38 | 93.73% | 5.94% | 0.33% | 0.17 | 94% |
| 27 | Bandhan Bank | 43.57 | 94.86% | 4.72% | 0.42% | 0.21 | 70% |
| 28 | South Indian Bank | 43.14 | 95.22% | 4.17% | 0.62% | 0.17 | 84% |
| 29 | Jammu and Kashmir Bank | 37.82 | 91.00% | 5.72% | 3.28% | 0.42 | 2% |
| 30 | City Union Bank | 31.47 | 93.35% | 6.24% | 0.41% | 0.10 | 92% |
| 31 | Ujjivan Small Finance Bank | 31.20 | 93.70% | 5.70% | 0.60% | 0.10 | 77% |
| 32 | AU small Finance Bank | 30.84 | 95.20% | 4.54% | 0.25% | 0.11 | 91% |
| 33 | Tamilnad Mercantile Bank | 27.64 | 93.01% | 5.04% | 1.95% | 0.12 | 51% |
| 34 | Punjab and Sind Bank | 27.65 | 91.97% | 7.62% | 0.41% | 0.13 | 89% |
| 35 | Equitas Bank | 25.82 | 91.63% | 8.28% | 0.09% | 0.07 | 98% |
| 36 | Standard Chartered | 23.69 | 95.03% | 2.64% | 2.33% | 0.15 | 59% |
| 37 | DBS Bank India Limited | 23.25 | 95.86% | 4.02% | 0.12% | 0.05 | 81% |
| 38 | Tri O Tech Solutions Private Limited | 22.88 | 100.00% | 0.00% | 0.00% | 0.00 | NA |
| 39 | Andhra Pradesh Grameena Vikas Bank | 21.39 | 86.26% | 11.63% | 2.11% | 0.13 | 42% |
| 40 | Kerala Gramin Bank | 20.53 | 90.84% | 8.06% | 1.10% | 0.10 | 61% |
| 41 | Pragathi Krishna Gramin Bank | 19.97 | 90.54% | 7.96% | 1.50% | 0.15 | 39% |
| 42 | Maharashtra Gramin Bank | 19.60 | 83.93% | 12.09% | 3.98% | 0.08 | 54% |
| 43 | Citibank | 18.87 | 96.48% | 3.09% | 0.43% | 0.06 | 97% |
| 44 | Saraswat Bank | 18.79 | 96.71% | 3.06% | 0.23% | 0.05 | 90% |
| 45 | Rajasthan Marudhara Gramin Bank | 16.66 | 86.17% | 11.82% | 2.01% | 0.08 | 56% |
| 46 | ESAF Small Finance Bank Ltd. | 16.56 | 93.67% | 5.28% | 1.05% | 0.06 | 68% |
| 47 | Baroda UP Gramin Bank | 16.05 | 75.61% | 11.53% | 12.86% | 0.53 | 22% |
| 48 | Fincare Small Finance Bank Ltd | 13.91 | 85.87% | 11.79% | 2.34% | 0.11 | 51% |
| 49 | RBL Bank | 13.31 | 88.49% | 6.83% | 4.68% | 0.17 | 50% |
| 50 | Sarva Haryana Gramin Bank | 13.27 | 92.84% | 6.80% | 0.36% | 0.04 | 95% |
| UPI Beneficiary Banks - Top 50 Banks (Sep'23) | |||||||
|---|---|---|---|---|---|---|---|
| Sr.No. | UPI Beneficiary Banks (Sep-2023) | Total Volume (In Mn) | Approved % | BD% | TD% | Deemed Approved % | |
| 1 | Paytm Payments Bank | 2482.89 | 99.87% | 0.12% | 0.01% | 0.01% | |
| 2 | Yes Bank Ltd | 2018.40 | 99.98% | 0.02% | 0.00% | 0.00% | |
| 3 | State Bank Of India | 1118.01 | 99.62% | 0.18% | 0.20% | 0.04% | |
| 4 | Axis Bank Ltd. | 731.82 | 99.35% | 0.35% | 0.30% | 0.12% | |
| 5 | ICICI Bank | 625.87 | 99.49% | 0.40% | 0.11% | 0.03% | |
| 6 | HDFC BANK LTD | 508.57 | 99.04% | 0.56% | 0.40% | 0.15% | |
| 7 | Bank of Baroda | 301.81 | 99.36% | 0.34% | 0.30% | 0.07% | |
| 8 | Union Bank of India | 292.91 | 99.21% | 0.18% | 0.61% | 0.13% | |
| 9 | Federal Bank | 248.34 | 99.75% | 0.25% | 0.00% | 0.00% | |
| 10 | Punjab National Bank | 236.23 | 99.44% | 0.42% | 0.14% | 0.06% | |
| 11 | Canara Bank | 234.42 | 99.35% | 0.43% | 0.22% | 0.12% | |
| 12 | Kotak Mahindra Bank | 215.88 | 99.38% | 0.45% | 0.16% | 0.13% | |
| 13 | Bank of India | 162.61 | 99.58% | 0.23% | 0.19% | 0.08% | |
| 14 | Indian Bank | 159.64 | 95.86% | 0.71% | 3.43% | 0.62% | |
| 15 | Airtel Payments Bank | 141.03 | 99.18% | 0.63% | 0.19% | 0.12% | |
| 16 | INDUSIND BANK | 102.49 | 98.14% | 0.26% | 1.60% | 0.88% | |
| 17 | India Post Payment Bank | 87.55 | 98.04% | 0.42% | 1.55% | 0.16% | |
| 18 | Central Bank Of India | 78.85 | 97.57% | 0.55% | 1.88% | 0.61% | |
| 19 | Indian Overseas Bank | 66.65 | 97.73% | 0.42% | 1.85% | 0.39% | |
| 20 | UCO Bank | 63.35 | 95.99% | 0.80% | 3.20% | 0.51% | |
| 21 | IDFC FIRST Bank | 57.22 | 99.11% | 0.82% | 0.07% | 0.00% | |
| 22 | IDBI Bank Limited | 56.22 | 99.30% | 0.45% | 0.26% | 0.13% | |
| 23 | Fino Payments Bank Limited FIP | 50.15 | 98.01% | 0.64% | 1.35% | 0.07% | |
| 24 | Bank of Maharashtra | 45.61 | 98.10% | 0.30% | 1.60% | 0.28% | |
| 25 | Karnataka Bank | 37.09 | 98.79% | 0.60% | 0.62% | 0.01% | |
| 26 | RBL bank | 30.68 | 98.28% | 0.30% | 1.42% | 0.37% | |
| 27 | Karur Vysya Bank | 29.51 | 99.30% | 0.44% | 0.26% | 0.06% | |
| 28 | South Indian Bank | 27.40 | 99.35% | 0.21% | 0.44% | 0.13% | |
| 29 | Bandhan Bank | 26.60 | 98.66% | 0.09% | 1.25% | 0.16% | |
| 30 | AU small Finance Bank | 21.31 | 98.80% | 1.08% | 0.13% | 0.08% | |
| 31 | Tamilnad Mercantile Bank | 17.86 | 97.78% | 0.23% | 1.98% | 0.21% | |
| 32 | Jammu and Kashmir Bank | 17.29 | 97.87% | 0.32% | 1.80% | 0.24% | |
| 33 | City Union Bank | 16.95 | 98.64% | 1.01% | 0.35% | 0.06% | |
| 34 | Ujjivan Small Finance Bank | 16.46 | 99.24% | 0.33% | 0.42% | 0.15% | |
| 35 | Punjab and Sind Bank | 12.67 | 99.39% | 0.18% | 0.42% | 0.07% | |
| 36 | Equitas Small Finance Bank | 12.19 | 97.65% | 2.02% | 0.32% | 0.02% | |
| 37 | Kerala Gramin Bank | 11.77 | 99.15% | 0.23% | 0.62% | 0.33% | |
| 38 | Tri O Tech Solutions Private Limited | 11.15 | 94.21% | 5.50% | 0.29% | 0.11% | |
| 39 | Pragathi Krishna Gramin Bank | 10.87 | 98.97% | 0.41% | 0.62% | 0.48% | |
| 40 | Andhra Pradesh Grameena Vikas Bank | 10.36 | 97.88% | 1.11% | 1.01% | 0.28% | |
| 41 | CITIBank | 9.77 | 99.83% | 0.00% | 0.17% | 0.16% | |
| 42 | Maharashtra Gramin Bank | 9.40 | 96.10% | 0.26% | 3.64% | 0.17% | |
| 43 | DBS Bank India Limited | 9.38 | 98.63% | 1.27% | 0.10% | 0.08% | |
| 44 | Baroda UP Gramin Bank | 9.10 | 89.40% | 0.83% | 9.77% | 2.84% | |
| 45 | ESAF Small Finance Bank Ltd. | 8.66 | 99.40% | 0.03% | 0.57% | 0.42% | |
| 46 | Rajasthan Marudhara Gramin Bank | 8.47 | 97.95% | 0.81% | 1.24% | 0.18% | |
| 47 | Saraswat Bank | 6.90 | 99.62% | 0.22% | 0.17% | 0.10% | |
| 48 | Andhra Pragathi Grameena Bank | 6.67 | 96.00% | 0.55% | 3.45% | 0.09% | |
| 49 | Fincare Small Finance Bank Ltd | 6.23 | 94.85% | 3.45% | 1.70% | 0.42% | |
| 50 | Sarva Haryana Gramin Bank | 6.22 | 99.13% | 0.42% | 0.45% | 0.01% | |
| UPI Apps (Sep'23) | |||||||||||
|---|---|---|---|---|---|---|---|---|---|---|---|
| Sr.No. | Application Name | Customer Initiated Transactions | B2C Transactions | B2B Transactions | On-us Transactions | Total | |||||
| Volume (Mn) | Value (Cr) | Volume (Mn) | Value (Cr) | Volume (Mn) | Value (Cr) | Volume (Mn) | Value (Cr) | Volume (Mn) | Value (Cr) | ||
| 1 | PhonePe | 4,972.81 | 774,845.98 | 0.00 | 0.00 | 0.00 | 0.00 | 0.00 | 0.00 | 4,972.81 | 774,845.98 |
| 2 | Google Pay | 3,780.89 | 541,624.06 | 0.00 | 0.00 | 0.00 | 0.00 | 0.00 | 0.00 | 3,780.89 | 541,624.06 |
| 3 | Paytm Payments Bank App | 1,333.38 | 153,708.60 | 3.47 | 8.06 | 0.58 | 935.71 | 114.56 | 22,213.09 | 1,451.99 | 176,865.46 |
| 4 | Cred | 86.50 | 31,558.20 | 0.00 | 0.00 | 0.00 | 0.00 | 0.00 | 0.00 | 86.50 | 31,558.20 |
| 5 | Axis Bank Apps | 8.93 | 1,721.75 | 59.77 | 1,856.50 | 0.06 | 6.66 | 0.00 | 0.00 | 68.76 | 3,584.91 |
| 6 | Amazon Pay | 48.78 | 5,386.29 | 0.00 | 0.00 | 0.00 | 0.00 | 0.00 | 0.00 | 48.78 | 5,386.29 |
| 7 | ICICI Bank Apps | 25.90 | 9,874.70 | 4.05 | 359.88 | 7.58 | 9,818.34 | 0.00 | 0.00 | 37.52 | 20,052.91 |
| 8 | Yes Bank Apps | 28.09 | 10,794.85 | 0.00 | 0.00 | 0.41 | 53.11 | 0.00 | 0.00 | 28.49 | 10,847.96 |
| 9 | BHIM | 24.15 | 8,005.18 | 0.00 | 0.00 | 0.00 | 0.00 | 0.00 | 0.00 | 24.15 | 8,005.18 |
| 10 | FAM | 22.88 | 263.37 | 0.00 | 0.00 | 0.00 | 0.00 | 0.00 | 0.00 | 22.88 | 263.37 |
| 11 | Kotak Mahindra Bank Apps | 21.57 | 3,737.25 | 0.00 | 0.00 | 0.00 | 0.01 | 0.00 | 0.00 | 21.57 | 3,737.26 |
| 12 | 20.55 | 1,732.15 | 0.00 | 0.00 | 0.00 | 0.00 | 0.00 | 0.00 | 20.55 | 1,732.15 | |
| 13 | HDFC Bank Apps | 18.87 | 4,739.38 | 0.00 | 0.00 | 0.00 | 0.00 | 0.00 | 0.00 | 18.87 | 4,739.39 |
| 14 | Bajaj Finserv | 14.14 | 2,069.98 | 0.00 | 0.00 | 0.00 | 0.00 | 0.00 | 0.00 | 14.14 | 2,069.98 |
| 15 | Airtel Payments Bank Apps | 10.45 | 747.05 | 0.00 | 0.00 | 0.00 | 0.04 | 0.00 | 0.12 | 10.46 | 747.21 |
| 16 | Groww | 6.50 | 3,596.95 | 0.00 | 0.00 | 0.00 | 0.00 | 0.00 | 0.00 | 6.50 | 3,596.95 |
| 17 | Samsung Pay | 5.81 | 528.20 | 0.00 | 0.00 | 0.00 | 0.00 | 0.00 | 0.00 | 5.81 | 528.20 |
| 18 | Federal Bank Apps | 5.54 | 692.03 | 0.00 | 0.00 | 0.00 | 0.00 | 0.00 | 0.00 | 5.54 | 692.03 |
| 19 | State Bank of India Apps | 5.40 | 2,130.26 | 0.00 | 0.00 | 0.02 | 0.64 | 0.00 | 0.00 | 5.42 | 2,130.89 |
| 20 | India Post Payments Bank Apps | 5.28 | 447.37 | 0.00 | 0.00 | 0.00 | 0.00 | 0.00 | 0.00 | 5.28 | 447.37 |
| 21 | IDFC Bank Apps | 4.42 | 1,109.67 | 0.00 | 0.00 | 0.00 | 0.00 | 0.00 | 0.00 | 4.42 | 1,109.67 |
| 22 | Jupiter | 4.05 | 529.64 | 0.00 | 0.00 | 0.00 | 0.00 | 0.00 | 0.00 | 4.05 | 529.64 |
| 23 | Mobikwik | 3.92 | 1,182.65 | 0.00 | 0.00 | 0.00 | 0.00 | 0.00 | 0.00 | 3.92 | 1,182.65 |
| 24 | Standard Chartered Bank Apps | 1.72 | 148.27 | 0.00 | 0.00 | 0.31 | 182.94 | 0.00 | 0.00 | 2.03 | 331.21 |
| 25 | Deutsche Bank Apps | 1.93 | 315.27 | 0.00 | 0.00 | 0.00 | 0.02 | 0.00 | 0.00 | 1.93 | 315.29 |
| 26 | Canara Bank Apps | 1.89 | 569.48 | 0.00 | 0.00 | 0.00 | 0.00 | 0.00 | 0.00 | 1.89 | 569.48 |
| 27 | RBL Bank Apps | 1.34 | 565.87 | 0.00 | 0.00 | 0.26 | 9.74 | 0.00 | 0.00 | 1.60 | 575.61 |
| 28 | Jio Payments Bank Apps | 1.44 | 108.84 | 0.00 | 0.00 | 0.00 | 0.00 | 0.00 | 0.00 | 1.44 | 108.84 |
| 29 | Bank of Baroda Apps | 1.22 | 470.91 | 0.00 | 0.00 | 0.00 | 5.52 | 0.00 | 0.00 | 1.22 | 476.43 |
| 30 | slice | 1.06 | 310.90 | 0.00 | 0.00 | 0.00 | 0.00 | 0.00 | 0.00 | 1.06 | 310.90 |
| 31 | Punjab National Bank Apps | 1.00 | 197.93 | 0.00 | 0.00 | 0.00 | 0.00 | 0.00 | 0.00 | 1.00 | 197.93 |
| 32 | OMNI | 0.98 | 36.12 | 0.00 | 0.00 | 0.00 | 0.00 | 0.00 | 0.00 | 0.98 | 36.12 |
| 33 | IndusInd Bank Apps | 0.89 | 182.26 | 0.00 | 0.00 | 0.00 | 0.00 | 0.00 | 0.00 | 0.89 | 182.26 |
| 34 | Union Bank Apps | 0.87 | 324.39 | 0.00 | 0.00 | 0.00 | 0.00 | 0.00 | 0.00 | 0.87 | 324.39 |
| 35 | AU Small Finance Bank Apps | 0.66 | 214.25 | 0.00 | 0.00 | 0.00 | 0.00 | 0.00 | 0.00 | 0.66 | 214.25 |
| 36 | GOAXB | 0.64 | 74.94 | 0.00 | 0.00 | 0.00 | 0.00 | 0.00 | 0.00 | 0.64 | 74.94 |
| 37 | Karnataka Bank Apps | 0.62 | 125.70 | 0.00 | 0.00 | 0.00 | 0.00 | 0.00 | 0.00 | 0.62 | 125.70 |
| 38 | DBS Digibank Apps | 0.45 | 178.89 | 0.00 | 0.00 | 0.00 | 0.53 | 0.00 | 0.00 | 0.45 | 179.42 |
| 39 | Central Bank of India Apps | 0.40 | 94.84 | 0.00 | 0.00 | 0.00 | 0.38 | 0.00 | 0.00 | 0.40 | 95.22 |
| 40 | UCO Bank Apps | 0.37 | 127.06 | 0.00 | 0.00 | 0.00 | 0.00 | 0.00 | 0.00 | 0.37 | 127.06 |
| 41 | Indian Bank Apps | 0.32 | 89.16 | 0.00 | 0.00 | 0.01 | 60.16 | 0.00 | 0.00 | 0.33 | 149.32 |
| 42 | Bank of India Apps | 0.28 | 86.17 | 0.00 | 0.00 | 0.00 | 0.00 | 0.00 | 0.00 | 0.28 | 86.17 |
| 43 | NAVIAXIS | 0.27 | 17.75 | 0.00 | 0.00 | 0.00 | 0.00 | 0.00 | 0.00 | 0.27 | 17.75 |
| 44 | South Indian Bank Apps | 0.26 | 72.90 | 0.00 | 0.00 | 0.00 | 0.00 | 0.00 | 0.00 | 0.26 | 72.90 |
| 45 | Fino Payments bank Apps | 0.22 | 15.99 | 0.00 | 0.00 | 0.00 | 0.00 | 0.00 | 0.00 | 0.22 | 15.99 |
| 46 | BPAYWALLET | 0.19 | 42.31 | 0.00 | 0.00 | 0.00 | 0.00 | 0.00 | 0.00 | 0.19 | 42.31 |
| 47 | HSBC Bank Apps | 0.16 | 101.08 | 0.00 | 0.12 | 0.00 | 0.00 | 0.00 | 0.00 | 0.16 | 101.20 |
| 48 | Tamilnad Mercantile Bank Apps | 0.10 | 26.99 | 0.00 | 0.00 | 0.00 | 0.00 | 0.00 | 0.00 | 0.10 | 26.99 |
| 49 | TataNeu | 0.09 | 14.82 | 0.00 | 0.00 | 0.00 | 0.00 | 0.00 | 0.00 | 0.09 | 14.82 |
| 50 | Fave | 0.09 | 6.34 | 0.00 | 0.00 | 0.00 | 0.00 | 0.00 | 0.00 | 0.09 | 6.34 |
| 51 | Ultracash | 0.08 | 4.77 | 0.00 | 0.00 | 0.00 | 0.00 | 0.00 | 0.00 | 0.08 | 4.77 |
| 52 | Citi Bank Apps | 0.08 | 61.34 | 0.00 | 0.00 | 0.00 | 0.00 | 0.00 | 0.00 | 0.08 | 61.34 |
| 53 | INDIE | 0.07 | 16.09 | 0.00 | 0.00 | 0.00 | 0.00 | 0.00 | 0.00 | 0.07 | 16.09 |
| 54 | Indian Overseas Bank Apps | 0.07 | 19.12 | 0.00 | 0.00 | 0.00 | 0.00 | 0.00 | 0.00 | 0.07 | 19.12 |
| 55 | City Union Bank Apps | 0.07 | 20.60 | 0.00 | 0.00 | 0.00 | 0.00 | 0.00 | 0.00 | 0.07 | 20.60 |
| 56 | IDBI Bank Apps | 0.06 | 32.31 | 0.00 | 0.00 | 0.00 | 0.00 | 0.00 | 0.00 | 0.06 | 32.31 |
| 57 | Bank of Maharashtra Apps | 0.05 | 8.55 | 0.00 | 0.00 | 0.00 | 0.00 | 0.00 | 0.00 | 0.05 | 8.55 |
| 58 | Karur Vysya Bank Apps | 0.04 | 15.87 | 0.00 | 0.00 | 0.00 | 0.00 | 0.00 | 0.00 | 0.04 | 15.87 |
| 59 | MakeMyTrip | 0.04 | 21.32 | 0.00 | 0.00 | 0.00 | 0.00 | 0.00 | 0.00 | 0.04 | 21.32 |
| 60 | SHRIRAM | 0.03 | 2.80 | 0.00 | 0.00 | 0.00 | 0.00 | 0.00 | 0.00 | 0.03 | 2.80 |
| 61 | NSDL Payments Bank Apps | 0.03 | 5.78 | 0.00 | 0.00 | 0.00 | 0.00 | 0.00 | 0.00 | 0.03 | 5.78 |
| 62 | Equitas Small Finance Bank Apps | 0.03 | 19.39 | 0.00 | 0.00 | 0.00 | 0.00 | 0.00 | 0.00 | 0.03 | 19.39 |
| 63 | DIGIKHATA | 0.03 | 10.80 | 0.00 | 0.00 | 0.00 | 0.00 | 0.00 | 0.00 | 0.03 | 10.80 |
| 64 | SLICE | 0.03 | 3.80 | 0.00 | 0.00 | 0.00 | 0.00 | 0.00 | 0.00 | 0.03 | 3.80 |
| 65 | Allahabad Bank Apps | 0.03 | 7.15 | 0.00 | 0.00 | 0.00 | 0.00 | 0.00 | 0.00 | 0.03 | 7.15 |
| 66 | Punjab Sind Bank Apps | 0.03 | 12.32 | 0.00 | 0.00 | 0.00 | 0.00 | 0.00 | 0.00 | 0.03 | 12.32 |
| 67 | DHANI | 0.02 | 2.58 | 0.00 | 0.00 | 0.00 | 0.00 | 0.00 | 0.00 | 0.02 | 2.58 |
| 68 | Utkarsh Small Finance Bank Apps | 0.02 | 6.63 | 0.00 | 0.00 | 0.00 | 0.00 | 0.00 | 0.00 | 0.02 | 6.63 |
| 69 | Jammu and Kashmir Bank Apps | 0.01 | 2.56 | 0.00 | 0.00 | 0.00 | 0.00 | 0.00 | 0.00 | 0.01 | 2.56 |
| 70 | Dhanlaxmi Bank Apps | 0.01 | 3.46 | 0.00 | 0.00 | 0.00 | 0.00 | 0.00 | 0.00 | 0.01 | 3.46 |
| 71 | GoIbibo | 0.01 | 2.34 | 0.00 | 0.00 | 0.00 | 0.00 | 0.00 | 0.00 | 0.01 | 2.34 |
| 72 | Others | 0.06 | 10.18 | 0.00 | 0.00 | 0.00 | 0.06 | 0.00 | 0.00 | 0.06 | 10.25 |
Note:-
| UPI P2P and P2M Transactions | ||||||
|---|---|---|---|---|---|---|
| Month | Total | P2P | P2M | |||
| Volume (Mn) | Value (Cr) | Volume (Mn) | Value (Cr) | Volume (Mn) | Value (Cr) | |
| Sep'23 | 10,555.69 | 15,79,133.18 | 4,373.12 | 11,82,916.93 | 6,181.57 | 3,96,216.25 |

| UPI Payer PSP Performance (Sep'23) | |||||
|---|---|---|---|---|---|
| Sr. No. | Payer PSP | Total Volume (In Mn) | Approved % | BD % | TD % |
| 1 | Yes Bank Ltd | 3454.56 | 98.37% | 1.61% | 0.02% |
| 2 | Axis Bank Ltd | 2052.67 | 98.49% | 1.49% | 0.02% |
| 3 | ICICI Bank | 1889.52 | 98.30% | 1.68% | 0.02% |
| 4 | Paytm Payments Bank | 1353.31 | 98.49% | 1.49% | 0.02% |
| 5 | HDFC Bank Ltd | 901.08 | 98.40% | 1.57% | 0.03% |
| 6 | State Bank Of India | 889.49 | 98.86% | 1.12% | 0.02% |
| 7 | BHIM | 25.28 | 91.38% | 8.58% | 0.04% |
| 8 | Fampay (PPI) | 23.20 | 96.59% | 3.41% | 0.00% |
| 9 | Kotak Mahindra Bank | 21.92 | 95.48% | 4.35% | 0.17% |
| 10 | Airtel Payments Bank | 10.66 | 94.93% | 5.06% | 0.01% |
| 11 | Federal Bank | 5.63 | 97.16% | 2.82% | 0.02% |
| 12 | India Post Payment Bank | 5.35 | 93.65% | 6.31% | 0.04% |
| 13 | IDFC FIRST Bank | 4.67 | 95.37% | 4.03% | 0.60% |
| 14 | RBL Bank | 2.71 | 99.95% | 0.05% | 0.00% |
| 15 | Standard Chartered | 2.04 | 98.55% | 1.43% | 0.02% |
| UPI Payee PSP Performance (Sep'23) | |||||
|---|---|---|---|---|---|
| Sr. No. | Payee PSP | Total Volume (In Mn) | Approved % | BD % | TD % |
| 1 | Yes Bank Ltd | 3576.59 | 99.77% | 0.22% | 0.01% |
| 2 | Paytm Payments Bank | 2642.59 | 99.53% | 0.45% | 0.02% |
| 3 | ICICI Bank | 1226.53 | 99.53% | 0.44% | 0.03% |
| 4 | Axis Bank Ltd | 1164.83 | 99.53% | 0.45% | 0.02% |
| 5 | HDFC Bank Ltd | 581.25 | 99.09% | 0.79% | 0.12% |
| 6 | State Bank Of India | 498.93 | 99.38% | 0.56% | 0.06% |
| 7 | Federal Bank | 184.36 | 98.31% | 1.69% | 0.00% |
| 8 | IndusInd Bank | 51.09 | 97.45% | 1.93% | 0.62% |
| 9 | Kotak Mahindra Bank | 35.54 | 99.49% | 0.43% | 0.08% |
| 10 | IDFC FIRST Bank | 33.96 | 98.99% | 0.62% | 0.39% |
| 11 | Indian Bank | 20.95 | 97.78% | 1.46% | 0.76% |
| 12 | Fino Payments Bank | 18.20 | 99.70% | 0.17% | 0.13% |
| 13 | Canara Bank | 16.64 | 99.70% | 0.28% | 0.03% |
| 14 | RBL Bank | 16.57 | 96.56% | 2.83% | 0.61% |
| 15 | Cosmos Bank | 15.53 | 97.35% | 1.92% | 0.73% |
| UPI Merchant Category-wise Classification - September'23 (Arranged by Volume) | ||||
|---|---|---|---|---|
| Type | MCC | Description | Volume (in Mn) | Value (in Cr.) |
| High Transacting Categories | 5411 | Groceries and supermarkets | 1,189.43 | 31,925.30 |
| 5812 | Eating places and restaurants | 758.52 | 12,013.83 | |
| 4814 | Telecommunication services, including local and long distance calls, credit card calls, calls through use of magnetic stripe reading telephones and faxes | 536.60 | 11,858.05 | |
| 5814 | Fast food restaurants | 399.05 | 5,024.60 | |
| 5311 | Department stores | 391.83 | 7,620.06 | |
| 5541 | Service stations (with or without ancillary services) | 303.45 | 18,058.36 | |
| 5816 | Digital Goods: Games | 254.64 | 9,061.02 | |
| 5912 | Drug stores and pharmacies | 164.84 | 6,236.44 | |
| 5462 | Bakeries | 134.99 | 1,931.35 | |
| 4900 | Utilities electric, gas, water and sanitary | 88.93 | 11,262.20 | |
| Medium Transacting Categories | 5813 | Drinking places (alcoholic beverages) bars, taverns, night-clubs, cocktail lounges and discothques | 88.56 | 3,255.55 |
| 5451 | Dairies | 84.11 | 1,722.63 | |
| 7299 | Miscellaneous personal services not elsewhere classified | 77.95 | 2,634.03 | |
| 6540 | Debit card to wallet credit (Wallet top up) | 68.79 | 5,270.40 | |
| 7322 | Debt collection agencies | 67.42 | 55,046.90 | |
| 6012 | Financial institutions merchandise and services | 62.50 | 14,768.79 | |
| 5441 | Candy, nut and confectionery shops | 44.94 | 810.80 | |
| 5137 | Mens, womens and childrens uniforms and commercial clothing | 42.94 | 4,201.22 | |
| 5993 | Cigar shops and stands | 42.76 | 326.22 | |
| 5422 | Freezer and locker meat provisioners | 41.86 | 1,350.52 | |
| All Other Categories | 5732 | Electronics shops | 41.01 | 4,889.66 |
| 5399 | Miscellaneous general merchandise | 40.39 | 4,019.20 | |
| 7230 | Beauty and barber shops | 37.73 | 1,100.37 | |
| 6211 | Securities brokers and dealers | 36.51 | 31,775.43 | |
| 9399 | Government services not elsewhere classified | 33.50 | 4,098.66 | |
| 5722 | Household appliance shops | 33.34 | 3,109.94 | |
| 4121 | Taxi-cabs and limousines | 31.32 | 700.91 | |
| 5943 | Stationery, office and school supply shops | 30.15 | 891.12 | |
| 4899 | Cable and other pay television services | 27.86 | 1,180.96 | |
| Others | 1,025.63 | 1,40,071.71 | ||
| Total | 6,181.57 | 3,96,216.25 | ||
| State-wise UPI Product Statistics* (Sep'23) | |||||
|---|---|---|---|---|---|
| Sr. No. | State / Union Territory | Volume (in Mn ) | Volume Contribution (%) | Value (in Cr.) | Value Contribution (%) |
| 1 | MAHARASHTRA | 2,156.02 | 20.43% | 2,86,792.45 | 18.16% |
| 2 | KARNATAKA | 896.89 | 8.50% | 1,25,683.26 | 7.96% |
| 3 | TELANGANA | 713.29 | 6.76% | 1,21,128.45 | 7.67% |
| 4 | UTTAR PRADESH | 680.36 | 6.45% | 95,195.96 | 6.03% |
| 5 | TAMIL NADU | 521.85 | 4.94% | 85,968.46 | 5.44% |
| 6 | MADHYA PRADESH | 512.81 | 4.86% | 69,250.13 | 4.39% |
| 7 | RAJASTHAN | 431.28 | 4.09% | 66,104.53 | 4.19% |
| 8 | DELHI | 416.31 | 3.94% | 55,139.92 | 3.49% |
| 9 | ANDHRA PRADESH | 336.99 | 3.19% | 67,178.11 | 4.25% |
| 10 | GUJARAT | 319.31 | 3.02% | 51,590.99 | 3.27% |
| 11 | BIHAR | 305.39 | 2.89% | 48,595.98 | 3.08% |
| 12 | WEST BENGAL | 280.30 | 2.66% | 48,707.55 | 3.08% |
| 13 | HARYANA | 265.59 | 2.52% | 39,655.16 | 2.51% |
| 14 | KERALA | 237.42 | 2.25% | 35,412.25 | 2.24% |
| 15 | ODISHA | 224.43 | 2.13% | 31,146.94 | 1.97% |
| 16 | PUNJAB | 146.64 | 1.39% | 24,711.78 | 1.56% |
| 17 | ASSAM | 110.01 | 1.04% | 15,968.78 | 1.01% |
| 18 | JHARKHAND | 104.08 | 0.99% | 14,937.74 | 0.95% |
| 19 | CHHATTISGARH | 97.40 | 0.92% | 12,764.10 | 0.81% |
| 20 | UTTARAKHAND | 83.19 | 0.79% | 11,010.69 | 0.70% |
| 21 | HIMACHAL PRADESH | 36.61 | 0.35% | 5,035.77 | 0.32% |
| 22 | JAMMU AND KASHMIR | 35.83 | 0.34% | 5,399.43 | 0.34% |
| 23 | CHANDIGARH | 21.45 | 0.20% | 2,853.16 | 0.18% |
| 24 | GOA | 20.69 | 0.20% | 3,017.62 | 0.19% |
| 25 | PUDUCHERRY | 11.40 | 0.11% | 1,688.30 | 0.11% |
| 26 | ARUNACHAL PRADESH | 9.41 | 0.09% | 1,498.65 | 0.09% |
| 27 | TRIPURA | 7.52 | 0.07% | 1,274.91 | 0.08% |
| 28 | DADRA & NAGAR HAVELI & DAMAN & DIU | 6.32 | 0.06% | 718.59 | 0.05% |
| 29 | NAGALAND | 5.64 | 0.05% | 1,240.15 | 0.08% |
| 30 | MEGHALAYA | 5.41 | 0.05% | 959.02 | 0.06% |
| 31 | MIZORAM | 4.60 | 0.04% | 1,000.59 | 0.06% |
| 32 | SIKKIM | 4.10 | 0.04% | 683.81 | 0.04% |
| 33 | MANIPUR | 3.53 | 0.03% | 1,069.54 | 0.07% |
| 34 | LADAKH | 2.10 | 0.02% | 481.10 | 0.03% |
| 35 | ANDAMAN & NICOBAR | 1.87 | 0.02% | 347.87 | 0.02% |
| 36 | LAKSHADWEEP | 0.13 | 0.00% | 25.16 | 0.00% |
| 37 | UNCLASSIFIED# | 1,539.54 | 14.58% | 2,44,896.29 | 15.51% |
| UPI Remitter Banks - Top 50 Banks (Aug'23) | |||||||
|---|---|---|---|---|---|---|---|
| Sr. No. | UPI Remitter Banks (Aug-2023) | Total Volume (In Mn) | Approved % | BD % | TD% | Total Debit Reversal Count (In Mn) | Debit Reversal Success % |
| 1 | State Bank Of India | 2707.09 | 95.05% | 4.22% | 0.73% | 12.89 | 93% |
| 2 | HDFC BANK LTD | 933.63 | 95.83% | 4.03% | 0.15% | 2.83 | 94% |
| 3 | Bank of Baroda | 695.99 | 93.18% | 5.19% | 1.63% | 2.49 | 80% |
| 4 | Union Bank of India | 662.03 | 94.81% | 4.20% | 1.00% | 3.42 | 64% |
| 5 | Punjab National Bank | 518.59 | 94.33% | 4.52% | 1.15% | 2.54 | 88% |
| 6 | ICICI Bank | 508.79 | 96.20% | 3.10% | 0.71% | 2.13 | 85% |
| 7 | Kotak Mahindra Bank | 498.97 | 94.82% | 5.13% | 0.05% | 1.25 | 85% |
| 8 | Axis Bank Ltd. | 490.64 | 96.24% | 3.56% | 0.20% | 1.56 | 61% |
| 9 | Canara Bank | 487.59 | 94.49% | 4.98% | 0.53% | 1.89 | 84% |
| 10 | Paytm Payments Bank | 455.52 | 96.43% | 3.54% | 0.02% | 0.54 | 98% |
| 11 | Bank of India | 344.29 | 95.67% | 3.89% | 0.45% | 1.16 | 81% |
| 12 | Indian Bank | 291.98 | 95.21% | 4.45% | 0.33% | 0.94 | 76% |
| 13 | Airtel Payments Bank | 248.48 | 90.47% | 8.74% | 0.79% | 0.86 | 1% |
| 14 | India Post Payment Bank | 194.45 | 85.69% | 11.86% | 2.46% | 0.82 | 71% |
| 15 | Federal Bank | 166.08 | 95.08% | 4.52% | 0.39% | 0.41 | 85% |
| 16 | Central Bank Of India | 162.66 | 88.74% | 9.13% | 2.13% | 1.96 | 76% |
| 17 | Indian Overseas Bank | 139.00 | 93.84% | 4.49% | 1.67% | 0.89 | 83% |
| 18 | UCO Bank | 130.70 | 94.20% | 4.91% | 0.88% | 0.75 | 47% |
| 19 | IDBI Bank Limited | 125.88 | 94.14% | 3.70% | 2.16% | 0.72 | 79% |
| 20 | Bank of Maharashtra | 116.36 | 94.33% | 5.13% | 0.54% | 0.37 | 79% |
| 21 | INDUSIND BANK | 103.58 | 91.60% | 5.32% | 3.08% | 1.00 | 41% |
| 22 | Fino Payments Bank Limited FIP | 94.61 | 84.39% | 14.35% | 1.26% | 0.34 | 72% |
| 23 | Yes Bank Ltd | 86.57 | 95.43% | 4.43% | 0.14% | 0.19 | 75% |
| 24 | Karnataka Bank | 84.56 | 93.78% | 5.37% | 0.86% | 0.18 | 82% |
| 25 | IDFC FIRST Bank | 64.37 | 93.77% | 5.51% | 0.71% | 0.30 | 50% |
| 26 | Karur Vysya Bank | 52.31 | 93.73% | 6.02% | 0.25% | 0.13 | 83% |
| 27 | South Indian Bank | 43.92 | 96.05% | 3.94% | 0.02% | 0.07 | 97% |
| 28 | Bandhan Bank | 42.73 | 94.35% | 4.70% | 0.96% | 0.23 | 61% |
| 29 | Jammu and Kashmir Bank | 35.95 | 92.35% | 5.88% | 1.77% | 0.21 | 1% |
| 30 | City Union Bank | 31.40 | 93.30% | 6.15% | 0.54% | 0.12 | 81% |
| 31 | AU small Finance Bank | 31.04 | 95.27% | 4.69% | 0.04% | 0.09 | 97% |
| 32 | Ujjivan Small Finance Bank | 31.03 | 93.60% | 5.73% | 0.67% | 0.14 | 56% |
| 33 | Punjab and Sind Bank | 27.25 | 88.89% | 6.64% | 4.48% | 0.36 | 36% |
| 34 | Tamilnad Mercantile Bank | 27.10 | 94.32% | 5.38% | 0.29% | 0.05 | 88% |
| 35 | Equitas Small Finance Bank | 26.39 | 91.08% | 8.55% | 0.37% | 0.07 | 97% |
| 36 | Standard Chartered | 25.80 | 96.46% | 2.13% | 1.41% | 0.10 | 56% |
| 37 | DBS Bank India Limited | 23.99 | 95.34% | 4.09% | 0.57% | 0.08 | 64% |
| 38 | Andhra Pradesh Grameena Vikas Bank | 21.67 | 85.93% | 11.66% | 2.40% | 0.11 | 57% |
| 39 | Kerala Gramin Bank | 21.45 | 87.49% | 7.82% | 4.70% | 0.35 | 36% |
| 40 | Pragathi Krishna Gramin Bank | 20.54 | 88.05% | 10.31% | 1.63% | 0.13 | 71% |
| 41 | Tri O Tech Solutions Private Limited | 20.27 | 100.00% | 0.00% | 0.00% | 0.00 | NA |
| 42 | Maharashtra Gramin Bank | 19.77 | 84.80% | 12.66% | 2.54% | 0.05 | 77% |
| 43 | Citibank | 19.62 | 96.15% | 3.31% | 0.53% | 0.07 | 98% |
| 44 | Saraswat Bank | 19.25 | 96.12% | 3.05% | 0.83% | 0.07 | 72% |
| 45 | Rajasthan Marudhara Gramin Bank | 17.16 | 85.32% | 11.34% | 3.33% | 0.10 | 46% |
| 46 | ESAF Small Finance Bank Ltd. | 16.63 | 92.99% | 5.08% | 1.93% | 0.07 | 64% |
| 47 | Baroda UP Gramin Bank | 15.76 | 74.78% | 10.85% | 14.36% | 0.54 | 33% |
| 48 | RBL Bank | 13.67 | 87.20% | 9.24% | 3.56% | 0.13 | 69% |
| 49 | Fincare Small Finance Bank Ltd | 13.25 | 86.13% | 11.59% | 2.28% | 0.11 | 45% |
| 50 | Sarva Haryana Gramin Bank | 12.81 | 90.66% | 6.73% | 2.61% | 0.11 | 36% |
| UPI Beneficiary Banks - Top 50 Banks (Aug'23) | |||||||
|---|---|---|---|---|---|---|---|
| Sr.No. | UPI Beneficiary Banks (Aug-2023) | Total Volume (In Mn) | Approved % | BD% | TD% | Deemed Approved % | |
| 1 | Paytm Payments Bank | 2505.70 | 99.82% | 0.13% | 0.05% | 0.00% | |
| 2 | Yes Bank Ltd | 1789.49 | 99.91% | 0.02% | 0.07% | 0.01% | |
| 3 | State Bank Of India | 1114.59 | 99.09% | 0.18% | 0.73% | 0.25% | |
| 4 | Axis Bank Ltd. | 733.96 | 99.81% | 0.13% | 0.06% | 0.07% | |
| 5 | ICICI Bank | 630.09 | 99.33% | 0.31% | 0.36% | 0.16% | |
| 6 | HDFC BANK LTD | 530.64 | 99.33% | 0.59% | 0.08% | 0.07% | |
| 7 | Bank of Baroda | 308.67 | 98.24% | 0.17% | 1.59% | 0.17% | |
| 8 | Union Bank of India | 295.91 | 99.30% | 0.16% | 0.54% | 0.21% | |
| 9 | Federal Bank | 246.28 | 99.62% | 0.25% | 0.13% | 0.01% | |
| 10 | Punjab National Bank | 234.84 | 98.38% | 0.46% | 1.16% | 0.23% | |
| 11 | Canara Bank | 235.33 | 99.22% | 0.42% | 0.36% | 0.15% | |
| 12 | Kotak Mahindra Bank | 215.21 | 99.53% | 0.43% | 0.03% | 0.03% | |
| 13 | Bank of India | 164.10 | 99.36% | 0.26% | 0.38% | 0.10% | |
| 14 | Indian Bank | 162.00 | 99.51% | 0.42% | 0.07% | 0.09% | |
| 15 | Airtel Payments Bank | 135.79 | 99.00% | 0.40% | 0.60% | 0.24% | |
| 16 | INDUSIND BANK | 102.79 | 97.34% | 0.21% | 2.45% | 0.67% | |
| 17 | India Post Payment Bank | 85.70 | 98.52% | 0.43% | 1.05% | 0.29% | |
| 18 | Central Bank Of India | 80.15 | 98.45% | 0.58% | 0.96% | 0.50% | |
| 19 | Indian Overseas Bank | 66.68 | 98.56% | 0.34% | 1.10% | 0.48% | |
| 20 | UCO Bank | 61.82 | 98.75% | 0.77% | 0.49% | 0.11% | |
| 21 | IDBI Bank Limited | 57.26 | 97.73% | 0.43% | 1.84% | 0.23% | |
| 22 | Bank of Maharashtra | 46.19 | 99.26% | 0.23% | 0.51% | 0.14% | |
| 23 | Fino Payments Bank Limited FIP | 47.49 | 97.86% | 1.27% | 0.87% | 0.07% | |
| 24 | Karnataka Bank | 37.71 | 98.54% | 0.56% | 0.90% | 0.04% | |
| 25 | IDFC FIRST Bank | 54.42 | 98.71% | 0.70% | 0.59% | 0.22% | |
| 26 | Karur Vysya Bank | 29.53 | 99.38% | 0.40% | 0.22% | 0.08% | |
| 27 | South Indian Bank | 27.99 | 99.71% | 0.22% | 0.07% | 0.01% | |
| 28 | Bandhan Bank | 26.00 | 98.68% | 0.10% | 1.22% | 0.18% | |
| 29 | AU small Finance Bank | 21.75 | 98.71% | 1.20% | 0.08% | 0.02% | |
| 30 | Tamilnad Mercantile Bank | 17.43 | 99.52% | 0.19% | 0.29% | 0.01% | |
| 31 | City Union Bank | 16.91 | 98.87% | 0.77% | 0.36% | 0.08% | |
| 32 | RBL Bank | 26.86 | 98.41% | 0.39% | 1.20% | 0.25% | |
| 33 | Ujjivan Small Finance Bank | 16.59 | 99.16% | 0.31% | 0.53% | 0.21% | |
| 34 | Jammu and Kashmir Bank | 16.76 | 98.56% | 0.33% | 1.11% | 0.16% | |
| 35 | Equitas Small Finance Bank | 12.42 | 97.48% | 2.08% | 0.45% | 0.01% | |
| 36 | Punjab and Sind Bank | 12.65 | 96.48% | 0.18% | 3.33% | 0.67% | |
| 37 | Kerala Gramin Bank | 12.41 | 96.61% | 0.20% | 3.19% | 1.41% | |
| 38 | Pragathi Krishna Gramin Bank | 10.90 | 99.04% | 0.34% | 0.61% | 0.47% | |
| 39 | CITIBank | 10.05 | 99.83% | 0.00% | 0.17% | 0.13% | |
| 40 | Andhra Pradesh Grameena Vikas Bank | 10.26 | 98.47% | 0.62% | 0.91% | 0.11% | |
| 41 | DBS Bank India Limited | 9.69 | 98.22% | 1.22% | 0.56% | 0.29% | |
| 42 | Maharashtra Gramin Bank | 9.26 | 98.64% | 0.27% | 1.09% | 0.17% | |
| 43 | Tri O Tech Solutions Private Limited | 9.92 | 93.95% | 5.82% | 0.23% | 0.06% | |
| 44 | Rajasthan Marudhara Gramin Bank | 8.71 | 97.80% | 0.50% | 1.70% | 0.21% | |
| 45 | Baroda UP Gramin Bank | 9.26 | 88.47% | 0.81% | 10.73% | 2.73% | |
| 46 | ESAF Small Finance Bank Ltd. | 8.84 | 98.73% | 0.03% | 1.24% | 0.39% | |
| 47 | Andhra Pragathi Grameena Bank | 6.49 | 97.89% | 0.36% | 1.74% | 0.03% | |
| 48 | Saraswat Bank | 7.12 | 99.11% | 0.20% | 0.69% | 0.18% | |
| 49 | Sarva Haryana Gramin Bank | 5.95 | 97.17% | 0.48% | 2.34% | 0.38% | |
| 50 | Baroda Rajasthan Kshetriya Gramin Bank | 5.64 | 95.32% | 2.63% | 2.05% | 0.53% | |
| UPI Apps (Aug'23) | |||||||||||
|---|---|---|---|---|---|---|---|---|---|---|---|
| Sr.No. | Application Name | Customer Initiated Transactions | B2C Transactions | B2B Transactions | On-us Transactions | Total | |||||
| Volume (Mn) | Value (Cr) | Volume (Mn) | Value (Cr) | Volume (Mn) | Value (Cr) | Volume (Mn) | Value (Cr) | Volume (Mn) | Value (Cr) | ||
| 1 | PhonePe | 4987.33 | 775265.57 | 0.00 | 0.00 | 0.00 | 0.00 | 0.00 | 0.00 | 4987.33 | 775265.57 |
| 2 | Google Pay | 3767.68 | 538113.42 | 0.00 | 0.00 | 0.00 | 0.00 | 0.00 | 0.00 | 3767.68 | 538113.42 |
| 3 | Paytm Payments Bank App | 1363.05 | 153577.58 | 1.86 | 5.06 | 0.59 | 939.00 | 119.32 | 22282.87 | 1484.82 | 176804.51 |
| 4 | Cred | 85.13 | 31926.20 | 0.00 | 0.00 | 0.00 | 0.00 | 0.00 | 0.00 | 85.13 | 31926.20 |
| 5 | Axis Bank Apps | 9.37 | 1753.27 | 60.00 | 1275.96 | 0.05 | 7.88 | 0.00 | 0.00 | 69.43 | 3037.11 |
| 6 | Amazon Pay | 54.02 | 5836.99 | 0.00 | 0.00 | 0.00 | 0.00 | 0.00 | 0.00 | 54.02 | 5836.99 |
| 7 | ICICI Bank Apps | 25.85 | 9721.96 | 4.29 | 333.25 | 8.42 | 10943.90 | 0.00 | 0.00 | 38.57 | 20999.12 |
| 8 | Yes Bank Apps | 28.51 | 11154.68 | 0.00 | 0.00 | 0.44 | 100.09 | 0.00 | 0.00 | 28.94 | 11254.77 |
| 9 | BHIM | 24.61 | 7793.58 | 0.00 | 0.00 | 0.00 | 0.00 | 0.00 | 0.00 | 24.61 | 7793.58 |
| 10 | Kotak Mahindra Bank Apps | 21.16 | 3675.16 | 0.00 | 0.00 | 0.01 | 2.88 | 0.00 | 0.00 | 21.17 | 3678.04 |
| 11 | FAM | 20.27 | 235.89 | 0.00 | 0.00 | 0.00 | 0.00 | 0.00 | 0.00 | 20.27 | 235.89 |
| 12 | 19.70 | 1677.53 | 0.00 | 0.00 | 0.00 | 0.00 | 0.00 | 0.00 | 19.70 | 1677.53 | |
| 13 | HDFC Bank Apps | 18.94 | 4671.76 | 0.00 | 0.00 | 0.00 | 0.00 | 0.00 | 0.00 | 18.94 | 4671.76 |
| 14 | Bajaj Finserv | 13.22 | 1995.11 | 0.00 | 0.00 | 0.00 | 0.00 | 0.00 | 0.00 | 13.22 | 1995.11 |
| 15 | Airtel Payments Bank Apps | 10.20 | 699.21 | 0.00 | 0.00 | 0.00 | 0.00 | 0.00 | 0.06 | 10.20 | 699.27 |
| 16 | Samsung Pay | 6.00 | 538.48 | 0.00 | 0.00 | 0.00 | 0.00 | 0.00 | 0.00 | 6.00 | 538.48 |
| 17 | Federal Bank Apps | 5.70 | 700.65 | 0.00 | 0.00 | 0.00 | 0.01 | 0.00 | 0.00 | 5.70 | 700.66 |
| 18 | India Post Payments Bank Apps | 5.56 | 498.37 | 0.00 | 0.00 | 0.00 | 0.00 | 0.00 | 0.00 | 5.56 | 498.37 |
| 19 | State Bank of India Apps | 5.36 | 2104.14 | 0.00 | 0.00 | 0.02 | 0.67 | 0.00 | 0.00 | 5.39 | 2104.81 |
| 20 | Groww | 4.74 | 2911.09 | 0.00 | 0.00 | 0.00 | 0.00 | 0.00 | 0.00 | 4.74 | 2911.09 |
| 21 | IDFC Bank Apps | 4.36 | 1107.81 | 0.00 | 0.00 | 0.00 | 0.00 | 0.00 | 0.00 | 4.36 | 1107.81 |
| 22 | Mobikwik | 3.96 | 1203.54 | 0.00 | 0.00 | 0.00 | 0.00 | 0.00 | 0.00 | 3.96 | 1203.54 |
| 23 | Jupiter | 3.94 | 500.95 | 0.00 | 0.00 | 0.00 | 0.00 | 0.00 | 0.00 | 3.94 | 500.95 |
| 24 | Standard Chartered Bank Apps | 3.31 | 369.55 | 0.00 | 0.00 | 0.28 | 144.89 | 0.00 | 0.00 | 3.59 | 514.44 |
| 25 | Deutsche Bank Apps | 2.08 | 359.84 | 0.00 | 0.00 | 0.00 | 0.01 | 0.00 | 0.00 | 2.08 | 359.86 |
| 26 | Canara Bank Apps | 1.64 | 492.29 | 0.00 | 0.00 | 0.00 | 0.00 | 0.00 | 0.00 | 1.64 | 492.29 |
| 27 | Jio Payments Bank Apps | 1.42 | 113.65 | 0.00 | 0.00 | 0.00 | 0.00 | 0.00 | 0.00 | 1.42 | 113.65 |
| 28 | RBL Bank Apps | 1.20 | 540.67 | 0.00 | 0.02 | 0.19 | 7.62 | 0.00 | 0.00 | 1.38 | 548.31 |
| 29 | Bank of Baroda Apps | 1.27 | 462.61 | 0.00 | 0.00 | 0.00 | 4.23 | 0.00 | 0.00 | 1.27 | 466.84 |
| 30 | slice | 0.96 | 306.89 | 0.00 | 0.00 | 0.00 | 0.00 | 0.00 | 0.00 | 0.96 | 306.89 |
| 31 | Union Bank Apps | 0.90 | 324.77 | 0.00 | 0.00 | 0.00 | 0.00 | 0.00 | 0.00 | 0.90 | 324.77 |
| 32 | Punjab National Bank Apps | 0.86 | 179.75 | 0.00 | 0.00 | 0.00 | 0.00 | 0.00 | 0.00 | 0.86 | 179.75 |
| 33 | IndusInd Bank Apps | 0.85 | 391.31 | 0.00 | 0.00 | 0.00 | 0.00 | 0.00 | 0.00 | 0.85 | 391.31 |
| 34 | OMNI | 0.77 | 25.20 | 0.00 | 0.00 | 0.00 | 0.00 | 0.00 | 0.00 | 0.77 | 25.20 |
| 35 | AU Small Finance Bank Apps | 0.71 | 218.16 | 0.00 | 0.00 | 0.00 | 0.00 | 0.00 | 0.00 | 0.71 | 218.16 |
| 36 | KIWI | 0.69 | 69.86 | 0.00 | 0.00 | 0.00 | 0.00 | 0.00 | 0.00 | 0.69 | 69.86 |
| 37 | Karnataka Bank Apps | 0.65 | 127.83 | 0.00 | 0.00 | 0.00 | 0.00 | 0.00 | 0.00 | 0.65 | 127.83 |
| 38 | DBS Digibank Apps | 0.46 | 173.89 | 0.00 | 0.00 | 0.00 | 0.18 | 0.00 | 0.00 | 0.46 | 174.06 |
| 39 | Central Bank of India Apps | 0.45 | 96.12 | 0.00 | 0.00 | 0.00 | 0.29 | 0.00 | 0.00 | 0.45 | 96.41 |
| 40 | UCO Bank Apps | 0.38 | 132.77 | 0.00 | 0.00 | 0.00 | 0.00 | 0.00 | 0.00 | 0.38 | 132.77 |
| 41 | Indian Bank Apps | 0.33 | 88.52 | 0.00 | 0.00 | 0.00 | 3.17 | 0.00 | 0.00 | 0.33 | 91.69 |
| 42 | Bank of India Apps | 0.29 | 85.09 | 0.00 | 0.00 | 0.00 | 0.00 | 0.00 | 0.00 | 0.29 | 85.09 |
| 43 | South Indian Bank Apps | 0.28 | 77.42 | 0.00 | 0.00 | 0.00 | 0.00 | 0.00 | 0.00 | 0.28 | 77.42 |
| 44 | Fino Payments bank Apps | 0.21 | 15.43 | 0.00 | 0.00 | 0.00 | 0.00 | 0.00 | 0.00 | 0.21 | 15.43 |
| 45 | HSBC Bank Apps | 0.17 | 98.09 | 0.00 | 0.10 | 0.00 | 0.00 | 0.00 | 0.00 | 0.17 | 98.19 |
| 46 | BPAYWALLET | 0.15 | 32.07 | 0.00 | 0.00 | 0.00 | 0.00 | 0.00 | 0.00 | 0.15 | 32.07 |
| 47 | Fave | 0.12 | 7.54 | 0.00 | 0.00 | 0.00 | 0.00 | 0.00 | 0.00 | 0.12 | 7.54 |
| 48 | TataNeu | 0.10 | 16.09 | 0.00 | 0.00 | 0.00 | 0.00 | 0.00 | 0.00 | 0.10 | 16.09 |
| 49 | Tamilnad Mercantile Bank Apps | 0.10 | 25.45 | 0.00 | 0.00 | 0.00 | 0.00 | 0.00 | 0.00 | 0.10 | 25.45 |
| 50 | Ultracash | 0.09 | 6.17 | 0.00 | 0.00 | 0.00 | 0.00 | 0.00 | 0.00 | 0.09 | 6.17 |
| 51 | Citi Bank Apps | 0.08 | 58.11 | 0.00 | 0.00 | 0.00 | 0.00 | 0.00 | 0.00 | 0.08 | 58.11 |
| 52 | Indian Overseas Bank Apps | 0.07 | 19.01 | 0.00 | 0.00 | 0.00 | 0.00 | 0.00 | 0.00 | 0.07 | 19.01 |
| 53 | City Union Bank Apps | 0.07 | 19.79 | 0.00 | 0.00 | 0.00 | 0.00 | 0.00 | 0.00 | 0.07 | 19.79 |
| 54 | IDBI Bank Apps | 0.06 | 31.69 | 0.00 | 0.00 | 0.00 | 0.00 | 0.00 | 0.00 | 0.06 | 31.69 |
| 55 | INDIE | 0.05 | 12.60 | 0.00 | 0.00 | 0.00 | 0.00 | 0.00 | 0.00 | 0.05 | 12.60 |
| 56 | Bank of Maharashtra Apps | 0.05 | 8.18 | 0.00 | 0.00 | 0.00 | 0.00 | 0.00 | 0.00 | 0.05 | 8.18 |
| 57 | Karur Vysya Bank Apps | 0.05 | 16.11 | 0.00 | 0.00 | 0.00 | 0.00 | 0.00 | 0.00 | 0.05 | 16.11 |
| 58 | MakeMyTrip | 0.04 | 20.49 | 0.00 | 0.00 | 0.00 | 0.00 | 0.00 | 0.00 | 0.04 | 20.49 |
| 59 | Shriram One | 0.04 | 2.33 | 0.00 | 0.00 | 0.00 | 0.00 | 0.00 | 0.00 | 0.04 | 2.33 |
| 60 | Equitas Small Finance Bank Apps | 0.03 | 19.23 | 0.00 | 0.00 | 0.00 | 0.00 | 0.00 | 0.00 | 0.03 | 19.23 |
| 61 | NSDL Payments Bank Apps | 0.03 | 5.39 | 0.00 | 0.00 | 0.00 | 0.00 | 0.00 | 0.00 | 0.03 | 5.39 |
| 62 | Allahabad Bank Apps | 0.03 | 7.81 | 0.00 | 0.00 | 0.00 | 0.00 | 0.00 | 0.00 | 0.03 | 7.81 |
| 63 | Punjab Sind Bank Apps | 0.03 | 12.74 | 0.00 | 0.00 | 0.00 | 0.00 | 0.00 | 0.00 | 0.03 | 12.74 |
| 64 | DHANI | 0.03 | 4.20 | 0.00 | 0.00 | 0.00 | 0.00 | 0.00 | 0.00 | 0.03 | 4.20 |
| 65 | Utkarsh Small Finance Bank Apps | 0.02 | 6.67 | 0.00 | 0.00 | 0.00 | 0.00 | 0.00 | 0.00 | 0.02 | 6.67 |
| 66 | Jammu and Kashmir Bank Apps | 0.01 | 2.80 | 0.00 | 0.00 | 0.00 | 0.00 | 0.00 | 0.00 | 0.01 | 2.80 |
| 67 | DIGIKHATA | 0.01 | 3.81 | 0.00 | 0.00 | 0.00 | 0.00 | 0.00 | 0.00 | 0.01 | 3.81 |
| 68 | ZOICICI | 0.01 | 1.00 | 0.00 | 0.00 | 0.00 | 0.00 | 0.00 | 0.00 | 0.01 | 1.00 |
| 69 | Dhanlaxmi Bank Apps | 0.01 | 3.02 | 0.00 | 0.00 | 0.00 | 0.00 | 0.00 | 0.00 | 0.01 | 3.02 |
| 70 | GoIbibo | 0.01 | 2.99 | 0.00 | 0.00 | 0.00 | 0.00 | 0.00 | 0.00 | 0.01 | 2.99 |
| 71 | SURYODAY | 0.01 | 0.03 | 0.00 | 0.00 | 0.00 | 0.00 | 0.00 | 0.00 | 0.01 | 0.03 |
| 72 | Bandhan Bank Apps | 0.01 | 0.87 | 0.00 | 0.00 | 0.00 | 0.00 | 0.00 | 0.00 | 0.01 | 0.87 |
| 73 | Others | 0.03 | 8.45 | 0.00 | 0.00 | 0.00 | 0.01 | 0.00 | 0.00 | 0.03 | 8.46 |
Note:-
| UPI P2P and P2M Transactions | ||||||
|---|---|---|---|---|---|---|
| Month | Total | P2P | P2M | |||
| Volume (Mn) | Value (Cr) | Volume (Mn) | Value (Cr) | Volume (Mn) | Value (Cr) | |
| Aug'23 | 10,586.02 | 15,76,536.56 | 4,388.83 | 11,79,095.66 | 6,197.18 | 3,97,440.90 |

| UPI Payer PSP Performance (Aug'23) | |||||
|---|---|---|---|---|---|
| Sr. No. | Payer PSP | Total Volume (In Mn) | Approved % | BD % | TD % |
| 1 | Yes Bank Ltd | 3548.89 | 98.62% | 1.38% | 0.00% |
| 2 | Axis Bank Ltd | 1984.84 | 98.49% | 1.51% | 0.00% |
| 3 | ICICI Bank | 1834.95 | 98.57% | 1.43% | 0.00% |
| 4 | Paytm Payments Bank | 1386.27 | 98.50% | 1.49% | 0.00% |
| 5 | State Bank Of India | 985.73 | 98.40% | 1.60% | 0.00% |
| 6 | HDFC Bank Ltd | 885.37 | 98.59% | 1.41% | 0.00% |
| 7 | BHIM | 26.23 | 93.82% | 6.16% | 0.01% |
| 8 | Kotak Mahindra Bank | 21.56 | 98.18% | 1.82% | 0.00% |
| 9 | Fampay (PPI) | 20.57 | 98.54% | 1.45% | 0.01% |
| 10 | Airtel Payments Bank | 10.46 | 97.53% | 2.42% | 0.05% |
| 11 | Federal Bank | 5.82 | 98.06% | 1.93% | 0.01% |
| 12 | India Post Payment Bank | 5.64 | 98.45% | 1.55% | 0.00% |
| 13 | IDFC FIRST Bank | 4.66 | 97.92% | 2.07% | 0.01% |
| 14 | Standard Chartered | 3.60 | 99.78% | 0.22% | 0.00% |
| 15 | RBL Bank | 2.45 | 98.32% | 1.67% | 0.01% |
| UPI Payee PSP Performance (Aug'23) | |||||
|---|---|---|---|---|---|
| Sr. No. | Payee PSP | Total Volume (In Mn) | Approved % | BD % | TD % |
| 1 | Yes Bank Ltd | 3608.70 | 99.67% | 0.32% | 0.01% |
| 2 | Paytm Payments Bank | 2657.59 | 99.66% | 0.33% | 0.01% |
| 3 | ICICI Bank | 1215.47 | 99.41% | 0.58% | 0.01% |
| 4 | Axis Bank Ltd | 1146.11 | 99.33% | 0.61% | 0.06% |
| 5 | HDFC Bank Ltd | 599.32 | 99.03% | 0.79% | 0.18% |
| 6 | State Bank Of India | 497.09 | 99.39% | 0.53% | 0.08% |
| 7 | Federal Bank | 181.99 | 97.48% | 2.04% | 0.48% |
| 8 | IndusInd Bank | 52.28 | 94.70% | 3.90% | 1.40% |
| 9 | Kotak Mahindra Bank | 35.56 | 99.04% | 0.59% | 0.38% |
| 10 | IDFC FIRST Bank | 30.81 | 99.12% | 0.59% | 0.29% |
| 11 | Indian Bank | 24.28 | 99.61% | 0.27% | 0.12% |
| 12 | Fino Payments Bank | 16.15 | 99.60% | 0.34% | 0.06% |
| 13 | Canara Bank | 15.27 | 99.66% | 0.31% | 0.02% |
| 14 | Airtel Payments Bank | 14.99 | 99.38% | 0.12% | 0.50% |
| 15 | Cosmos Bank | 14.61 | 97.14% | 2.14% | 0.72% |
| UPI Merchant Category-wise Classification - August'23 (Arranged by Volume) | ||||
|---|---|---|---|---|
| Type | MCC | Description | Volume (in Mn) | Value (in Cr.) |
| High Transacting Categories | 5411 | Groceries and supermarkets | 1,189.24 | 32,386.44 |
| 5812 | Eating places and restaurants | 760.64 | 12,217.60 | |
| 4814 | Telecommunication services, including local and long distance calls, credit card calls, calls through use of magnetic stripe reading telephones and faxes | 541.23 | 11,579.79 | |
| 5814 | Fast food restaurants | 400.27 | 5,071.20 | |
| 5311 | Department stores | 381.99 | 7,619.69 | |
| 5541 | Service stations (with or without ancillary services) | 303.64 | 18,309.84 | |
| 5816 | Digital Goods: Games | 241.73 | 8,970.19 | |
| 5912 | Drug stores and pharmacies | 165.90 | 6,104.89 | |
| 5462 | Bakeries | 138.79 | 2,013.94 | |
| 4900 | Utilities electric, gas, water and sanitary | 90.80 | 11,660.11 | |
| Medium Transacting Categories | 5813 | Drinking places (alcoholic beverages) bars, taverns, night-clubs, cocktail lounges and discothques | 88.77 | 3,235.33 |
| 5451 | Dairies | 85.97 | 1,731.81 | |
| 6540 | Debit card to wallet credit (Wallet top up) | 80.90 | 5,620.39 | |
| 7299 | Miscellaneous personal services not elsewhere classified | 78.22 | 2,710.43 | |
| 7322 | Debt collection agencies | 68.19 | 57,104.10 | |
| 6012 | Financial institutions merchandise and services | 60.68 | 14,586.77 | |
| 5137 | Mens, womens and childrens uniforms and commercial clothing | 45.79 | 4,500.10 | |
| 5441 | Candy, nut and confectionery shops | 45.71 | 838.21 | |
| 5399 | Miscellaneous general merchandise | 45.22 | 4,316.64 | |
| 5993 | Cigar shops and stands | 43.24 | 331.55 | |
| All Other Categories | 5732 | Electronics shops | 42.06 | 5,246.30 |
| 7230 | Beauty and barber shops | 38.14 | 1,114.86 | |
| 5422 | Freezer and locker meat provisioners | 37.21 | 1,168.37 | |
| 6211 | Securities brokers and dealers | 35.36 | 29,618.61 | |
| 5722 | Household appliance shops | 35.32 | 3,311.80 | |
| 9399 | Government services not elsewhere classified | 34.93 | 4,213.05 | |
| 5943 | Stationery, office and school supply shops | 31.43 | 939.13 | |
| 4121 | Taxi-cabs and limousines | 31.31 | 698.26 | |
| 4899 | Cable and other pay television services | 29.19 | 1,199.46 | |
| Others | 1,025.29 | 1,39,022.04 | ||
| Total | 6,197.18 | 3,97,440.90 | ||
| State-wise UPI Product Statistics* (Aug'23) | |||||
|---|---|---|---|---|---|
| Sr. No. | State / Union Territory | Volume (in Mn ) | Volume Contribution (%) | Value (in Cr.) | Value Contribution (%) |
| 1 | MAHARASHTRA | 2,119.31 | 20.02% | 2,82,946.53 | 17.95% |
| 2 | KARNATAKA | 924.36 | 8.73% | 1,26,876.33 | 8.05% |
| 3 | TELANGANA | 753.64 | 7.12% | 1,27,817.82 | 8.11% |
| 4 | UTTAR PRADESH | 678.37 | 6.41% | 94,133.08 | 5.97% |
| 5 | TAMIL NADU | 511.03 | 4.83% | 84,388.17 | 5.35% |
| 6 | MADHYA PRADESH | 502.80 | 4.75% | 67,895.74 | 4.31% |
| 7 | RAJASTHAN | 459.93 | 4.34% | 69,380.56 | 4.40% |
| 8 | DELHI | 404.03 | 3.82% | 52,953.64 | 3.36% |
| 9 | ANDHRA PRADESH | 349.58 | 3.30% | 69,909.85 | 4.43% |
| 10 | GUJARAT | 325.34 | 3.07% | 51,778.19 | 3.28% |
| 11 | BIHAR | 307.74 | 2.91% | 47,814.69 | 3.03% |
| 12 | WEST BENGAL | 286.09 | 2.70% | 48,819.44 | 3.10% |
| 13 | HARYANA | 255.90 | 2.42% | 38,322.05 | 2.43% |
| 14 | KERALA | 249.36 | 2.36% | 37,438.70 | 2.37% |
| 15 | ODISHA | 220.05 | 2.08% | 30,594.38 | 1.94% |
| 16 | PUNJAB | 147.14 | 1.39% | 24,812.53 | 1.57% |
| 17 | ASSAM | 105.93 | 1.00% | 15,516.16 | 0.98% |
| 18 | JHARKHAND | 104.67 | 0.99% | 14,547.31 | 0.92% |
| 19 | CHHATTISGARH | 97.25 | 0.92% | 12,772.92 | 0.81% |
| 20 | UTTARAKHAND | 81.71 | 0.77% | 10,706.66 | 0.68% |
| 21 | HIMACHAL PRADESH | 35.23 | 0.33% | 4,698.18 | 0.30% |
| 22 | JAMMU AND KASHMIR | 34.80 | 0.33% | 5,283.63 | 0.34% |
| 23 | CHANDIGARH | 21.26 | 0.20% | 2,829.23 | 0.18% |
| 24 | GOA | 20.95 | 0.20% | 2,970.56 | 0.19% |
| 25 | PUDUCHERRY | 11.56 | 0.11% | 1,708.52 | 0.11% |
| 26 | ARUNACHAL PRADESH | 8.78 | 0.08% | 1,434.45 | 0.09% |
| 27 | TRIPURA | 6.75 | 0.06% | 1,123.71 | 0.07% |
| 28 | DADRA & NAGAR HAVELI & DAMAN & DIU | 6.23 | 0.06% | 698.87 | 0.04% |
| 29 | MEGHALAYA | 6.11 | 0.06% | 1,098.18 | 0.07% |
| 30 | NAGALAND | 5.50 | 0.05% | 1,245.07 | 0.08% |
| 31 | MIZORAM | 4.27 | 0.04% | 939.12 | 0.06% |
| 32 | SIKKIM | 3.87 | 0.04% | 644.83 | 0.04% |
| 33 | MANIPUR | 2.29 | 0.02% | 770.73 | 0.05% |
| 34 | LADAKH | 2.05 | 0.02% | 480.89 | 0.03% |
| 35 | ANDAMAN & NICOBAR | 1.84 | 0.02% | 338.88 | 0.02% |
| 36 | LAKSHADWEEP | 0.11 | 0.00% | 23.10 | 0.00% |
| 37 | UNCLASSIFIED# | 1,530.17 | 14.45% | 2,40,823.86 | 15.28% |
| UPI Remitter Banks - Top 50 Banks (Jul'23) | |||||||
|---|---|---|---|---|---|---|---|
| Sr. No. | UPI Remitter Banks (Jul-2023) | Total Volume (In Mn) | Approved % | BD % | TD% | Total Debit Reversal Count (In Mn) | Debit Reversal Success % |
| 1 | State Bank Of India | 2574.67 | 95.55% | 4.27% | 0.17% | 8.675316 | 99.41% |
| 2 | HDFC BANK LTD | 879.56 | 96.30% | 3.59% | 0.11% | 2.233976 | 100.00% |
| 3 | Bank of Baroda | 645.14 | 94.64% | 5.21% | 0.15% | 2.143761 | 99.73% |
| 4 | Union Bank of India | 616.05 | 95.63% | 4.35% | 0.01% | 1.726157 | 100.00% |
| 5 | Punjab National Bank | 480.73 | 95.29% | 4.47% | 0.24% | 1.605735 | 100.00% |
| 6 | ICICI Bank | 481.53 | 96.70% | 3.27% | 0.03% | 1.303102 | 92.77% |
| 7 | Axis Bank Ltd. | 462.20 | 96.34% | 3.65% | 0.01% | 1.059541 | 100.00% |
| 8 | Kotak Mahindra Bank | 460.81 | 94.83% | 5.13% | 0.04% | 1.303627 | 100.00% |
| 9 | Canara Bank | 454.62 | 94.32% | 4.97% | 0.71% | 2.063598 | 99.39% |
| 10 | Paytm Payments Bank | 433.01 | 96.43% | 3.55% | 0.02% | 0.623114 | 100.00% |
| 11 | Bank of India | 322.25 | 95.72% | 4.14% | 0.13% | 0.868259 | 100.00% |
| 12 | Indian Bank | 276.75 | 93.27% | 4.86% | 1.86% | 1.220299 | 100.00% |
| 13 | Airtel Payments Bank | 224.92 | 90.33% | 8.55% | 1.12% | 0.222457 | 99.96% |
| 14 | India Post Payment Bank | 175.71 | 84.45% | 11.40% | 4.15% | 0.788979 | 85.56% |
| 15 | Federal Bank | 154.12 | 95.07% | 4.68% | 0.25% | 0.402231 | 100.00% |
| 16 | Central Bank Of India | 154.10 | 89.55% | 8.65% | 1.80% | 1.253073 | 100.00% |
| 17 | Indian Overseas Bank | 132.05 | 92.31% | 4.50% | 3.19% | 0.977749 | 100.00% |
| 18 | UCO Bank | 120.45 | 94.51% | 4.88% | 0.61% | 0.397799 | 100.00% |
| 19 | IDBI Bank Limited | 118.46 | 95.57% | 3.78% | 0.65% | 0.446276 | 99.98% |
| 20 | Bank of Maharashtra | 111.27 | 91.99% | 6.38% | 1.63% | 0.388401 | 100.00% |
| 21 | INDUSIND BANK | 97.54 | 94.25% | 5.44% | 0.31% | 0.382963 | 99.16% |
| 22 | Fino Payments Bank Limited FIP | 90.80 | 79.40% | 15.40% | 5.21% | 0.526504 | 64.03% |
| 23 | Yes Bank Ltd | 85.79 | 95.53% | 4.30% | 0.17% | 0.161788 | 100.00% |
| 24 | Karnataka Bank | 80.33 | 92.53% | 5.69% | 1.77% | 0.198716 | 100.00% |
| 25 | Karur Vysya Bank | 50.34 | 92.87% | 6.11% | 1.02% | 0.166862 | 100.00% |
| 26 | Bandhan Bank | 41.14 | 90.79% | 9.16% | 0.05% | 0.144404 | 100.00% |
| 27 | South Indian Bank | 40.23 | 95.41% | 4.49% | 0.11% | 0.076772 | 99.27% |
| 28 | IDFC FIRST Bank | 60.28 | 93.93% | 5.63% | 0.43% | 0.129183 | 99.79% |
| 29 | Jammu and Kashmir Bank | 31.04 | 91.74% | 6.44% | 1.82% | 0.035887 | 99.71% |
| 30 | City Union Bank | 29.80 | 93.47% | 6.29% | 0.24% | 0.084771 | 100.00% |
| 31 | Ujjivan Small Finance Bank | 29.03 | 93.93% | 5.73% | 0.34% | 0.089636 | 100.00% |
| 32 | AU small Finance Bank | 28.65 | 95.49% | 4.39% | 0.12% | 0.098094 | 99.97% |
| 33 | Tamilnad Mercantile Bank | 25.91 | 94.17% | 5.79% | 0.04% | 0.052471 | 100.00% |
| 34 | Equitas Bank | 25.64 | 90.10% | 8.75% | 1.14% | 0.092811 | 98.98% |
| 35 | Standard Chartered | 25.48 | 96.92% | 2.41% | 0.68% | 0.074502 | 100.00% |
| 36 | Punjab and Sind Bank | 25.31 | 89.04% | 8.36% | 2.60% | 0.127147 | 100.00% |
| 37 | DBS Bank India Limited | 23.19 | 95.78% | 3.98% | 0.25% | 0.049484 | 100.00% |
| 38 | Andhra Pradesh Grameena Vikas Bank | 20.75 | 84.92% | 12.33% | 2.75% | 0.051766 | 100.00% |
| 39 | Pragathi Krishna Gramin Bank | 20.14 | 85.92% | 10.66% | 3.42% | 0.052157 | 100.00% |
| 40 | Citibank | 19.10 | 95.95% | 3.31% | 0.75% | 0.112173 | 100.00% |
| 41 | Maharashtra Gramin Bank | 19.04 | 79.69% | 12.11% | 8.20% | 0.066891 | 99.96% |
| 42 | Kerala Gramin Bank | 18.76 | 91.27% | 8.30% | 0.43% | 0.051573 | 99.70% |
| 43 | Saraswat Bank | 17.71 | 95.29% | 3.55% | 1.15% | 0.056245 | 100.00% |
| 44 | Tri O Tech Solutions Private Limited | 16.79 | 100.00% | 0.00% | 0.00% | 0.048366 | 100.00% |
| 45 | Rajasthan Marudhara Gramin Bank | 16.19 | 83.07% | 12.32% | 4.61% | 0 | NA |
| 46 | ESAF Small Finance Bank Ltd. | 15.21 | 93.39% | 5.61% | 0.99% | 0.053937 | 100.00% |
| 47 | Baroda UP Gramin Bank | 13.14 | 83.94% | 8.79% | 7.27% | 0.038648 | 100.00% |
| 48 | Sarva Haryana Gramin Bank | 12.94 | 91.54% | 6.82% | 1.64% | 0.09829 | 99.90% |
| 49 | RBL Bank | 12.63 | 92.83% | 6.14% | 1.03% | 0.045407 | 99.95% |
| 50 | Andhra Pragathi Grameena Bank | 12.20 | 75.58% | 15.17% | 9.25% | 0.065589 | 97.24% |
| UPI Beneficiary Banks - Top 50 Banks (Jul'23) | |||||||
|---|---|---|---|---|---|---|---|
| Sr.No. | UPI Beneficiary Banks (Jul-2023) | Total Volume (In Mn) | Approved % | BD% | TD% | Deemed Approved % | |
| 1 | Paytm Payments Bank | 2331.83 | 99.82% | 0.17% | 0.01% | 0.00% | |
| 2 | Yes Bank Ltd | 1865.76 | 99.87% | 0.02% | 0.11% | 0.03% | |
| 3 | State Bank Of India | 1070.51 | 99.24% | 0.18% | 0.58% | 0.06% | |
| 4 | Axis Bank Ltd. | 688.05 | 99.89% | 0.09% | 0.02% | 0.04% | |
| 5 | ICICI Bank | 627.95 | 99.79% | 0.10% | 0.12% | 0.05% | |
| 6 | HDFC BANK LTD | 510.54 | 99.27% | 0.65% | 0.08% | 0.03% | |
| 7 | Bank of Baroda | 290.12 | 99.58% | 0.25% | 0.17% | 0.14% | |
| 8 | Union Bank of India | 279.02 | 99.76% | 0.15% | 0.08% | 0.03% | |
| 9 | Federal Bank | 229.06 | 99.66% | 0.23% | 0.11% | 0.01% | |
| 10 | Canara Bank | 223.29 | 98.89% | 0.43% | 0.68% | 0.23% | |
| 11 | Punjab National Bank | 222.99 | 99.37% | 0.42% | 0.20% | 0.19% | |
| 12 | Kotak Mahindra Bank | 200.84 | 98.30% | 1.48% | 0.22% | 0.06% | |
| 13 | Bank of India | 155.21 | 99.70% | 0.22% | 0.08% | 0.03% | |
| 14 | Indian Bank | 149.29 | 98.54% | 0.36% | 1.10% | 0.44% | |
| 15 | Airtel Payments Bank | 124.06 | 98.89% | 0.38% | 0.73% | 0.46% | |
| 16 | INDUSIND BANK | 96.57 | 99.32% | 0.19% | 0.49% | 0.14% | |
| 17 | India Post Payment Bank | 78.07 | 97.79% | 0.43% | 1.78% | 0.35% | |
| 18 | Central Bank Of India | 76.44 | 98.38% | 0.57% | 1.06% | 0.48% | |
| 19 | Indian Overseas Bank | 63.85 | 97.51% | 0.31% | 2.17% | 0.83% | |
| 20 | UCO Bank | 57.89 | 98.86% | 0.68% | 0.47% | 0.12% | |
| 21 | IDBI Bank Limited | 54.70 | 99.09% | 0.39% | 0.52% | 0.10% | |
| 22 | IDFC FIRST Bank | 49.55 | 98.41% | 1.00% | 0.59% | 0.21% | |
| 23 | Bank of Maharashtra | 44.04 | 98.21% | 0.21% | 1.58% | 0.27% | |
| 24 | Fino Payments Bank Limited FIP | 41.98 | 95.42% | 1.11% | 3.47% | 0.28% | |
| 25 | Karnataka Bank | 36.16 | 97.50% | 0.72% | 1.78% | 0.17% | |
| 26 | Karur Vysya Bank | 28.69 | 98.69% | 0.43% | 0.88% | 0.14% | |
| 27 | South Indian Bank | 26.01 | 99.71% | 0.22% | 0.06% | 0.01% | |
| 28 | Bandhan Bank | 24.42 | 99.41% | 0.09% | 0.49% | 0.05% | |
| 29 | RBL Bank | 22.99 | 99.56% | 0.30% | 0.14% | 0.08% | |
| 30 | AU small Finance Bank | 20.30 | 98.32% | 1.60% | 0.08% | 0.02% | |
| 31 | Tamilnad Mercantile Bank | 16.44 | 99.76% | 0.15% | 0.09% | 0.02% | |
| 32 | City Union Bank | 16.17 | 98.67% | 0.90% | 0.43% | 0.10% | |
| 33 | Ujjivan Small Finance Bank | 15.43 | 99.34% | 0.30% | 0.36% | 0.16% | |
| 34 | Jammu and Kashmir Bank | 14.39 | 98.52% | 0.32% | 1.16% | 0.11% | |
| 35 | Equitas Small Finance Bank | 11.99 | 97.20% | 2.08% | 0.72% | 0.08% | |
| 36 | Punjab and Sind Bank | 11.66 | 97.74% | 0.18% | 2.08% | 0.24% | |
| 37 | Kerala Gramin Bank | 10.91 | 99.48% | 0.20% | 0.32% | 0.26% | |
| 38 | CITI Bank | 10.78 | 99.85% | 0.00% | 0.15% | 0.12% | |
| 39 | Pragathi Krishna Gramin Bank | 10.70 | 97.33% | 0.35% | 2.32% | 0.62% | |
| 40 | Andhra Pradesh Grameena Vikas Bank | 9.66 | 97.69% | 0.25% | 2.05% | 0.36% | |
| 41 | DBS Bank India Limited | 9.44 | 98.38% | 1.25% | 0.37% | 0.15% | |
| 42 | Maharashtra Gramin Bank | 8.96 | 93.62% | 0.46% | 5.92% | 0.49% | |
| 43 | Tri O Tech Solutions Private Limited | 8.46 | 93.56% | 6.12% | 0.32% | 0.04% | |
| 44 | Baroda UP Gramin Bank | 8.28 | 93.30% | 0.74% | 5.97% | 1.60% | |
| 45 | Rajasthan Marudhara Gramin Bank | 8.20 | 96.29% | 0.45% | 3.27% | 0.29% | |
| 46 | ESAF Small Finance Bank Ltd. | 8.14 | 99.27% | 0.04% | 0.69% | 0.30% | |
| 47 | Andhra Pragathi Grameena Bank | 6.71 | 88.20% | 0.43% | 11.38% | 0.31% | |
| 48 | Saraswat Bank | 6.64 | 98.11% | 0.18% | 1.72% | 0.20% | |
| 49 | Sarva Haryana Gramin Bank | 6.08 | 98.26% | 0.48% | 1.26% | 0.19% | |
| 50 | Baroda Rajasthan Kshetriya Gramin Bank | 5.45 | 92.90% | 2.40% | 4.70% | 0.84% | |
| UPI Apps (Jul'23) | |||||||||||
|---|---|---|---|---|---|---|---|---|---|---|---|
| Sr.No. | Application Name | Customer Initiated Transactions | B2C Transactions | B2B Transactions | On-us Transactions | Total | |||||
| Volume (Mn) | Value (Cr) | Volume (Mn) | Value (Cr) | Volume (Mn) | Value (Cr) | Volume (Mn) | Value (Cr) | Volume (Mn) | Value (Cr) | ||
| 1 | PhonePe | 4743.66 | 761247.87 | 0.00 | 0.00 | 0.00 | 0.00 | 4743.66 | 761247.87 | ||
| 2 | Google Pay | 3494.64 | 518095.10 | 0.00 | 0.00 | 0.00 | 0.00 | 3494.64 | 518095.10 | ||
| 3 | Paytm Payments Bank App | 1278.96 | 147723.30 | 1.40 | 4.19 | 0.57 | 887.53 | 112.74 | 22152.33 | 1393.66 | 170767.35 |
| 4 | Cred | 80.34 | 30999.71 | 0.00 | 0.00 | 0.00 | 0.00 | 80.34 | 30999.71 | ||
| 5 | Axis Bank Apps | 9.77 | 1767.83 | 54.52 | 1447.04 | 0.01 | 2.16 | 64.30 | 3217.03 | ||
| 6 | Amazon Pay | 57.60 | 6163.84 | 0.00 | 0.00 | 0.00 | 0.00 | 57.60 | 6163.84 | ||
| 7 | ICICI Bank Apps | 24.47 | 8077.88 | 4.14 | 312.80 | 7.31 | 9379.69 | 35.92 | 17770.37 | ||
| 8 | Yes Bank Apps | 31.53 | 11419.73 | 0.00 | 0.00 | 0.48 | 83.07 | 32.01 | 11502.79 | ||
| 9 | BHIM | 24.94 | 8244.91 | 0.00 | 0.00 | 0.00 | 0.00 | 24.94 | 8244.91 | ||
| 10 | Kotak Mahindra Bank Apps | 18.56 | 3480.59 | 0.00 | 0.00 | 0.00 | 0.01 | 18.56 | 3480.60 | ||
| 11 | 17.84 | 1598.67 | 0.00 | 0.00 | 0.00 | 0.00 | 17.84 | 1598.67 | |||
| 12 | HDFC Bank Apps | 17.77 | 4410.51 | 0.00 | 0.00 | 0.00 | 0.00 | 17.77 | 4410.51 | ||
| 13 | Fampay | 16.79 | 206.43 | 0.00 | 0.00 | 0.00 | 0.00 | 16.79 | 206.43 | ||
| 14 | Bajaj Finserv | 12.11 | 1740.97 | 0.00 | 0.00 | 0.00 | 0.00 | 12.11 | 1740.97 | ||
| 15 | Airtel Payments Bank Apps | 9.65 | 665.97 | 0.00 | 0.00 | 0.00 | 0.01 | 0.00 | 0.07 | 9.65 | 666.04 |
| 16 | Samsung Pay | 5.81 | 544.13 | 0.00 | 0.00 | 0.00 | 0.00 | 5.81 | 544.13 | ||
| 17 | India Post Payments Bank Apps | 5.43 | 587.75 | 0.00 | 0.00 | 0.00 | 0.00 | 5.43 | 587.75 | ||
| 18 | Federal Bank Apps | 5.19 | 665.11 | 0.00 | 0.00 | 0.00 | 0.00 | 5.19 | 665.11 | ||
| 19 | State Bank of India Apps | 4.99 | 2094.63 | 0.00 | 0.00 | 0.02 | 0.52 | 5.01 | 2095.15 | ||
| 20 | IDFC Bank Apps | 4.17 | 1121.41 | 0.00 | 0.00 | 0.00 | 0.00 | 4.17 | 1121.41 | ||
| 21 | Standard Chartered Bank Apps | 3.54 | 1606.29 | 0.00 | 0.00 | 0.60 | 523.09 | 4.14 | 2129.38 | ||
| 22 | Mobikwik | 3.79 | 1140.63 | 0.00 | 0.00 | 0.00 | 0.00 | 3.79 | 1140.63 | ||
| 23 | Jupiter | 3.27 | 466.39 | 0.00 | 0.00 | 0.00 | 0.00 | 3.27 | 466.39 | ||
| 24 | Groww | 2.81 | 2075.98 | 0.00 | 0.00 | 0.00 | 0.00 | 2.81 | 2075.98 | ||
| 25 | Deutsche Bank Apps | 1.83 | 175.50 | 0.00 | 0.00 | 0.00 | 0.02 | 1.83 | 175.52 | ||
| 26 | Canara Bank Apps | 1.73 | 514.02 | 0.00 | 0.00 | 0.00 | 0.00 | 1.73 | 514.02 | ||
| 27 | Kiwi | 1.53 | 52.51 | 0.00 | 0.00 | 0.00 | 0.00 | 1.53 | 52.51 | ||
| 28 | Bank of Baroda Apps | 1.34 | 477.16 | 0.00 | 0.00 | 0.00 | 0.00 | 1.34 | 477.16 | ||
| 29 | Jio Payments Bank Apps | 1.34 | 114.12 | 0.00 | 0.00 | 0.00 | 0.00 | 1.34 | 114.12 | ||
| 30 | RBL Bank Apps | 1.13 | 523.22 | 0.00 | 0.01 | 0.14 | 6.35 | 1.28 | 529.58 | ||
| 31 | slice | 0.94 | 301.00 | 0.00 | 0.00 | 0.00 | 0.00 | 0.94 | 301.00 | ||
| 32 | Union Bank Apps | 0.88 | 349.19 | 0.00 | 0.00 | 0.00 | 0.00 | 0.88 | 349.19 | ||
| 33 | IndusInd Bank Apps | 0.84 | 723.32 | 0.00 | 0.00 | 0.00 | 0.00 | 0.84 | 723.32 | ||
| 34 | Punjab National Bank Apps | 0.79 | 181.50 | 0.00 | 0.00 | 0.00 | 0.00 | 0.79 | 181.50 | ||
| 35 | AU Small Finance Bank Apps | 0.68 | 209.86 | 0.00 | 0.00 | 0.00 | 0.00 | 0.68 | 209.86 | ||
| 36 | Omnicard | 0.62 | 19.49 | 0.00 | 0.00 | 0.00 | 0.00 | 0.62 | 19.49 | ||
| 37 | Karnataka Bank Apps | 0.61 | 124.34 | 0.00 | 0.00 | 0.00 | 0.00 | 0.61 | 124.34 | ||
| 38 | DBS Digibank Apps | 0.44 | 179.34 | 0.00 | 0.00 | 0.00 | 0.37 | 0.44 | 179.72 | ||
| 39 | Central Bank of India Apps | 0.44 | 97.52 | 0.00 | 0.00 | 0.00 | 0.23 | 0.44 | 97.75 | ||
| 40 | UCO Bank Apps | 0.36 | 116.31 | 0.00 | 0.00 | 0.00 | 0.00 | 0.36 | 116.31 | ||
| 41 | Indian Bank Apps | 0.31 | 92.29 | 0.00 | 0.00 | 0.00 | 0.35 | 0.31 | 92.64 | ||
| 42 | South Indian Bank Apps | 0.25 | 73.83 | 0.00 | 0.00 | 0.00 | 0.00 | 0.25 | 73.83 | ||
| 43 | Bank of India Apps | 0.25 | 78.83 | 0.00 | 0.00 | 0.00 | 0.00 | 0.25 | 78.83 | ||
| 44 | Fino Payments bank Apps | 0.17 | 13.36 | 0.00 | 0.00 | 0.00 | 0.00 | 0.17 | 13.36 | ||
| 45 | HSBC Bank Apps | 0.16 | 96.44 | 0.00 | 0.08 | 0.00 | 0.00 | 0.16 | 96.52 | ||
| 46 | Fave | 0.12 | 7.56 | 0.00 | 0.00 | 0.00 | 0.00 | 0.12 | 7.56 | ||
| 47 | Bajaj Finserv PPI | 0.11 | 25.80 | 0.00 | 0.00 | 0.00 | 0.00 | 0.11 | 25.80 | ||
| 48 | TataNeu | 0.10 | 16.70 | 0.00 | 0.00 | 0.00 | 0.00 | 0.10 | 16.70 | ||
| 49 | Tamilnad Mercantile Bank Apps | 0.10 | 23.50 | 0.00 | 0.00 | 0.00 | 0.00 | 0.10 | 23.50 | ||
| 50 | IDBI Bank Apps | 0.07 | 37.40 | 0.00 | 0.00 | 0.00 | 0.00 | 0.07 | 37.40 | ||
| 51 | Citi Bank Apps | 0.07 | 61.36 | 0.00 | 0.00 | 0.00 | 0.00 | 0.07 | 61.36 | ||
| 52 | Ultracash | 0.07 | 5.01 | 0.00 | 0.00 | 0.00 | 0.00 | 0.07 | 5.01 | ||
| 53 | City Union Bank Apps | 0.07 | 20.96 | 0.00 | 0.00 | 0.00 | 0.00 | 0.07 | 20.96 | ||
| 54 | Indian Overseas Bank Apps | 0.07 | 18.01 | 0.00 | 0.00 | 0.00 | 0.00 | 0.07 | 18.01 | ||
| 55 | Karur Vysya Bank Apps | 0.04 | 16.34 | 0.00 | 0.00 | 0.00 | 0.00 | 0.04 | 16.34 | ||
| 56 | MakeMyTrip | 0.04 | 19.92 | 0.00 | 0.00 | 0.00 | 0.00 | 0.04 | 19.92 | ||
| 57 | Dhani | 0.03 | 7.81 | 0.00 | 0.00 | 0.00 | 0.00 | 0.03 | 7.81 | ||
| 58 | Equitas Small Finance Bank Apps | 0.03 | 18.90 | 0.00 | 0.00 | 0.00 | 0.00 | 0.03 | 18.90 | ||
| 59 | Bank of Maharashtra Apps | 0.03 | 5.66 | 0.00 | 0.00 | 0.00 | 0.00 | 0.03 | 5.66 | ||
| 60 | Allahabad Bank Apps | 0.03 | 8.73 | 0.00 | 0.00 | 0.00 | 0.00 | 0.03 | 8.73 | ||
| 61 | Punjab Sind Bank Apps | 0.03 | 12.72 | 0.00 | 0.00 | 0.00 | 0.00 | 0.03 | 12.72 | ||
| 62 | NSDL Payments Bank Apps | 0.03 | 4.56 | 0.00 | 0.00 | 0.00 | 0.00 | 0.03 | 4.56 | ||
| 63 | Utkarsh Small Finance Bank Apps | 0.02 | 6.24 | 0.00 | 0.00 | 0.00 | 0.00 | 0.02 | 6.24 | ||
| 64 | Mobikwik PPI | 0.02 | 3.63 | 0.00 | 0.00 | 0.00 | 0.00 | 0.02 | 3.63 | ||
| 65 | Jammu and Kashmir Bank Apps | 0.01 | 2.29 | 0.00 | 0.00 | 0.00 | 0.00 | 0.01 | 2.29 | ||
| 66 | Zomato | 0.01 | 0.66 | 0.00 | 0.00 | 0.00 | 0.00 | 0.01 | 0.66 | ||
| 67 | Dhanlaxmi Bank Apps | 0.01 | 2.87 | 0.00 | 0.00 | 0.00 | 0.00 | 0.01 | 2.87 | ||
| 68 | Bandhan Bank Apps | 0.01 | 0.98 | 0.00 | 0.00 | 0.00 | 0.00 | 0.01 | 0.98 | ||
| 69 | Shriram | 0.01 | 0.21 | 0.00 | 0.00 | 0.00 | 0.00 | 0.01 | 0.21 | ||
| 70 | Others | 0.03 | 11.05 | 0.00 | 0.00 | 0.00 | 0.00 | 0.03 | 11.05 | ||
Note:-
| UPI P2P and P2M Transactions | ||||||
|---|---|---|---|---|---|---|
| Month | Total | P2P | P2M | |||
| Volume (Mn) | Value (Cr) | Volume (Mn) | Value (Cr) | Volume (Mn) | Value (Cr) | |
| Jul'23 | 9,964.61 | 15,33,645.20 | 4,184.42 | 11,48,397.97 | 5,780.19 | 3,85,247.22 |
| UPI Payer PSP Performance (Jul'23) | |||||
|---|---|---|---|---|---|
| Sr. No. | Payer PSP | Total Volume (In Mn) | Approved % | BD % | TD % |
| 1 | Yes Bank Ltd | 3475.05 | 98.47% | 1.53% | 0.00% |
| 2 | Axis Bank Ltd | 1814.41 | 98.32% | 1.67% | 0.00% |
| 3 | ICICI Bank | 1642.83 | 98.43% | 1.57% | 0.00% |
| 4 | Paytm Payments Bank | 1302.04 | 98.38% | 1.62% | 0.00% |
| 5 | State Bank Of India | 967.58 | 98.13% | 1.87% | 0.00% |
| 6 | HDFC Bank Ltd | 815.96 | 98.49% | 1.50% | 0.01% |
| 7 | BHIM | 26.31 | 94.78% | 5.20% | 0.02% |
| 8 | Kotak Mahindra Bank | 19.02 | 97.58% | 2.40% | 0.01% |
| 9 | Fampay (PPI) | 17.07 | 98.34% | 1.66% | 0.00% |
| 10 | Airtel Payments Bank | 9.93 | 97.20% | 2.74% | 0.06% |
| 11 | India Post Payment Bank | 5.53 | 98.21% | 1.79% | 0.00% |
| 12 | Federal Bank | 5.32 | 97.55% | 2.44% | 0.01% |
| 13 | IDFC FIRST Bank | 4.49 | 97.19% | 2.77% | 0.04% |
| 14 | Standard Chartered | 4.15 | 99.79% | 0.21% | 0.00% |
| 15 | RBL Bank | 2.40 | 97.99% | 2.00% | 0.00% |
| UPI Payee PSP Performance (Jul'23) | |||||
|---|---|---|---|---|---|
| Sr. No. | Payee PSP | Total Volume (In Mn) | Approved % | BD % | TD % |
| 1 | Yes Bank Ltd | 3432.56 | 99.66% | 0.30% | 0.03% |
| 2 | Paytm Payments Bank | 2469.97 | 99.61% | 0.37% | 0.02% |
| 3 | ICICI Bank | 1169.26 | 99.48% | 0.47% | 0.05% |
| 4 | Axis Bank Ltd | 1063.59 | 99.45% | 0.52% | 0.03% |
| 5 | HDFC Bank Ltd | 552.11 | 99.25% | 0.67% | 0.08% |
| 6 | State Bank Of India | 473.74 | 99.32% | 0.60% | 0.09% |
| 7 | Federal Bank | 166.71 | 98.48% | 1.32% | 0.19% |
| 8 | IndusInd Bank | 49.09 | 98.74% | 0.74% | 0.52% |
| 9 | Kotak Mahindra Bank | 32.00 | 99.14% | 0.51% | 0.35% |
| 10 | IDFC FIRST Bank | 25.61 | 95.01% | 2.32% | 2.67% |
| 11 | Indian Bank | 18.40 | 98.17% | 1.58% | 0.25% |
| 12 | Airtel Payments Bank | 15.20 | 98.46% | 0.49% | 1.05% |
| 13 | Canara Bank | 14.88 | 99.05% | 0.81% | 0.14% |
| 14 | Cosmos Bank | 14.21 | 94.80% | 5.00% | 0.19% |
| 15 | Fino Payments Bank | 12.36 | 97.74% | 1.82% | 0.44% |
| UPI Merchant Category-wise Classification - July'23 (Arranged by Volume) | ||||
|---|---|---|---|---|
| Type | MCC | Description | Volume (in Mn) | Value (in Cr.) |
| High Transacting Categories | 5411 | Groceries and supermarkets | 1,105.50 | 31,148.53 |
| 5812 | Eating places and restaurants | 704.92 | 11,400.18 | |
| 4814 | Telecommunication services, including local and long distance calls, credit card calls, calls through use of magnetic stripe reading telephones and faxes | 536.89 | 11,089.90 | |
| 5814 | Fast food restaurants | 363.02 | 4,630.31 | |
| 5311 | Department stores | 343.67 | 7,032.92 | |
| 5541 | Service stations (with or without ancillary services) | 285.63 | 17,959.10 | |
| 5816 | Digital Goods: Games | 212.05 | 8,160.71 | |
| 5912 | Drug stores and pharmacies | 149.38 | 5,595.82 | |
| 5462 | Bakeries | 131.86 | 1,902.37 | |
| 4900 | Utilities electric, gas, water and sanitary | 92.90 | 12,360.49 | |
| Medium Transacting Categories | 6540 | Debit card to wallet credit (Wallet top up) | 91.70 | 5,944.14 |
| 5813 | Drinking places (alcoholic beverages) bars, taverns, night-clubs, cocktail lounges and discothques | 84.32 | 3,186.60 | |
| 5451 | Dairies | 80.66 | 1,568.53 | |
| 7299 | Miscellaneous personal services not elsewhere classified | 71.06 | 2,511.96 | |
| 7322 | Debt collection agencies | 66.41 | 55,027.89 | |
| 6012 | Financial institutions merchandise and services | 48.16 | 13,232.60 | |
| 5399 | Miscellaneous general merchandise | 45.14 | 4,348.47 | |
| 6211 | Securities brokers and dealers | 42.10 | 32,257.63 | |
| 5732 | Electronics shops | 40.30 | 5,163.26 | |
| 5441 | Candy, nut and confectionery shops | 39.99 | 699.88 | |
| All Other Categories | 5422 | Freezer and locker meat provisioners | 39.48 | 1,263.77 |
| 5137 | Mens, womens and childrens uniforms and commercial clothing | 39.04 | 3,727.59 | |
| 5993 | Cigar shops and stands | 35.70 | 273.65 | |
| 7230 | Beauty and barber shops | 34.91 | 1,008.97 | |
| 5331 | Variety stores | 33.57 | 2,030.41 | |
| 5722 | Household appliance shops | 30.63 | 3,061.74 | |
| 9399 | Government services not elsewhere classified | 30.17 | 4,843.81 | |
| 5262 | Online Marketplaces | 29.38 | 2,948.42 | |
| 4899 | Cable and other pay television services | 28.87 | 1,191.74 | |
| Others | 942.75 | 1,29,675.82 | ||
| Total | 5,780.19 | 3,85,247.22 | ||
| State-wise UPI Product Statistics* (Jul'23) | |||||
|---|---|---|---|---|---|
| Sr. No. | State / Union Territory | Volume (in Mn ) | Volume Contribution (%) | Value (in Cr.) | Value Contribution (%) |
| 1 | MAHARASHTRA | 2,034.12 | 20.41% | 2,78,351.31 | 18.15% |
| 2 | KARNATAKA | 870.28 | 8.73% | 1,22,630.19 | 8.00% |
| 3 | TELANGANA | 720.58 | 7.23% | 1,27,885.79 | 8.34% |
| 4 | UTTAR PRADESH | 630.30 | 6.33% | 90,963.74 | 5.93% |
| 5 | TAMIL NADU | 494.19 | 4.96% | 83,009.09 | 5.41% |
| 6 | MADHYA PRADESH | 471.51 | 4.73% | 66,620.88 | 4.34% |
| 7 | RAJASTHAN | 405.86 | 4.07% | 63,069.10 | 4.11% |
| 8 | DELHI | 397.81 | 3.99% | 54,276.07 | 3.54% |
| 9 | ANDHRA PRADESH | 323.27 | 3.24% | 67,084.86 | 4.37% |
| 10 | GUJARAT | 302.19 | 3.03% | 49,555.82 | 3.23% |
| 11 | WEST BENGAL | 289.59 | 2.91% | 50,112.15 | 3.27% |
| 12 | BIHAR | 281.52 | 2.83% | 46,720.09 | 3.05% |
| 13 | HARYANA | 246.82 | 2.48% | 37,267.08 | 2.43% |
| 14 | KERALA | 224.03 | 2.25% | 33,854.52 | 2.21% |
| 15 | ODISHA | 208.06 | 2.09% | 31,154.66 | 2.03% |
| 16 | PUNJAB | 132.51 | 1.33% | 23,480.60 | 1.53% |
| 17 | JHARKHAND | 96.74 | 0.97% | 14,277.91 | 0.93% |
| 18 | ASSAM | 96.55 | 0.97% | 14,637.06 | 0.95% |
| 19 | CHHATTISGARH | 84.67 | 0.85% | 11,730.08 | 0.76% |
| 20 | UTTARAKHAND | 78.54 | 0.79% | 10,785.35 | 0.70% |
| 21 | HIMACHAL PRADESH | 33.86 | 0.34% | 4,716.73 | 0.31% |
| 22 | JAMMU AND KASHMIR | 32.26 | 0.32% | 5,337.27 | 0.35% |
| 23 | CHANDIGARH | 18.75 | 0.19% | 2,592.68 | 0.17% |
| 24 | GOA | 18.42 | 0.18% | 2,746.69 | 0.18% |
| 25 | PUDUCHERRY | 11.10 | 0.11% | 1,653.48 | 0.11% |
| 26 | ARUNACHAL PRADESH | 8.14 | 0.08% | 1,373.51 | 0.09% |
| 27 | TRIPURA | 6.24 | 0.06% | 1,064.86 | 0.07% |
| 28 | DADRA & NAGAR HAVELI & DAMAN & DIU | 5.63 | 0.06% | 677.01 | 0.04% |
| 29 | NAGALAND | 5.14 | 0.05% | 1,204.72 | 0.08% |
| 30 | MEGHALAYA | 5.11 | 0.05% | 950.01 | 0.06% |
| 31 | MIZORAM | 4.03 | 0.04% | 923.43 | 0.06% |
| 32 | SIKKIM | 3.81 | 0.04% | 645.73 | 0.04% |
| 33 | LADAKH | 1.94 | 0.02% | 483.88 | 0.03% |
| 34 | ANDAMAN & NICOBAR | 1.69 | 0.02% | 318.73 | 0.02% |
| 35 | MANIPUR | 1.59 | 0.02% | 475.02 | 0.03% |
| 36 | LAKSHADWEEP | 0.09 | 0.00% | 21.03 | 0.00% |
| 37 | UNCLASSIFIED# | 1,417.69 | 14.23% | 2,30,885.29 | 15.06% |
| UPI Remitter Banks - Top 50 Banks (Jun'23) | |||||||
|---|---|---|---|---|---|---|---|
| Sr. No. | UPI Remitter Banks (Jun-2023) | Total Volume (In Mn) | Approved % | BD % | TD% | Total Debit Reversal Count (In Mn) | Debit Reversal Success % |
| 1 | State Bank of India | 2415.09 | 95.62% | 4.23% | 0.14% | 7.08 | 96.41% |
| 2 | HDFC BANK LTD | 830.95 | 96.41% | 3.49% | 0.11% | 2.22 | 95.48% |
| 3 | Bank of Baroda | 604.62 | 94.46% | 5.36% | 0.18% | 1.84 | 91.10% |
| 4 | Union Bank of India | 581.94 | 95.29% | 4.45% | 0.26% | 1.80 | 82.12% |
| 5 | ICICI Bank | 461.74 | 95.59% | 3.11% | 1.31% | 2.53 | 91.21% |
| 6 | Punjab National Bank | 449.87 | 95.31% | 4.24% | 0.45% | 1.85 | 94.69% |
| 7 | Kotak Mahindra Bank | 436.37 | 92.80% | 4.85% | 2.34% | 1.35 | 72.73% |
| 8 | Canara Bank | 429.75 | 94.19% | 4.86% | 0.95% | 2.45 | 82.16% |
| 9 | Axis Bank Ltd | 422.13 | 96.07% | 3.88% | 0.05% | 1.08 | 84.01% |
| 10 | Paytm Payments Bank | 407.65 | 96.41% | 3.59% | 0.00% | 0.58 | 97.07% |
| 11 | Bank of India | 303.65 | 95.96% | 3.89% | 0.15% | 0.91 | 88.65% |
| 12 | Indian Bank | 254.86 | 94.91% | 4.67% | 0.42% | 1.17 | 68.48% |
| 13 | Airtel Payments Bank | 205.13 | 89.26% | 9.06% | 1.68% | 1.23 | 25.74% |
| 14 | India Post Payment Bank | 171.64 | 74.50% | 10.55% | 14.95% | 3.24 | 39.13% |
| 15 | Federal Bank | 147.42 | 94.11% | 5.17% | 0.72% | 0.46 | 82.38% |
| 16 | Central Bank Of India | 146.77 | 88.61% | 8.72% | 2.67% | 1.99 | 69.10% |
| 17 | Indian Overseas Bank | 121.04 | 94.91% | 4.52% | 0.57% | 0.45 | 92.24% |
| 18 | IDBI Bank Limited | 113.13 | 95.57% | 3.67% | 0.76% | 0.52 | 90.90% |
| 19 | UCO Bank | 111.61 | 91.35% | 5.18% | 3.46% | 1.15 | 39.34% |
| 20 | Bank of Maharashtra | 103.70 | 94.03% | 5.09% | 0.87% | 0.47 | 67.71% |
| 21 | INDUSIND BANK | 91.07 | 94.19% | 5.57% | 0.23% | 0.33 | 90.29% |
| 22 | Yes Bank Ltd | 87.16 | 96.03% | 3.78% | 0.20% | 0.19 | 72.87% |
| 23 | Fino Payments Bank Limited | 80.47 | 85.18% | 13.57% | 1.25% | 0.26 | 88.93% |
| 24 | Karnataka Bank | 76.27 | 93.21% | 5.09% | 1.70% | 0.18 | 88.81% |
| 25 | IDFC FIRST Bank | 60.02 | 93.98% | 5.59% | 0.43% | 0.24 | 66.61% |
| 26 | Karur Vysya Bank | 47.09 | 93.03% | 6.88% | 0.09% | 0.11 | 92.10% |
| 27 | Bandhan Bank | 38.12 | 93.15% | 5.44% | 1.41% | 0.28 | 58.31% |
| 28 | South Indian Bank | 38.08 | 95.79% | 4.20% | 0.01% | 0.07 | 95.94% |
| 29 | Jammu and Kashmir Bank | 30.81 | 88.97% | 7.02% | 4.00% | 0.31 | 40.85% |
| 30 | City Union Bank | 27.66 | 93.18% | 6.25% | 0.57% | 0.08 | 94.82% |
| 31 | Ujjivan Small Finance Bank | 26.84 | 93.85% | 5.74% | 0.41% | 0.11 | 67.18% |
| 32 | AU small Finance Bank | 26.60 | 94.32% | 4.63% | 1.05% | 0.19 | 96.80% |
| 33 | Equitas Bank | 24.45 | 90.40% | 9.33% | 0.26% | 0.07 | 93.51% |
| 34 | Tamilnad Mercantile Bank | 23.94 | 94.02% | 5.74% | 0.25% | 0.05 | 81.82% |
| 35 | Punjab and Sind Bank | 23.88 | 87.61% | 9.61% | 2.79% | 0.24 | 49.60% |
| 36 | DBS Bank India Limited | 22.40 | 95.83% | 3.95% | 0.22% | 0.07 | 82.03% |
| 37 | Standard Chartered | 21.93 | 97.40% | 2.29% | 0.31% | 0.06 | 84.51% |
| 38 | Andhra Pradesh Grameena Vikas Bank | 20.70 | 79.23% | 12.48% | 8.29% | 0.35 | 55.17% |
| 39 | Pragathi Krishna Gramin Bank | 18.72 | 86.69% | 9.58% | 3.73% | 0.19 | 53.50% |
| 40 | Citibank | 18.54 | 94.07% | 3.75% | 2.18% | 0.08 | 94.21% |
| 41 | Maharashtra Gramin Bank | 17.89 | 80.91% | 10.75% | 8.34% | 0.16 | 26.11% |
| 42 | Kerala Gramin Bank | 17.62 | 89.73% | 8.33% | 1.95% | 0.10 | 68.23% |
| 43 | Saraswat Bank | 17.31 | 95.04% | 3.75% | 1.21% | 0.10 | 33.36% |
| 44 | Tri O Tech Solutions Private Limited (PPI) | 14.99 | 100.00% | 0.00% | 0.00% | 0.00 | 0.00% |
| 45 | Rajasthan Marudhara Gramin Bank | 14.55 | 82.55% | 12.85% | 4.60% | 0.18 | 22.95% |
| 46 | ESAF Small Finance Bank Ltd. | 14.37 | 91.91% | 6.11% | 1.98% | 0.05 | 69.68% |
| 47 | Sarva Haryana Gramin Bank | 12.47 | 90.04% | 6.89% | 3.07% | 0.08 | 48.50% |
| 48 | RBL Bank | 12.07 | 92.58% | 6.25% | 1.17% | 0.04 | 88.21% |
| 49 | Baroda UP Gramin Bank | 11.43 | 86.89% | 9.19% | 3.92% | 0.15 | 29.40% |
| 50 | Andhra Pragathi Grameena Bank | 11.17 | 73.43% | 21.36% | 5.21% | 0.10 | 24.44% |
| UPI Beneficiary Banks - Top 50 Banks (Jun'23) | |||||||
|---|---|---|---|---|---|---|---|
| Sr.No. | UPI Beneficiary Banks (Jun-2023) | Total Volume (In Mn) | Approved % | BD% | TD% | Deemed Approved % | |
| 1 | Paytm Payments Bank | 2177.68 | 99.79% | 0.20% | 0.01% | 0.00% | |
| 2 | Yes Bank Ltd | 1735.59 | 99.96% | 0.02% | 0.02% | 0.00% | |
| 3 | State Bank Of India | 1017.11 | 99.66% | 0.19% | 0.13% | 0.02% | |
| 4 | Axis Bank Ltd | 644.25 | 99.76% | 0.11% | 0.08% | 0.04% | |
| 5 | ICICI Bank | 591.75 | 98.72% | 0.25% | 0.76% | 0.27% | |
| 6 | HDFC BANK LTD | 479.17 | 99.41% | 0.48% | 0.07% | 0.04% | |
| 7 | Bank of Baroda | 274.76 | 99.64% | 0.16% | 0.12% | 0.08% | |
| 8 | Union Bank of India | 267.39 | 99.77% | 0.16% | 0.06% | 0.02% | |
| 9 | Federal Bank | 213.89 | 99.12% | 0.23% | 0.60% | 0.05% | |
| 10 | Punjab National Bank | 211.61 | 99.14% | 0.39% | 0.28% | 0.19% | |
| 11 | Canara Bank | 209.80 | 98.64% | 0.43% | 0.64% | 0.29% | |
| 12 | Kotak Mahindra Bank | 187.61 | 97.12% | 0.41% | 1.47% | 1.00% | |
| 13 | Bank of India | 148.54 | 99.60% | 0.24% | 0.11% | 0.05% | |
| 14 | Indian Bank | 131.25 | 99.46% | 0.24% | 0.29% | 0.00% | |
| 15 | Airtel Payments Bank | 116.09 | 98.12% | 0.41% | 1.13% | 0.34% | |
| 16 | INDUSIND BANK | 94.66 | 99.06% | 0.21% | 0.50% | 0.24% | |
| 17 | Central Bank Of India | 73.76 | 96.15% | 0.61% | 2.43% | 0.81% | |
| 18 | India Post Payment Bank | 74.36 | 90.31% | 0.55% | 8.45% | 0.68% | |
| 19 | Indian Overseas Bank | 59.10 | 98.95% | 0.37% | 0.39% | 0.30% | |
| 20 | UCO Bank | 54.91 | 95.38% | 0.70% | 3.43% | 0.49% | |
| 21 | IDBI Bank Limited | 52.30 | 99.00% | 0.40% | 0.42% | 0.17% | |
| 22 | IDFC FIRST Bank | 41.95 | 98.48% | 0.99% | 0.39% | 0.14% | |
| 23 | Bank of Maharashtra | 41.63 | 98.91% | 0.24% | 0.66% | 0.19% | |
| 24 | Karnataka Bank | 34.46 | 97.41% | 1.02% | 1.56% | 0.01% | |
| 25 | Fino Payments Bank Limited | 29.84 | 98.31% | 0.59% | 1.06% | 0.04% | |
| 26 | Karur Vysya Bank | 26.95 | 99.47% | 0.47% | 0.06% | 0.00% | |
| 27 | South Indian Bank | 24.87 | 99.79% | 0.20% | 0.01% | 0.00% | |
| 28 | Bandhan Bank | 23.77 | 97.62% | 0.48% | 1.51% | 0.39% | |
| 29 | AU small Finance Bank | 18.90 | 97.84% | 1.03% | 0.71% | 0.42% | |
| 30 | Tamilnad Mercantile Bank | 15.01 | 99.74% | 0.17% | 0.07% | 0.02% | |
| 31 | City Union Bank | 15.13 | 98.58% | 0.78% | 0.56% | 0.08% | |
| 32 | Ujjivan Small Finance Bank | 14.42 | 99.25% | 0.31% | 0.31% | 0.13% | |
| 33 | Jammu and Kashmir Bank | 13.75 | 97.11% | 0.34% | 2.25% | 0.31% | |
| 34 | Equitas Bank | 11.38 | 97.57% | 2.21% | 0.21% | 0.01% | |
| 35 | Punjab and Sind Bank | 10.97 | 97.58% | 0.19% | 1.90% | 0.34% | |
| 36 | RBL Bank | 19.83 | 98.69% | 0.56% | 0.69% | 0.06% | |
| 37 | Kerala Gramin Bank | 10.30 | 98.62% | 0.20% | 0.80% | 0.38% | |
| 38 | Pragathi Krishna Gramin Bank | 10.09 | 97.81% | 0.38% | 1.11% | 0.70% | |
| 39 | Citibank | 11.91 | 99.76% | 0.00% | 0.14% | 0.10% | |
| 40 | Andhra Pradesh Grameena Vikas Bank | 9.79 | 93.82% | 0.29% | 5.40% | 0.49% | |
| 41 | DBS Bank India Limited | 9.16 | 98.36% | 1.40% | 0.12% | 0.12% | |
| 42 | Maharashtra Gramin Bank | 8.58 | 94.04% | 0.38% | 5.15% | 0.44% | |
| 43 | ESAF Small Finance Bank Ltd. | 7.75 | 98.26% | 0.12% | 1.47% | 0.15% | |
| 44 | Baroda UP Gramin Bank | 7.56 | 94.84% | 1.03% | 3.26% | 0.87% | |
| 45 | Rajasthan Marudhara Gramin Bank | 7.36 | 96.52% | 0.36% | 2.49% | 0.63% | |
| 46 | Tri O Tech Solutions Private Limited PPI | 7.47 | 93.15% | 6.60% | 0.23% | 0.03% | |
| 47 | Jio Payments Bank | 6.50 | 99.17% | 0.43% | 0.15% | 0.25% | |
| 48 | Saraswat Bank | 6.35 | 98.28% | 0.19% | 1.07% | 0.46% | |
| 49 | Sarva Haryana Gramin Bank | 5.86 | 96.97% | 0.45% | 2.24% | 0.34% | |
| 50 | Andhra Pragathi Grameena Bank | 6.09 | 92.97% | 2.70% | 4.10% | 0.23% | |
| UPI Apps (Jun'23) | |||||||||||
|---|---|---|---|---|---|---|---|---|---|---|---|
| Sr.No. | Application Name | Customer Initiated Transactions | B2C Transactions | B2B Transactions | On-us Transactions | Total | |||||
| Volume (Mn) | Value (Cr) | Volume (Mn) | Value (Cr) | Volume (Mn) | Value (Cr) | Volume (Mn) | Value (Cr) | Volume (Mn) | Value (Cr) | ||
| 1 | PhonePe | 4,461.40 | 7,45,552.20 | 0.00 | 0.00 | 0.00 | 0.00 | 4,461.36 | 7,45,552.20 | ||
| 2 | Google Pay | 3,266.80 | 4,94,088.00 | 0.00 | 0.00 | 0.00 | 0.00 | 3,266.83 | 4,94,088.00 | ||
| 3 | Paytm Payments Bank App | 1,197.30 | 1,39,950.10 | 1.40 | 4.20 | 0.60 | 866.80 | 108.10 | 21,673.70 | 1,307.48 | 1,62,494.80 |
| 4 | Cred | 73.90 | 26,431.80 | 0.00 | 0.00 | 0.00 | 0.00 | 73.93 | 26,431.80 | ||
| 5 | Amazon Pay | 52.90 | 5,647.90 | 0.00 | 0.00 | 0.00 | 0.00 | 52.89 | 5,647.90 | ||
| 6 | Axis Bank Apps | 9.70 | 1,692.70 | 37.90 | 537.10 | 0.00 | 1.90 | 47.64 | 2,231.70 | ||
| 7 | ICICI Bank Apps | 27.10 | 8,599.30 | 4.80 | 338.00 | 5.70 | 7,306.50 | 37.63 | 16,243.70 | ||
| 8 | Yes Bank Apps | 35.80 | 12,721.80 | 0.00 | 0.00 | 0.70 | 275.60 | 36.46 | 12,997.50 | ||
| 9 | BHIM | 23.10 | 7,289.00 | 0.00 | 0.00 | 0.00 | 0.00 | 23.11 | 7,289.00 | ||
| 10 | HDFC Bank Apps | 17.60 | 4,168.60 | 0.00 | 0.00 | 0.00 | 0.00 | 17.56 | 4,168.60 | ||
| 11 | Kotak Mahindra Bank Apps | 17.40 | 3,202.50 | 0.00 | 0.00 | 0.00 | 0.00 | 17.38 | 3,202.50 | ||
| 12 | 16.00 | 1,443.30 | 0.00 | 0.00 | 0.00 | 0.00 | 16.00 | 1,443.30 | |||
| 13 | Fampay | 15.00 | 184.70 | 0.00 | 0.00 | 0.00 | 0.00 | 14.99 | 184.70 | ||
| 14 | Bajaj Finserv | 9.80 | 1,312.60 | 0.00 | 0.00 | 0.00 | 0.00 | 9.76 | 1,312.60 | ||
| 15 | Airtel Payments Bank Apps | 8.80 | 632.10 | 0.00 | 0.00 | 0.00 | 0.00 | 0.00 | 0.10 | 8.84 | 632.20 |
| 16 | IDFC Bank Apps | 6.30 | 1,528.10 | 0.00 | 0.00 | 0.00 | 12.20 | 6.31 | 1,540.30 | ||
| 17 | Samsung Pay | 5.60 | 522.80 | 0.00 | 0.00 | 0.00 | 0.00 | 5.61 | 522.80 | ||
| 18 | Federal Bank Apps | 4.90 | 630.00 | 0.00 | 0.00 | 0.00 | 0.00 | 4.86 | 630.00 | ||
| 19 | India Post Payments Bank Apps | 4.80 | 742.50 | 0.00 | 0.00 | 0.00 | 0.00 | 4.83 | 742.50 | ||
| 20 | State Bank of India Apps | 4.60 | 1,959.30 | 0.00 | 0.00 | 0.00 | 0.40 | 4.64 | 1,959.70 | ||
| 21 | Mobikwik | 3.60 | 1,060.40 | 0.00 | 0.00 | 0.00 | 0.00 | 3.58 | 1,060.40 | ||
| 22 | Jupiter | 3.00 | 424.80 | 0.00 | 0.00 | 0.00 | 0.00 | 2.96 | 424.80 | ||
| 23 | Deutsche Bank Apps | 1.80 | 125.60 | 0.00 | 0.00 | 0.00 | 0.00 | 1.81 | 125.60 | ||
| 24 | Canara Bank Apps | 1.60 | 462.70 | 0.00 | 0.00 | 0.00 | 0.00 | 1.58 | 462.70 | ||
| 25 | Groww | 1.50 | 1,039.60 | 0.00 | 0.00 | 0.00 | 0.00 | 1.45 | 1,039.60 | ||
| 26 | Standard Chartered Bank Apps | 1.20 | 522.60 | 0.00 | 0.00 | 0.20 | 150.00 | 1.40 | 672.60 | ||
| 27 | Jio Payments Bank Apps | 1.40 | 113.20 | 0.00 | 0.00 | 0.00 | 0.00 | 1.35 | 113.20 | ||
| 28 | RBL Bank Apps | 1.10 | 493.40 | 0.00 | 0.00 | 0.20 | 4.40 | 1.29 | 497.90 | ||
| 29 | Bank of Baroda Apps | 1.20 | 427.60 | 0.00 | 0.00 | 0.00 | 0.10 | 1.19 | 427.70 | ||
| 30 | slice | 0.90 | 272.80 | 0.00 | 0.00 | 0.00 | 0.00 | 0.88 | 272.80 | ||
| 31 | IndusInd Bank Apps | 0.80 | 897.60 | 0.00 | 0.00 | 0.00 | 0.00 | 0.79 | 897.60 | ||
| 32 | Union Bank Apps | 0.80 | 318.90 | 0.00 | 0.00 | 0.00 | 0.00 | 0.79 | 318.90 | ||
| 33 | Punjab National Bank Apps | 0.80 | 169.70 | 0.00 | 0.00 | 0.00 | 0.00 | 0.77 | 169.70 | ||
| 34 | AU Small Finance Bank Apps | 0.60 | 196.10 | 0.00 | 0.00 | 0.00 | 0.00 | 0.64 | 196.10 | ||
| 35 | Karnataka Bank Apps | 0.60 | 125.90 | 0.00 | 0.00 | 0.00 | 0.00 | 0.61 | 125.90 | ||
| 36 | OmniCard | 0.50 | 13.90 | 0.00 | 0.00 | 0.00 | 0.00 | 0.48 | 13.90 | ||
| 37 | Central Bank of India Apps | 0.40 | 97.40 | 0.00 | 0.00 | 0.00 | 0.10 | 0.44 | 97.60 | ||
| 38 | DBS Digibank Apps | 0.40 | 166.90 | 0.00 | 0.00 | 0.00 | 0.00 | 0.41 | 166.90 | ||
| 39 | UCO Bank Apps | 0.30 | 107.60 | 0.00 | 0.00 | 0.00 | 0.00 | 0.33 | 107.60 | ||
| 40 | Indian Bank Apps | 0.30 | 80.20 | 0.00 | 0.00 | 0.00 | 1.10 | 0.28 | 81.20 | ||
| 41 | South Indian Bank Apps | 0.30 | 70.50 | 0.00 | 0.00 | 0.00 | 0.00 | 0.25 | 70.50 | ||
| 42 | Bank of India Apps | 0.20 | 71.90 | 0.00 | 0.00 | 0.00 | 0.00 | 0.23 | 71.90 | ||
| 43 | Jupiter Edge (LivQuick PPI) | 0.20 | 11.30 | 0.00 | 0.00 | 0.00 | 0.00 | 0.21 | 11.30 | ||
| 44 | HSBC Bank Apps | 0.20 | 89.10 | 0.00 | 0.10 | 0.00 | 0.00 | 0.15 | 89.20 | ||
| 45 | Fino Payments bank Apps | 0.10 | 9.20 | 0.00 | 0.00 | 0.00 | 0.00 | 0.13 | 9.20 | ||
| 46 | TataNeu | 0.10 | 17.60 | 0.00 | 0.00 | 0.00 | 0.00 | 0.12 | 17.60 | ||
| 47 | Tamilnad Mercantile Bank Apps | 0.10 | 18.90 | 0.00 | 0.00 | 0.00 | 0.00 | 0.08 | 18.90 | ||
| 48 | IDBI Bank Apps | 0.10 | 34.10 | 0.00 | 0.00 | 0.00 | 0.00 | 0.08 | 34.10 | ||
| 49 | Citi Bank Apps | 0.10 | 54.20 | 0.00 | 0.00 | 0.00 | 0.00 | 0.07 | 54.20 | ||
| 50 | Fave | 0.10 | 4.60 | 0.00 | 0.00 | 0.00 | 0.00 | 0.07 | 4.60 | ||
| 51 | Bajaj Finserv PPI | 0.10 | 14.30 | 0.00 | 0.00 | 0.00 | 0.00 | 0.07 | 14.30 | ||
| 52 | PINELABS | 0.10 | 4.20 | 0.00 | 0.00 | 0.00 | 0.00 | 0.07 | 4.20 | ||
| 53 | City Union Bank Apps | 0.10 | 18.30 | 0.00 | 0.00 | 0.00 | 0.00 | 0.06 | 18.30 | ||
| 54 | Kiwi | 0.10 | 4.10 | 0.00 | 0.00 | 0.00 | 0.00 | 0.05 | 4.10 | ||
| 55 | Indian Overseas Bank Apps | 0.00 | 13.00 | 0.00 | 0.00 | 0.00 | 0.00 | 0.05 | 13.00 | ||
| 56 | Ultracash | 0.00 | 3.10 | 0.00 | 0.00 | 0.00 | 0.00 | 0.04 | 3.10 | ||
| 57 | Karur Vysya Bank Apps | 0.00 | 14.00 | 0.00 | 0.00 | 0.00 | 0.00 | 0.04 | 14.00 | ||
| 58 | MakeMyTrip | 0.00 | 18.20 | 0.00 | 0.00 | 0.00 | 0.00 | 0.03 | 18.20 | ||
| 59 | Punjab Sind Bank Apps | 0.00 | 12.60 | 0.00 | 0.00 | 0.00 | 0.00 | 0.03 | 12.60 | ||
| 60 | Dhani | 0.00 | 7.00 | 0.00 | 0.00 | 0.00 | 0.00 | 0.03 | 7.00 | ||
| 61 | Equitas Small Finance Bank Apps | 0.00 | 17.30 | 0.00 | 0.00 | 0.00 | 0.00 | 0.03 | 17.30 | ||
| 62 | Allahabad Bank Apps | 0.00 | 8.30 | 0.00 | 0.00 | 0.00 | 0.00 | 0.03 | 8.30 | ||
| 63 | NSDL Payments Bank Apps | 0.00 | 4.10 | 0.00 | 0.00 | 0.00 | 0.00 | 0.02 | 4.10 | ||
| 64 | GoNiyo PPI | 0.00 | 0.50 | 0.00 | 0.00 | 0.00 | 0.00 | 0.02 | 0.50 | ||
| 65 | Utkarsh Small Finance Bank Apps | 0.00 | 6.30 | 0.00 | 0.00 | 0.00 | 0.00 | 0.02 | 6.30 | ||
| 66 | Jammu and Kashmir Bank Apps | 0.00 | 2.40 | 0.00 | 0.00 | 0.00 | 0.00 | 0.01 | 2.40 | ||
| 67 | Bandhan Bank Apps | 0.00 | 3.10 | 0.00 | 0.00 | 0.00 | 0.00 | 0.01 | 3.10 | ||
| 68 | Zomato | 0.00 | 1.70 | 0.00 | 0.00 | 0.00 | 0.00 | 0.01 | 1.70 | ||
| 69 | Dhanlaxmi Bank Apps | 0.00 | 3.20 | 0.00 | 0.00 | 0.00 | 0.00 | 0.01 | 3.20 | ||
| 70 | Bank of Maharashtra Apps | 0.00 | 0.80 | 0.00 | 0.00 | 0.00 | 0.00 | 0.01 | 0.80 | ||
| 71 | Others | 0.00 | 11.80 | 0.00 | 0.00 | 0.00 | 0.00 | 0.00 | 0.00 | 0.00 | 11.80 |
Note:-
| UPI P2P and P2M Transactions | ||||||
|---|---|---|---|---|---|---|
| Month | Total | P2P | P2M | |||
| Volume (Mn) | Value (Cr) | Volume (Mn) | Value (Cr) | Volume (Mn) | Value (Cr) | |
| Jun'23 | 9,335.06 | 14,75,464.27 | 3,971.43 | 11,25,422.26 | 5,363.63 | 3,50,042.01 |


| UPI Payer PSP Performance (Jun'23) | |||||
|---|---|---|---|---|---|
| Sr. No. | Payer PSP | Total Volume (In Mn) | Approved % | BD % | TD % |
| 1 | Yes Bank Ltd | 3,318.70 | 98.64% | 0.04% | 1.32% |
| 2 | Axis Bank Ltd | 1,657.48 | 98.48% | 0.01% | 1.51% |
| 3 | ICICI Bank | 1,416.23 | 98.58% | 0.01% | 1.42% |
| 4 | Paytm Payments Bank | 1,219.59 | 98.34% | 0.00% | 1.66% |
| 5 | State Bank Of India | 1,013.07 | 98.56% | 0.00% | 1.44% |
| 6 | HDFC Bank Ltd | 747.72 | 98.03% | 0.02% | 1.95% |
| 7 | Kotak Mahindra Bank | 17.76 | 97.88% | 0.00% | 2.12% |
| 8 | Fampay (PPI) | 15.23 | 98.40% | 0.00% | 1.60% |
| 9 | Airtel Payments Bank | 9.08 | 97.36% | 0.04% | 2.60% |
| 10 | IDFC FIRST Bank | 6.53 | 98.37% | 0.01% | 1.62% |
| 11 | Federal Bank | 4.98 | 97.55% | 0.08% | 2.37% |
| 12 | India Post Payment Bank | 4.92 | 98.15% | 0.01% | 1.84% |
| 13 | RBL Bank | 2.17 | 98.35% | 0.01% | 1.65% |
| 14 | Deutsche Bank | 1.81 | 99.93% | 0.00% | 0.07% |
| 15 | Canara Bank | 1.66 | 94.75% | 0.01% | 5.24% |
| UPI Payee PSP Performance (Jun'23) | |||||
|---|---|---|---|---|---|
| Sr. No. | Payee PSP | Total Volume (In Mn) | Approved % | BD % | TD % |
| 1 | Yes Bank Ltd | 3,265.06 | 99.75% | 0.23% | 0.01% |
| 2 | Paytm Payments Bank | 2,305.56 | 99.60% | 0.37% | 0.03% |
| 3 | Axis Bank Ltd | 1,096.89 | 99.42% | 0.55% | 0.03% |
| 4 | ICICI Bank | 1,029.20 | 99.07% | 0.89% | 0.04% |
| 5 | HDFC Bank Ltd | 468.94 | 99.14% | 0.82% | 0.04% |
| 6 | State Bank Of India | 426.62 | 99.51% | 0.45% | 0.04% |
| 7 | Federal Bank | 157.65 | 95.80% | 3.46% | 0.74% |
| 8 | IndusInd Bank | 50.30 | 98.49% | 0.79% | 0.71% |
| 9 | Kotak Mahindra Bank | 29.50 | 99.40% | 0.36% | 0.24% |
| 10 | Cosmos Bank | 22.42 | 93.25% | 6.34% | 0.40% |
| 11 | IDFC FIRST Bank | 21.66 | 84.43% | 6.84% | 8.73% |
| 12 | Airtel Payments Bank | 15.90 | 98.11% | 1.10% | 0.79% |
| 13 | Canara Bank | 10.97 | 98.90% | 0.89% | 0.21% |
| 14 | Indian Bank | 10.35 | 96.83% | 2.72% | 0.45% |
| 15 | Citibank | 9.80 | 99.18% | 0.71% | 0.12% |
| UPI Merchant Category-wise Classification - June'23 (Arranged by Volume) | ||||
|---|---|---|---|---|
| Type | MCC | Description | Volume (in Mn) | Value (in Cr.) |
| High Transacting Categories | 5411 | Groceries and supermarkets | 1,012.26 | 28,977.99 |
| 5812 | Eating places and restaurants | 683.72 | 11,239.18 | |
| 4814 | Telecommunication services, including local and long distance calls, credit card calls, calls through use of magnetic stripe reading telephones and faxes | 500.42 | 10,596.07 | |
| 5814 | Fast food restaurants | 319.27 | 4,112.76 | |
| 5311 | Department stores | 308.29 | 6,730.08 | |
| 5541 | Service stations (with or without ancillary services) | 269.75 | 18,072.85 | |
| 5816 | Digital Goods: Games | 204.87 | 7,385.91 | |
| 5462 | Bakeries | 131.74 | 1,855.44 | |
| 5912 | Drug stores and pharmacies | 125.41 | 4,863.88 | |
| 6540 | Debit card to wallet credit (Wallet top up) | 94.43 | 5,780.17 | |
| Medium Transacting Categories | 5451 | Dairies | 85.29 | 1,621.76 |
| 4900 | Utilities electric, gas, water and sanitary | 82.16 | 10,655.19 | |
| 5813 | Drinking places (alcoholic beverages) bars, taverns, night-clubs, cocktail lounges and discothques | 73.08 | 2,973.95 | |
| 7299 | Miscellaneous personal services not elsewhere classified | 66.65 | 2,492.24 | |
| 7322 | Debt collection agencies | 62.44 | 48,094.00 | |
| 5331 | Variety stores | 51.69 | 2,882.78 | |
| 6012 | Financial institutions merchandise and services | 44.87 | 12,082.96 | |
| 5422 | Freezer and locker meat provisioners | 41.58 | 1,408.50 | |
| 5399 | Miscellaneous general merchandise | 41.36 | 4,047.83 | |
| 5137 | Mens, womens and childrens uniforms and commercial clothing | 39.58 | 4,058.10 | |
| All Other Categories | 5732 | Electronics shops | 38.77 | 5,453.95 |
| 5441 | Candy, nut and confectionery shops | 37.75 | 657.61 | |
| 6211 | Securities brokers and dealers | 34.17 | 21,168.67 | |
| 7230 | Beauty and barber shops | 32.58 | 991.00 | |
| 5262 | Online Marketplaces | 31.82 | 3,067.87 | |
| 9399 | Government services not elsewhere classified | 28.39 | 3,867.92 | |
| 4899 | Cable and other pay television services | 27.18 | 1,084.41 | |
| 5943 | Stationery, office and school supply shops | 26.00 | 1,030.80 | |
| 4121 | Taxi-cabs and limousines | 25.90 | 632.39 | |
| Others | 842.22 | 1,22,155.75 | ||
| Total | 5,363.63 | 3,50,042.01 | ||
| State-wise UPI Product Statistics* (Jun'23) | |||||
|---|---|---|---|---|---|
| Sr. No. | State / Union Territory | Volume (in Mn ) | Volume Contribution (%) | Value (in Cr.) | Value Contribution (%) |
| 1 | MAHARASHTRA | 1,958.64 | 20.98% | 2,74,244.34 | 18.59% |
| 2 | KARNATAKA | 812.50 | 8.70% | 1,16,958.14 | 7.93% |
| 3 | TELANGANA | 710.27 | 7.61% | 1,29,049.85 | 8.75% |
| 4 | UTTAR PRADESH | 596.11 | 6.39% | 90,290.44 | 6.12% |
| 5 | TAMIL NADU | 458.92 | 4.92% | 79,245.18 | 5.37% |
| 6 | MADHYA PRADESH | 427.33 | 4.58% | 63,711.04 | 4.32% |
| 7 | DELHI | 386.86 | 4.14% | 54,882.65 | 3.72% |
| 8 | RAJASTHAN | 337.69 | 3.62% | 55,593.65 | 3.77% |
| 9 | ANDHRA PRADESH | 295.26 | 3.16% | 62,976.99 | 4.27% |
| 10 | GUJARAT | 277.76 | 2.98% | 46,487.59 | 3.15% |
| 11 | WEST BENGAL | 273.83 | 2.93% | 49,603.55 | 3.36% |
| 12 | BIHAR | 262.96 | 2.82% | 48,095.78 | 3.26% |
| 13 | HARYANA | 226.29 | 2.42% | 35,090.23 | 2.38% |
| 14 | KERALA | 215.06 | 2.30% | 32,879.15 | 2.23% |
| 15 | ODISHA | 197.70 | 2.12% | 30,051.56 | 2.04% |
| 16 | PUNJAB | 124.17 | 1.33% | 22,242.08 | 1.51% |
| 17 | ASSAM | 89.22 | 0.96% | 14,075.95 | 0.95% |
| 18 | JHARKHAND | 88.77 | 0.95% | 13,802.10 | 0.94% |
| 19 | UTTARAKHAND | 79.35 | 0.85% | 11,384.06 | 0.77% |
| 20 | CHHATTISGARH | 73.13 | 0.78% | 10,536.22 | 0.71% |
| 21 | HIMACHAL PRADESH | 37.47 | 0.40% | 5,510.42 | 0.37% |
| 22 | JAMMU AND KASHMIR | 30.84 | 0.33% | 5,058.35 | 0.34% |
| 23 | GOA | 18.53 | 0.20% | 2,779.41 | 0.19% |
| 24 | CHANDIGARH | 17.60 | 0.19% | 2,430.14 | 0.16% |
| 25 | PUDUCHERRY | 10.24 | 0.11% | 1,551.66 | 0.11% |
| 26 | ARUNACHAL PRADESH | 7.69 | 0.08% | 1,376.41 | 0.09% |
| 27 | TRIPURA | 5.62 | 0.06% | 980.89 | 0.07% |
| 28 | DADRA & NAGAR HAVELI & DAMAN & DIU | 5.35 | 0.06% | 651.41 | 0.04% |
| 29 | NAGALAND | 5.03 | 0.05% | 1,176.33 | 0.08% |
| 30 | MEGHALAYA | 4.22 | 0.05% | 811.42 | 0.05% |
| 31 | SIKKIM | 3.91 | 0.04% | 718.62 | 0.05% |
| 32 | MIZORAM | 3.74 | 0.04% | 905.89 | 0.06% |
| 33 | MANIPUR | 1.90 | 0.02% | 497.29 | 0.03% |
| 34 | LADAKH | 1.81 | 0.02% | 454.94 | 0.03% |
| 35 | ANDAMAN & NICOBAR | 1.56 | 0.02% | 305.91 | 0.02% |
| 36 | LAKSHADWEEP | 0.08 | 0.00% | 20.50 | 0.00% |
| 37 | UNCLASSIFIED# | 1,287.64 | 13.79% | 2,09,034.13 | 14.17% |
| UPI Remitter Banks - Top 50 Banks (May'23) | |||||||
|---|---|---|---|---|---|---|---|
| Sr. No. | UPI Remitter Banks (May-2023) | Total Volume (In Mn) | Approved % | BD % | TD% | Total Debit Reversal Count (In Mn) | Debit Reversal Success % |
| 1 | State Bank Of India | 2427.45 | 95.07% | 4.50% | 0.43% | 8.41 | 96.08% |
| 2 | HDFC BANK LTD | 834.13 | 96.07% | 3.75% | 0.18% | 2.75 | 97.68% |
| 3 | Bank of Baroda | 615.53 | 93.91% | 5.52% | 0.58% | 2.08 | 93.52% |
| 4 | Union Bank of India | 587.30 | 95.23% | 4.27% | 0.50% | 2.06 | 72.49% |
| 5 | ICICI Bank | 471.20 | 96.05% | 3.03% | 0.92% | 2.23 | 89.78% |
| 6 | Punjab National Bank | 455.13 | 94.58% | 4.73% | 0.69% | 1.87 | 89.28% |
| 7 | Kotak Mahindra Bank | 445.82 | 93.33% | 4.94% | 1.72% | 1.07 | 83.34% |
| 8 | Canara Bank | 433.19 | 93.94% | 5.18% | 0.87% | 1.72 | 79.21% |
| 9 | Axis Bank Ltd. | 427.56 | 95.98% | 4.01% | 0.02% | 1.01 | 97.95% |
| 10 | Paytm Payments Bank | 425.23 | 96.31% | 3.67% | 0.02% | 0.66 | 96.72% |
| 11 | Bank of India | 308.34 | 95.33% | 4.15% | 0.52% | 0.91 | 84.80% |
| 12 | Indian Bank | 257.31 | 94.56% | 4.74% | 0.70% | 0.79 | 89.91% |
| 13 | Airtel Payments Bank | 210.36 | 87.00% | 11.94% | 1.06% | 0.64 | 63.63% |
| 14 | India Post Payment Bank | 167.39 | 80.61% | 15.66% | 3.73% | 0.63 | 68.11% |
| 15 | Central Bank Of India | 150.03 | 90.06% | 8.41% | 1.53% | 1.22 | 80.86% |
| 16 | Federal Bank | 149.25 | 95.22% | 4.71% | 0.08% | 0.37 | 97.23% |
| 17 | Indian Overseas Bank | 121.85 | 94.43% | 5.18% | 0.39% | 0.44 | 95.94% |
| 18 | IDBI Bank Limited | 114.16 | 95.20% | 3.90% | 0.90% | 0.47 | 84.51% |
| 19 | UCO Bank | 112.87 | 93.87% | 5.29% | 0.84% | 0.41 | 66.09% |
| 20 | Bank of Maharashtra | 104.95 | 92.49% | 5.04% | 2.47% | 0.36 | 50.66% |
| 21 | Yes Bank Ltd | 94.89 | 96.33% | 3.56% | 0.11% | 0.15 | 96.13% |
| 22 | INDUSIND BANK | 91.30 | 93.76% | 5.70% | 0.54% | 0.29 | 91.48% |
| 23 | Fino Payments Bank Limited FIP | 81.88 | 82.85% | 14.95% | 2.21% | 0.25 | 82.81% |
| 24 | Karnataka Bank | 74.77 | 91.31% | 6.20% | 2.50% | 0.20 | 80.02% |
| 25 | IDFC FIRST Bank | 62.61 | 93.74% | 5.39% | 0.87% | 0.18 | 62.55% |
| 26 | Karur Vysya Bank | 47.89 | 92.00% | 7.39% | 0.61% | 0.12 | 86.59% |
| 27 | Bandhan Bank | 41.45 | 85.45% | 11.64% | 2.91% | 0.26 | 55.71% |
| 28 | South Indian Bank | 38.15 | 96.02% | 3.92% | 0.06% | 0.08 | 96.85% |
| 29 | Jammu and Kashmir Bank | 31.55 | 90.22% | 6.87% | 2.90% | 0.15 | 52.76% |
| 30 | City Union Bank | 27.91 | 92.84% | 6.47% | 0.69% | 0.09 | 90.82% |
| 31 | AU small Finance Bank | 26.71 | 94.11% | 4.78% | 1.11% | 0.17 | 94.02% |
| 32 | Ujjivan Small Finance Bank | 26.70 | 93.39% | 5.96% | 0.65% | 0.08 | 64.57% |
| 33 | Equitas Bank | 25.30 | 90.37% | 9.35% | 0.28% | 0.07 | 96.62% |
| 34 | Tamilnad Mercantile Bank | 23.92 | 93.46% | 6.03% | 0.51% | 0.06 | 89.98% |
| 35 | Punjab and Sind Bank | 23.51 | 84.29% | 8.50% | 7.21% | 0.13 | 27.01% |
| 36 | DBS Bank India Limited | 22.90 | 95.55% | 4.03% | 0.42% | 0.05 | 72.77% |
| 37 | Standard Chartered | 20.89 | 96.56% | 2.46% | 0.98% | 0.07 | 83.45% |
| 38 | Andhra Pradesh Grameena Vikas Bank | 19.66 | 81.99% | 12.19% | 5.82% | 0.13 | 63.39% |
| 39 | Citibank | 18.79 | 96.24% | 3.33% | 0.44% | 0.06 | 97.76% |
| 40 | Maharashtra Gramin Bank | 18.29 | 79.80% | 11.39% | 8.80% | 0.05 | 28.67% |
| 41 | Saraswat Bank | 17.68 | 95.93% | 3.03% | 1.04% | 0.04 | 42.17% |
| 42 | Pragathi Krishna Gramin Bank | 17.50 | 89.78% | 9.71% | 0.51% | 0.06 | 95.23% |
| 43 | Kerala Gramin Bank | 17.19 | 90.83% | 8.56% | 0.61% | 0.07 | 94.55% |
| 44 | ESAF Small Finance Bank Ltd. | 16.84 | 74.48% | 24.33% | 1.19% | 0.04 | 70.94% |
| 45 | Rajasthan Marudhara Gramin Bank | 15.87 | 76.51% | 15.43% | 8.06% | 0.04 | 32.11% |
| 46 | Sarva Haryana Gramin Bank | 12.82 | 87.28% | 7.17% | 5.55% | 0.04 | 26.62% |
| 47 | Baroda UP Gramin Bank | 12.32 | 78.88% | 9.72% | 11.40% | 0.05 | 19.50% |
| 48 | RBL | 12.10 | 92.31% | 6.69% | 0.99% | 0.04 | 77.09% |
| 49 | Andhra Pragathi Grameena Bank | 10.26 | 73.67% | 16.48% | 9.86% | 0.02 | 17.82% |
| 50 | Fincare Small Finance Bank Ltd | 9.89 | 85.75% | 10.77% | 3.48% | 0.04 | 40.65% |
| UPI Beneficiary Banks - Top 50 Banks (May'23) | |||||||
|---|---|---|---|---|---|---|---|
| Sr.No. | UPI Beneficiary Banks (May-2023) | Total Volume (In Mn) | Approved % | BD% | TD% | Deemed Approved % | |
| 1 | Paytm Payments Bank | 2122.50 | 99.79% | 0.20% | 0.00% | 0.01% | |
| 2 | Yes Bank Ltd | 1776.21 | 99.93% | 0.02% | 0.04% | 0.01% | |
| 3 | State Bank of India | 1021.12 | 99.36% | 0.24% | 0.33% | 0.06% | |
| 4 | Axis Bank Ltd | 664.41 | 99.90% | 0.09% | 0.01% | 0.00% | |
| 5 | ICICI Bank | 624.05 | 98.76% | 0.63% | 0.39% | 0.22% | |
| 6 | HDFC BANK LTD | 475.30 | 99.31% | 0.57% | 0.06% | 0.07% | |
| 7 | Bank of Baroda | 278.65 | 99.10% | 0.22% | 0.61% | 0.07% | |
| 8 | Union Bank of India | 271.63 | 99.54% | 0.18% | 0.17% | 0.11% | |
| 9 | Federal Bank | 216.25 | 99.75% | 0.23% | 0.02% | 0.00% | |
| 10 | Punjab National Bank | 212.79 | 99.15% | 0.37% | 0.22% | 0.25% | |
| 11 | Canara Bank | 210.04 | 99.13% | 0.19% | 0.48% | 0.19% | |
| 12 | Kotak Mahindra Bank | 203.15 | 97.77% | 0.47% | 1.04% | 0.72% | |
| 13 | Bank of India | 151.38 | 98.35% | 0.24% | 1.32% | 0.09% | |
| 14 | Indian Bank | 132.71 | 98.91% | 0.30% | 0.32% | 0.48% | |
| 15 | Airtel Payments Bank | 116.47 | 98.56% | 0.46% | 0.71% | 0.26% | |
| 16 | INDUSIND BANK | 93.00 | 98.89% | 0.20% | 0.50% | 0.41% | |
| 17 | Central Bank Of India | 74.50 | 98.34% | 0.66% | 0.53% | 0.47% | |
| 18 | India Post Payment Bank | 72.15 | 96.82% | 0.48% | 2.49% | 0.21% | |
| 19 | Indian Overseas Bank | 59.63 | 99.06% | 0.61% | 0.14% | 0.19% | |
| 20 | UCO Bank | 55.10 | 98.72% | 0.68% | 0.52% | 0.08% | |
| 21 | IDBI Bank Limited | 53.37 | 98.81% | 0.42% | 0.60% | 0.17% | |
| 22 | IDFC FIRST Bank | 43.30 | 97.88% | 1.17% | 0.77% | 0.18% | |
| 23 | Bank of Maharashtra | 42.41 | 97.16% | 0.34% | 2.20% | 0.31% | |
| 24 | Karnataka Bank | 34.08 | 96.45% | 1.11% | 2.39% | 0.05% | |
| 25 | RBL | 33.53 | 99.89% | 0.00% | 0.00% | 0.11% | |
| 26 | Karur Vysya Bank | 27.20 | 98.91% | 0.43% | 0.61% | 0.06% | |
| 27 | Fino Payments Bank Limited | 27.08 | 97.40% | 1.04% | 1.49% | 0.07% | |
| 28 | South Indian Bank | 25.43 | 99.75% | 0.21% | 0.04% | 0.00% | |
| 29 | Bandhan Bank | 24.14 | 96.37% | 0.15% | 2.92% | 0.56% | |
| 30 | AU small Finance Bank | 19.21 | 97.46% | 1.41% | 0.76% | 0.37% | |
| 31 | City Union Bank | 15.13 | 98.54% | 0.92% | 0.44% | 0.10% | |
| 32 | Tamilnad Mercantile Bank | 14.80 | 99.35% | 0.23% | 0.39% | 0.02% | |
| 33 | Ujjivan Small Finance Bank | 14.27 | 99.11% | 0.34% | 0.41% | 0.15% | |
| 34 | Jammu and Kashmir Bank | 12.63 | 97.86% | 0.39% | 1.67% | 0.08% | |
| 35 | Equitas Bank | 11.91 | 96.70% | 3.08% | 0.21% | 0.01% | |
| 36 | Punjab and Sind Bank | 10.91 | 93.48% | 0.19% | 5.47% | 0.86% | |
| 37 | Kerala Gramin Bank | 10.06 | 99.27% | 0.19% | 0.33% | 0.22% | |
| 38 | Andhra Pradesh Grameena Vikas Bank | 9.92 | 95.22% | 0.53% | 3.96% | 0.29% | |
| 39 | Pragathi Krishna Gramin Bank | 9.74 | 99.25% | 0.39% | 0.16% | 0.20% | |
| 40 | DBS Bank India Limited | 9.41 | 98.06% | 1.54% | 0.30% | 0.10% | |
| 41 | Maharashtra Gramin Bank | 8.86 | 92.53% | 0.87% | 5.93% | 0.67% | |
| 42 | Baroda UP Gramin Bank | 8.30 | 86.32% | 2.00% | 10.37% | 1.31% | |
| 43 | Rajasthan Marudhara Gramin Bank | 7.82 | 91.18% | 1.92% | 6.45% | 0.46% | |
| 44 | ESAF Small Finance Bank Ltd. | 7.62 | 98.86% | 0.13% | 0.89% | 0.12% | |
| 45 | Tri O Tech Solutions Private Limited | 7.04 | 91.14% | 8.66% | 0.19% | 0.01% | |
| 46 | Saraswat Bank | 6.44 | 98.71% | 0.26% | 0.71% | 0.32% | |
| 47 | Andhra Pragathi Grameena Bank | 6.13 | 89.76% | 0.33% | 9.56% | 0.35% | |
| 48 | Sarva Haryana Gramin Bank | 5.94 | 94.40% | 0.46% | 4.34% | 0.80% | |
| 49 | Jio Payments Bank | 5.24 | 99.39% | 0.46% | 0.10% | 0.04% | |
| 50 | Baroda Rajasthan Kshetriya Gramin Bank | 5.18 | 92.63% | 2.65% | 4.24% | 0.48% | |
| UPI Apps (May'23) | |||||||||||
|---|---|---|---|---|---|---|---|---|---|---|---|
| Sr.No. | Application Name | Customer Initiated Transactions | B2C Transactions | B2B Transactions | On-us Transactions | Total | |||||
| Volume (Mn) | Value (Cr) | Volume (Mn) | Value (Cr) | Volume (Mn) | Value (Cr) | Volume (Mn) | Value (Cr) | Volume (Mn) | Value (Cr) | ||
| 1 | Airtel Payments Bank Apps | 9.17 | 627.09 | 0.00 | 0.00 | 0.00 | 0.00 | 0.00 | 0.08 | 9.17 | 627.17 |
| 2 | Allahabad Bank Apps | 0.03 | 8.87 | 0.00 | 0.00 | 0.00 | 0.00 | 0.00 | 0.00 | 0.03 | 8.87 |
| 3 | Amazon Pay | 57.08 | 5772.68 | 0.00 | 0.00 | 0.00 | 0.00 | 0.00 | 0.00 | 57.08 | 5772.68 |
| 4 | AU Small Finance Bank Apps | 0.65 | 193.87 | 0.00 | 0.00 | 0.00 | 0.00 | 0.00 | 0.00 | 0.65 | 193.87 |
| 5 | Axis Bank Apps | 10.19 | 1697.23 | 37.00 | 217.00 | 0.03 | 3.00 | 0.00 | 0.00 | 47.38 | 1916.44 |
| 6 | Bajaj Finserv | 9.12 | 1189.82 | 0.00 | 0.00 | 0.00 | 0.00 | 0.00 | 0.00 | 9.12 | 1189.82 |
| 7 | Bank of Baroda Apps | 1.11 | 412.02 | 0.00 | 0.00 | 0.00 | 0.00 | 0.00 | 0.00 | 1.11 | 412.03 |
| 8 | Bank of India Apps | 0.22 | 69.86 | 0.00 | 0.00 | 0.00 | 0.00 | 0.00 | 0.00 | 0.22 | 69.87 |
| 9 | BHIM | 22.96 | 7209.87 | 0.00 | 0.00 | 0.00 | 0.00 | 0.00 | 0.00 | 22.96 | 7209.87 |
| 10 | BPAYWALLET | 0.06 | 9.65 | 0.00 | 0.00 | 0.00 | 0.00 | 0.00 | 0.00 | 0.06 | 9.65 |
| 11 | Canara Bank Apps | 1.48 | 431.27 | 0.00 | 0.00 | 0.00 | 0.00 | 0.00 | 0.00 | 1.48 | 431.27 |
| 12 | Central Bank of India Apps | 0.43 | 95.52 | 0.00 | 0.00 | 0.00 | 0.00 | 0.00 | 0.00 | 0.43 | 95.58 |
| 13 | Citi Bank Apps | 0.09 | 55.38 | 0.00 | 0.00 | 0.00 | 0.00 | 0.00 | 0.00 | 0.09 | 55.38 |
| 14 | City Union Bank Apps | 0.06 | 20.02 | 0.00 | 0.00 | 0.00 | 0.00 | 0.00 | 0.00 | 0.06 | 20.02 |
| 15 | Cointab | 0.01 | 4.24 | 0.00 | 0.00 | 0.00 | 0.00 | 0.00 | 0.00 | 0.01 | 4.24 |
| 16 | Cred | 61.04 | 23426.74 | 0.00 | 0.00 | 0.00 | 0.00 | 0.00 | 0.00 | 61.04 | 23426.74 |
| 17 | DBS Digibank Apps | 0.42 | 174.75 | 0.00 | 0.00 | 0.00 | 0.00 | 0.00 | 0.00 | 0.42 | 174.75 |
| 18 | Deutsche Bank Apps | 1.89 | 174.25 | 0.00 | 0.00 | 0.00 | 0.00 | 0.00 | 0.00 | 1.89 | 174.27 |
| 19 | DHANI | 0.04 | 7.55 | 0.00 | 0.00 | 0.00 | 0.00 | 0.00 | 0.00 | 0.04 | 7.55 |
| 20 | Dhanlaxmi Bank Apps | 0.01 | 2.93 | 0.00 | 0.00 | 0.00 | 0.00 | 0.00 | 0.00 | 0.01 | 2.93 |
| 21 | Equitas Small Finance Bank Apps | 0.03 | 16.31 | 0.00 | 0.00 | 0.00 | 0.00 | 0.00 | 0.00 | 0.03 | 16.31 |
| 22 | FAM | 13.78 | 166.50 | 0.00 | 0.00 | 0.00 | 0.00 | 0.00 | 0.00 | 13.78 | 166.50 |
| 23 | Fave | 0.02 | 1.68 | 0.00 | 0.00 | 0.00 | 0.00 | 0.00 | 0.00 | 0.02 | 1.68 |
| 24 | Federal Bank Apps | 5.12 | 643.60 | 0.00 | 0.00 | 0.00 | 0.00 | 0.00 | 0.00 | 5.12 | 643.62 |
| 25 | Fino Payments bank Apps | 0.09 | 6.60 | 0.00 | 0.00 | 0.00 | 0.00 | 0.00 | 0.00 | 0.09 | 6.60 |
| 26 | Google Pay | 3274.69 | 497748.17 | 0.00 | 0.00 | 0.00 | 0.00 | 0.00 | 0.00 | 3274.69 | 497748.17 |
| 27 | Groww | 0.47 | 287.97 | 0.00 | 0.00 | 0.00 | 0.00 | 0.00 | 0.00 | 0.47 | 287.97 |
| 28 | HDFC Bank Apps | 16.07 | 3979.33 | 0.00 | 0.00 | 0.00 | 3.00 | 0.00 | 0.00 | 16.07 | 3982.69 |
| 29 | HSBC Bank Apps | 0.14 | 87.42 | 0.00 | 0.00 | 0.00 | 0.00 | 0.00 | 0.00 | 0.14 | 87.50 |
| 30 | ICICI Bank Apps | 33.59 | 9965.41 | 5.23 | 380.00 | 5.09 | 6755.00 | 0.00 | 0.00 | 43.92 | 17101.09 |
| 31 | IDBI Bank Apps | 0.08 | 34.64 | 0.00 | 0.00 | 0.00 | 0.00 | 0.00 | 0.00 | 0.08 | 34.64 |
| 32 | IDFC Bank Apps | 8.52 | 1688.60 | 0.00 | 0.00 | 0.04 | 7.00 | 0.00 | 0.00 | 8.56 | 1696.01 |
| 33 | India Post Payments Bank Apps | 5.04 | 775.77 | 0.00 | 0.00 | 0.00 | 0.00 | 0.00 | 0.00 | 5.04 | 775.77 |
| 34 | Indian Bank Apps | 0.28 | 80.31 | 0.00 | 0.00 | 0.00 | 4.00 | 0.00 | 0.00 | 0.28 | 84.07 |
| 35 | Indian Overseas Bank Apps | 0.04 | 10.50 | 0.00 | 0.00 | 0.00 | 0.00 | 0.00 | 0.00 | 0.04 | 10.50 |
| 36 | IndusInd Bank Apps | 0.81 | 886.10 | 0.00 | 0.00 | 0.00 | 0.00 | 0.00 | 0.00 | 0.81 | 886.10 |
| 37 | Jammu and Kashmir Bank Apps | 0.01 | 2.00 | 0.00 | 0.00 | 0.00 | 0.00 | 0.00 | 0.00 | 0.01 | 2.00 |
| 38 | Jio Payments Bank Apps | 1.56 | 119.80 | 0.00 | 0.00 | 0.00 | 0.00 | 0.00 | 0.00 | 1.56 | 119.80 |
| 39 | Jupiter | 2.94 | 415.04 | 0.00 | 0.00 | 0.00 | 0.00 | 0.00 | 0.00 | 2.94 | 415.04 |
| 40 | Akudo & Muvin (Livquik) | 0.18 | 6.62 | 0.00 | 0.00 | 0.00 | 0.00 | 0.00 | 0.00 | 0.18 | 6.62 |
| 41 | Karnataka Bank Apps | 0.63 | 127.13 | 0.00 | 0.00 | 0.00 | 0.00 | 0.00 | 0.00 | 0.63 | 127.13 |
| 42 | Karur Vysya Bank Apps | 0.04 | 13.65 | 0.00 | 0.00 | 0.00 | 0.00 | 0.00 | 0.00 | 0.04 | 13.65 |
| 43 | Kotak Mahindra Bank Apps | 16.31 | 3139.04 | 0.00 | 0.00 | 0.00 | 0.00 | 0.00 | 0.00 | 16.31 | 3139.05 |
| 44 | MakeMyTrip | 0.02 | 8.01 | 0.00 | 0.00 | 0.00 | 0.00 | 0.00 | 0.00 | 0.02 | 8.01 |
| 45 | Mobikwik | 3.59 | 997.92 | 0.00 | 0.00 | 0.00 | 0.00 | 0.00 | 0.00 | 3.59 | 997.92 |
| 46 | NSDL Payments Bank Apps | 0.02 | 3.28 | 0.00 | 0.00 | 0.00 | 0.00 | 0.00 | 0.00 | 0.02 | 3.28 |
| 47 | OMNI | 0.39 | 10.10 | 0.00 | 0.00 | 0.00 | 0.00 | 0.00 | 0.00 | 0.39 | 10.10 |
| 48 | Paytm Payments Bank App | 1229.38 | 142291.76 | 3.95 | 7.00 | 0.56 | 887.00 | 108.39 | 21658.49 | 1342.28 | 164843.79 |
| 49 | PhonePe | 4499.20 | 757276.68 | 0.00 | 0.00 | 0.00 | 0.00 | 0.00 | 0.00 | 4499.20 | 757276.68 |
| 50 | PINELABS | 0.06 | 3.25 | 0.00 | 0.00 | 0.00 | 0.00 | 0.00 | 0.00 | 0.06 | 3.25 |
| 51 | Punjab National Bank Apps | 1.10 | 177.63 | 0.00 | 0.00 | 0.00 | 0.00 | 0.00 | 0.00 | 1.10 | 177.69 |
| 52 | Punjab Sind Bank Apps | 0.04 | 13.71 | 0.00 | 0.00 | 0.00 | 0.00 | 0.00 | 0.00 | 0.04 | 13.71 |
| 53 | RBL Bank Apps | 1.06 | 484.53 | 0.00 | 0.00 | 0.18 | 5.00 | 0.00 | 0.00 | 1.24 | 489.36 |
| 54 | RBLBANK | 0.01 | 0.06 | 0.00 | 0.00 | 0.00 | 0.00 | 0.00 | 0.00 | 0.01 | 0.06 |
| 55 | Samsung Pay | 5.83 | 535.16 | 0.00 | 0.00 | 0.00 | 0.00 | 0.00 | 0.00 | 5.83 | 535.16 |
| 56 | slice | 0.83 | 194.68 | 0.00 | 0.00 | 0.00 | 0.00 | 0.00 | 0.00 | 0.83 | 194.68 |
| 57 | South Indian Bank Apps | 0.25 | 71.46 | 0.00 | 0.00 | 0.00 | 0.00 | 0.00 | 0.00 | 0.25 | 71.46 |
| 58 | Standard Chartered Bank Apps | 0.15 | 91.48 | 0.00 | 0.00 | 0.00 | 0.00 | 0.00 | 0.00 | 0.15 | 91.48 |
| 59 | State Bank of India Apps | 4.48 | 1969.72 | 0.00 | 0.00 | 0.01 | 0.00 | 0.00 | 0.00 | 4.48 | 1969.95 |
| 60 | Tamilnad Mercantile Bank Apps | 0.07 | 14.83 | 0.00 | 0.00 | 0.00 | 0.00 | 0.00 | 0.00 | 0.07 | 14.83 |
| 61 | TataNeu | 0.15 | 19.28 | 0.00 | 0.00 | 0.00 | 0.00 | 0.00 | 0.00 | 0.15 | 19.28 |
| 62 | UCO Bank Apps | 0.36 | 118.26 | 0.00 | 0.00 | 0.00 | 0.00 | 0.00 | 0.00 | 0.36 | 118.26 |
| 63 | Ultracash | 0.01 | 1.13 | 0.00 | 0.00 | 0.00 | 0.00 | 0.00 | 0.00 | 0.01 | 1.13 |
| 64 | Union Bank Apps | 0.76 | 306.93 | 0.00 | 0.00 | 0.00 | 0.00 | 0.00 | 0.00 | 0.76 | 306.93 |
| 65 | Utkarsh Small Finance Bank Apps | 0.02 | 6.81 | 0.00 | 0.00 | 0.00 | 0.00 | 0.00 | 0.00 | 0.02 | 6.81 |
| 66 | 15.98 | 1477.06 | 0.00 | 0.00 | 0.00 | 0.00 | 0.00 | 0.00 | 15.98 | 1477.06 | |
| 67 | Yes Bank Apps | 42.21 | 12934.66 | 0.00 | 0.00 | 0.44 | 72.00 | 0.00 | 0.00 | 42.65 | 13006.24 |
| 68 | Zomato | 0.01 | 0.43 | 0.00 | 0.00 | 0.00 | 0.00 | 0.00 | 0.00 | 0.01 | 0.43 |
| 69 | Others | 0.03 | 10.98 | 0.00 | 0.00 | 0.00 | 0.00 | 0.00 | 0.00 | 0.03 | 10.98 |
Note:-
| UPI P2P and P2M Transactions | ||||||
|---|---|---|---|---|---|---|
| Month | Total | P2P | P2M | |||
| Volume (Mn) | Value (Cr) | Volume (Mn) | Value (Cr) | Volume (Mn) | Value (Cr) | |
| May'23 | 9,415.19 | 14,89,145.50 | 4,045.48 | 11,45,072.32 | 5,369.70 | 3,44,073.18 |

| UPI Payer PSP Performance (May'23) | |||||
|---|---|---|---|---|---|
| Sr. No. | Payer PSP | Total Volume (In Mn) | Approved % | BD % | TD % |
| 1 | Yes Bank Ltd | 3,322.19 | 98.77% | 1.22% | 0.00% |
| 2 | ICICI Bank | 1,732.56 | 98.78% | 1.21% | 0.00% |
| 3 | Axis Bank Ltd | 1,340.63 | 98.51% | 1.48% | 0.00% |
| 4 | Paytm Payments Bank | 1,257.01 | 98.16% | 1.83% | 0.01% |
| 5 | State Bank Of India | 1,019.30 | 98.72% | 1.27% | 0.00% |
| 6 | HDFC Bank Ltd | 773.58 | 98.74% | 1.26% | 0.00% |
| 7 | Kotak Mahindra Bank | 16.61 | 98.15% | 1.85% | 0.00% |
| 8 | Fampay (PPI) | 13.98 | 98.55% | 1.45% | 0.00% |
| 9 | Airtel Payments Bank | 9.40 | 97.47% | 2.51% | 0.02% |
| 10 | IDFC FIRST Bank | 8.71 | 98.76% | 1.24% | 0.00% |
| 11 | Federal Bank | 5.35 | 95.86% | 2.03% | 2.11% |
| 12 | India Post Payment Bank | 5.11 | 98.48% | 1.51% | 0.01% |
| 13 | RBL Bank | 2.12 | 98.56% | 1.44% | 0.00% |
| 14 | Deutsche Bank | 1.89 | 99.94% | 0.06% | 0.00% |
| 15 | Jio Payments Bank | 1.63 | 95.92% | 3.70% | 0.38% |
| UPI Payee PSP Performance (May'23) | |||||
|---|---|---|---|---|---|
| Sr. No. | Payee PSP | Total Volume (In Mn) | Approved % | BD % | TD % |
| 1 | Yes Bank Ltd | 3,328.92 | 99.80% | 0.18% | 0.02% |
| 2 | Paytm Payments Bank | 2,250.43 | 99.73% | 0.26% | 0.01% |
| 3 | Axis Bank Ltd | 1,169.78 | 99.41% | 0.57% | 0.02% |
| 4 | ICICI Bank | 1,053.11 | 99.23% | 0.68% | 0.09% |
| 5 | HDFC Bank Ltd | 439.53 | 99.27% | 0.69% | 0.04% |
| 6 | State Bank Of India | 398.39 | 99.45% | 0.49% | 0.06% |
| 7 | Federal Bank | 154.48 | 98.81% | 1.00% | 0.18% |
| 8 | IndusInd Bank | 47.25 | 98.23% | 0.88% | 0.89% |
| 9 | Kotak Mahindra Bank | 40.28 | 99.32% | 0.55% | 0.12% |
| 10 | Cosmos Bank | 24.05 | 95.12% | 4.51% | 0.37% |
| 11 | RBL Bank | 28.27 | 99.66% | 0.33% | 0.02% |
| 12 | Airtel Payments Bank | 18.61 | 97.38% | 2.20% | 0.42% |
| 13 | IDFC FIRST Bank | 17.88 | 96.85% | 2.02% | 1.13% |
| 14 | Citibank | 9.97 | 99.25% | 0.71% | 0.04% |
| 15 | Canara Bank | 9.55 | 99.37% | 0.57% | 0.06% |
| UPI Merchant Category-wise Classification -May'23 (Arranged by Volume) | ||||
|---|---|---|---|---|
| Type | MCC | Description | Volume (in Mn) | Value (in Cr.) |
| High Transacting Categories | 5411 | Groceries and supermarkets | 1,003.54 | 29,411.79 |
| 5812 | Eating places and restaurants | 676.73 | 11,174.19 | |
| 4814 | Telecommunication services, including local and long distance calls, credit card calls, calls through use of magnetic stripe reading telephones and faxes | 526.06 | 10,499.40 | |
| 5816 | Digital Goods: Games | 325.68 | 8,116.78 | |
| 5814 | Fast food restaurants | 300.10 | 3,779.21 | |
| 5311 | Department stores | 268.30 | 5,799.48 | |
| 5541 | Service stations (with or without ancillary services) | 263.18 | 18,012.53 | |
| 5462 | Bakeries | 128.49 | 1,843.19 | |
| 5912 | Drug stores and pharmacies | 119.20 | 4,644.23 | |
| 6540 | Debit card to wallet credit (Wallet top up) | 98.25 | 5,547.62 | |
| Medium Transacting Categories | 5451 | Dairies | 83.84 | 1,630.22 |
| 4900 | Utilities electric, gas, water and sanitary | 75.76 | 9,236.43 | |
| 5813 | Drinking places (alcoholic beverages) bars, taverns, night-clubs, cocktail lounges and discothques | 68.33 | 2,848.07 | |
| 7299 | Miscellaneous personal services not elsewhere classified | 65.37 | 2,390.48 | |
| 7322 | Debt collection agencies | 59.85 | 45,479.77 | |
| 5331 | Variety stores | 52.24 | 3,060.45 | |
| 5262 | Online Marketplaces | 48.18 | 4,409.36 | |
| 6012 | Financial institutions merchandise and services | 42.93 | 12,230.02 | |
| 5137 | Mens, womens and childrens uniforms and commercial clothing | 39.95 | 4,453.98 | |
| 5732 | Electronics shops | 39.37 | 5,516.04 | |
| All Other Categories | 5422 | Freezer and locker meat provisioners | 37.45 | 1,236.17 |
| 5399 | Miscellaneous general merchandise | 36.01 | 3,634.42 | |
| 5441 | Candy, nut and confectionery shops | 35.48 | 636.36 | |
| 7230 | Beauty and barber shops | 31.68 | 1,014.12 | |
| 6211 | Securities brokers and dealers | 29.26 | 20,345.86 | |
| 4899 | Cable and other pay television services | 28.71 | 1,168.92 | |
| 4784 | Tolls and bridge fees | 26.89 | 1,990.11 | |
| 4121 | Taxi-cabs and limousines | 25.43 | 655.47 | |
| 9399 | Government services not elsewhere classified | 24.63 | 3,259.25 | |
| Others | 808.82 | 1,20,049.31 | ||
| Total | 5,369.70 | 3,44,073.18 | ||
| State-wise UPI Product Statistics* (May'23) | |||||
|---|---|---|---|---|---|
| Sr. No. | State / Union Territory | Volume (in Mn ) | Volume Contribution (%) | Value (in Cr.) | Value Contribution (%) |
| 1 | MAHARASHTRA | 1,859.62 | 19.75% | 2,58,141.08 | 17.33% |
| 2 | KARNATAKA | 797.62 | 8.47% | 1,18,039.69 | 7.93% |
| 3 | TELANGANA | 716.76 | 7.61% | 1,29,532.28 | 8.70% |
| 4 | UTTAR PRADESH | 612.76 | 6.51% | 94,729.13 | 6.36% |
| 5 | TAMIL NADU | 459.82 | 4.88% | 78,145.83 | 5.25% |
| 6 | MADHYA PRADESH | 397.53 | 4.22% | 59,740.76 | 4.01% |
| 7 | DELHI | 387.94 | 4.12% | 55,560.85 | 3.73% |
| 8 | RAJASTHAN | 382.58 | 4.06% | 63,055.85 | 4.23% |
| 9 | ANDHRA PRADESH | 300.20 | 3.19% | 64,986.38 | 4.36% |
| 10 | GUJARAT | 288.57 | 3.06% | 47,894.81 | 3.22% |
| 11 | BIHAR | 280.34 | 2.98% | 51,363.73 | 3.45% |
| 12 | WEST BENGAL | 263.52 | 2.80% | 48,233.44 | 3.24% |
| 13 | HARYANA | 231.21 | 2.46% | 36,868.32 | 2.48% |
| 14 | KERALA | 219.50 | 2.33% | 34,118.36 | 2.29% |
| 15 | ODISHA | 198.14 | 2.10% | 30,136.96 | 2.02% |
| 16 | PUNJAB | 129.87 | 1.38% | 23,478.73 | 1.58% |
| 17 | JHARKHAND | 93.45 | 0.99% | 14,415.31 | 0.97% |
| 18 | ASSAM | 90.18 | 0.96% | 14,937.13 | 1.00% |
| 19 | UTTARAKHAND | 85.32 | 0.91% | 11,994.84 | 0.81% |
| 20 | CHHATTISGARH | 80.75 | 0.86% | 11,514.29 | 0.77% |
| 21 | HIMACHAL PRADESH | 38.50 | 0.41% | 5,312.81 | 0.36% |
| 22 | JAMMU AND KASHMIR | 32.13 | 0.34% | 5,046.91 | 0.34% |
| 23 | GOA | 19.87 | 0.21% | 2,965.09 | 0.20% |
| 24 | CHANDIGARH | 18.42 | 0.20% | 2,496.89 | 0.17% |
| 25 | PUDUCHERRY | 10.06 | 0.11% | 1,508.72 | 0.10% |
| 26 | ARUNACHAL PRADESH | 7.22 | 0.08% | 1,332.48 | 0.09% |
| 27 | TRIPURA | 5.95 | 0.06% | 1,016.47 | 0.07% |
| 28 | DADRA & NAGAR HAVELI & DAMAN & DIU | 5.69 | 0.06% | 664.54 | 0.04% |
| 29 | MEGHALAYA | 4.40 | 0.05% | 839.74 | 0.06% |
| 30 | NAGALAND | 4.07 | 0.04% | 1,045.51 | 0.07% |
| 31 | SIKKIM | 3.79 | 0.04% | 719.96 | 0.05% |
| 32 | MIZORAM | 3.75 | 0.04% | 910.78 | 0.06% |
| 33 | MANIPUR | 2.70 | 0.03% | 669.27 | 0.04% |
| 34 | LADAKH | 1.72 | 0.02% | 412.84 | 0.03% |
| 35 | ANDAMAN & NICOBAR | 1.66 | 0.02% | 336.30 | 0.02% |
| 36 | LAKSHADWEEP | 0.08 | 0.00% | 21.79 | 0.00% |
| 37 | UNCLASSIFIED# | 1,379.48 | 14.65% | 2,16,957.59 | 14.57% |
| UPI Top 50 Member Remitter Performance (Apr'23) | |||||||
|---|---|---|---|---|---|---|---|
| Sr. No. | UPI Remitter Banks (Apr-2023) | Total Volume (In Mn) | Approved % | BD % | TD% | Total Debit Reversal Count (In Mn) | Debit Reversal Success % |
| 1 | State Bank of India | 2298.06 | 93.37% | 4.69% | 1.94% | 8.38 | 95.68% |
| 2 | HDFC BANK LTD | 797.45 | 96.04% | 3.61% | 0.35% | 3.29 | 95.17% |
| 3 | Bank of Baroda | 589.97 | 93.37% | 6.35% | 0.28% | 1.98 | 98.94% |
| 4 | Union Bank of India | 558.92 | 94.06% | 4.40% | 1.54% | 3.01 | 66.96% |
| 5 | ICICI Bank | 456.92 | 96.67% | 3.02% | 0.31% | 3.06 | 63.74% |
| 6 | Punjab National Bank | 429.32 | 94.35% | 4.53% | 1.12% | 2.36 | 85.70% |
| 7 | Kotak Mahindra Bank | 420.44 | 94.51% | 4.95% | 0.54% | 3.72 | 89.86% |
| 8 | Axis Bank Ltd | 419.45 | 95.75% | 4.12% | 0.13% | 1.39 | 77.12% |
| 9 | Canara Bank | 410.23 | 94.14% | 5.33% | 0.53% | 4.63 | 80.40% |
| 10 | Paytm Payments Bank | 403.18 | 96.01% | 3.92% | 0.07% | 1.04 | 99.58% |
| 11 | Bank of India | 298.42 | 95.51% | 4.11% | 0.38% | 1.57 | 71.04% |
| 12 | Indian Bank | 241.65 | 94.22% | 5.42% | 0.36% | 1.20 | 78.64% |
| 13 | Airtel Payments Bank | 203.03 | 84.88% | 14.70% | 0.43% | 0.70 | 88.24% |
| 14 | India Post Payment Bank | 170.07 | 68.79% | 19.69% | 11.52% | 0.60 | 67.74% |
| 15 | Central Bank Of India | 143.94 | 89.12% | 8.58% | 2.30% | 2.05 | 59.35% |
| 16 | Federal Bank | 140.58 | 95.05% | 4.84% | 0.11% | 0.49 | 90.07% |
| 17 | Indian Overseas Bank | 114.60 | 93.86% | 5.10% | 1.04% | 0.80 | 76.12% |
| 18 | IDBI Bank Limited | 108.52 | 93.92% | 4.05% | 2.03% | 0.66 | 67.01% |
| 19 | UCO Bank | 106.14 | 93.31% | 5.79% | 0.90% | 0.51 | 74.33% |
| 20 | Bank of Maharashtra | 101.34 | 92.88% | 4.44% | 2.68% | 0.57 | 73.06% |
| 21 | INDUSIND BANK | 86.38 | 93.87% | 5.50% | 0.63% | 0.29 | 93.93% |
| 22 | Yes Bank Ltd | 83.98 | 94.30% | 5.18% | 0.53% | 0.32 | 0.00% |
| 23 | Fino Payments Bank Limited | 77.30 | 81.79% | 15.43% | 2.78% | 0.38 | 79.01% |
| 24 | Karnataka Bank | 73.39 | 90.95% | 6.77% | 2.28% | 0.58 | 36.72% |
| 25 | IDFC FIRST Bank | 65.41 | 93.84% | 5.29% | 0.87% | 0.38 | 42.68% |
| 26 | Karur Vysya Bank | 45.52 | 93.32% | 6.30% | 0.38% | 0.18 | 93.95% |
| 27 | Bandhan Bank | 40.20 | 83.17% | 11.83% | 5.00% | 0.19 | 17.93% |
| 28 | South Indian Bank | 35.35 | 95.40% | 4.38% | 0.22% | 0.19 | 97.12% |
| 29 | Jammu and Kashmir Bank | 28.65 | 85.16% | 6.51% | 8.33% | 0.16 | 53.22% |
| 30 | City Union Bank | 26.60 | 92.01% | 7.23% | 0.75% | 0.14 | 82.07% |
| 31 | Ujjivan Small Finance Bank | 25.30 | 93.44% | 6.05% | 0.52% | 0.15 | 55.64% |
| 32 | AU small Finance Bank | 25.25 | 94.73% | 5.16% | 0.11% | 0.09 | 0.03% |
| 33 | Equitas Bank | 24.78 | 89.64% | 9.84% | 0.51% | 0.11 | 94.37% |
| 34 | Punjab and Sind Bank | 24.18 | 72.89% | 12.14% | 14.97% | 0.10 | 74.71% |
| 35 | Tamilnad Mercantile Bank | 22.61 | 93.27% | 6.31% | 0.42% | 0.08 | 56.86% |
| 36 | DBS Bank India Limited | 22.47 | 95.48% | 4.10% | 0.42% | 0.02 | 97.00% |
| 37 | Standard Chartered | 20.58 | 95.48% | 2.64% | 1.89% | 0.10 | 96.28% |
| 38 | Citibank | 18.93 | 96.10% | 3.34% | 0.56% | 0.07 | 94.85% |
| 39 | Andhra Pradesh Grameena Vikas Bank | 18.59 | 81.16% | 12.74% | 6.10% | 0.21 | 14.73% |
| 40 | Pragathi Krishna Gramin Bank | 17.59 | 89.02% | 10.14% | 0.84% | 0.21 | 56.54% |
| 41 | Maharashtra Gramin Bank | 17.58 | 79.86% | 14.29% | 5.85% | 0.22 | 17.55% |
| 42 | Saraswat Bank | 17.41 | 94.12% | 4.83% | 1.05% | 0.07 | 79.27% |
| 43 | ESAF Small Finance Bank Ltd. | 16.00 | 73.35% | 25.56% | 1.09% | 0.04 | 96.76% |
| 44 | Kerala Gramin Bank | 15.48 | 90.69% | 8.76% | 0.55% | 0.06 | 85.07% |
| 45 | Rajasthan Marudhara Gramin Bank | 15.25 | 77.19% | 17.48% | 5.33% | 0.22 | 10.80% |
| 46 | Andhra Pragathi Grameena Bank | 12.27 | 55.23% | 32.09% | 12.68% | 0.35 | 6.53% |
| 47 | RBL | 12.05 | 93.08% | 6.36% | 0.55% | 0.06 | 72.51% |
| 48 | Sarva Haryana Gramin Bank | 11.59 | 91.79% | 7.34% | 0.87% | 0.11 | 5.09% |
| 49 | Baroda UP Gramin Bank | 11.10 | 85.69% | 10.93% | 3.38% | 0.05 | 73.44% |
| 50 | Fincare Small Finance Bank Ltd | 9.21 | 84.10% | 11.08% | 4.82% | 0.02 | 28.26% |
| UPI Beneficiary Banks - Top 50 Banks (Apr'23) | |||||||
|---|---|---|---|---|---|---|---|
| Sr.No. | UPI Beneficiary Banks (Apr-2023) | Total Volume (In Mn) | Approved % | BD% | TD% | Deemed Approved % | |
| 1 | Paytm Payments Bank | 1973.67 | 99.73% | 0.23% | 0.04% | 0.00% | |
| 2 | Yes Bank Ltd | 1914.76 | 99.98% | 0.03% | 0.04% | 0.01% | |
| 3 | State Bank of India | 966.28 | 98.07% | 0.21% | 1.48% | 0.23% | |
| 4 | Axis Bank Ltd | 636.48 | 99.87% | 0.09% | 0.01% | 0.03% | |
| 5 | ICICI Bank | 590.66 | 99.57% | 0.24% | 0.10% | 0.08% | |
| 6 | HDFC BANK LTD | 443.16 | 99.23% | 0.50% | 0.23% | 0.04% | |
| 7 | Bank of Baroda | 269.46 | 99.50% | 0.14% | 0.16% | 0.19% | |
| 8 | Union Bank of India | 260.41 | 99.04% | 0.16% | 0.74% | 0.06% | |
| 9 | Punjab National Bank | 203.59 | 99.04% | 0.34% | 0.39% | 0.24% | |
| 10 | Federal Bank | 202.49 | 99.70% | 0.21% | 0.05% | 0.05% | |
| 11 | Canara Bank | 202.15 | 99.14% | 0.11% | 0.30% | 0.45% | |
| 12 | Kotak Mahindra Bank | 198.71 | 97.46% | 0.39% | 1.65% | 0.49% | |
| 13 | Bank of India | 147.23 | 99.25% | 0.23% | 0.48% | 0.04% | |
| 14 | Indian Bank | 119.18 | 99.18% | 0.18% | 0.41% | 0.22% | |
| 15 | Airtel Payments Bank | 113.09 | 99.23% | 0.39% | 0.17% | 0.21% | |
| 16 | INDUSIND BANK | 85.37 | 99.20% | 0.20% | 0.46% | 0.14% | |
| 17 | Central Bank Of India | 71.27 | 98.29% | 0.58% | 0.69% | 0.44% | |
| 18 | India Post Payment Bank | 67.58 | 92.60% | 0.94% | 6.26% | 0.20% | |
| 19 | Indian Overseas Bank | 57.66 | 97.84% | 0.75% | 1.34% | 0.07% | |
| 20 | UCO Bank | 52.37 | 98.25% | 0.69% | 0.77% | 0.30% | |
| 21 | IDBI Bank Limited | 51.34 | 98.23% | 0.38% | 1.35% | 0.04% | |
| 22 | IDFC FIRST Bank | 44.42 | 97.52% | 0.93% | 1.01% | 0.54% | |
| 23 | Bank of Maharashtra | 42.01 | 96.54% | 0.21% | 2.95% | 0.30% | |
| 24 | Karnataka Bank | 33.81 | 96.15% | 0.69% | 2.13% | 1.02% | |
| 25 | Karur Vysya Bank | 26.37 | 99.28% | 0.42% | 0.26% | 0.04% | |
| 26 | RBL | 35.25 | 99.65% | 0.60% | 0.23% | 0.09% | |
| 27 | Fino Payments Bank Limited | 25.50 | 97.00% | 0.84% | 1.99% | 0.18% | |
| 28 | South Indian Bank | 24.07 | 99.54% | 0.20% | 0.19% | 0.06% | |
| 29 | Bandhan Bank | 23.65 | 93.77% | 0.33% | 5.76% | 0.14% | |
| 30 | AU small Finance Bank | 18.18 | 98.39% | 1.34% | 0.08% | 0.19% | |
| 31 | City Union Bank | 14.52 | 98.36% | 1.08% | 0.49% | 0.07% | |
| 32 | Tamilnad Mercantile Bank | 14.05 | 99.17% | 0.26% | 0.29% | 0.29% | |
| 33 | Ujjivan Small Finance Bank | 13.58 | 98.55% | 0.29% | 0.33% | 0.83% | |
| 34 | CITI | 12.49 | 99.31% | 0.00% | 0.34% | 0.34% | |
| 35 | Equitas Bank | 11.69 | 97.49% | 1.98% | 0.40% | 0.13% | |
| 36 | Jammu and Kashmir Bank | 11.47 | 94.25% | 0.43% | 5.24% | 0.08% | |
| 37 | Punjab and Sind Bank | 10.98 | 87.57% | 0.17% | 12.19% | 0.07% | |
| 38 | Pragathi Krishna Gramin Bank | 9.78 | 98.38% | 0.27% | 0.29% | 1.07% | |
| 39 | Kerala Gramin Bank | 9.29 | 99.03% | 0.20% | 0.20% | 0.57% | |
| 40 | Andhra Pradesh Grameena Vikas Bank | 9.21 | 95.46% | 0.91% | 2.61% | 1.01% | |
| 41 | DBS Bank India Limited | 9.13 | 97.78% | 1.26% | 0.49% | 0.47% | |
| 42 | Cosmos Bank | 8.23 | 98.97% | 0.27% | 0.44% | 0.32% | |
| 43 | Maharashtra Gramin Bank | 8.21 | 96.55% | 0.65% | 2.61% | 0.18% | |
| 44 | ESAF Small Finance Bank Ltd. | 7.27 | 99.05% | 0.12% | 0.77% | 0.06% | |
| 45 | Baroda UP Gramin Bank | 7.15 | 95.43% | 2.29% | 2.06% | 0.23% | |
| 46 | Rajasthan Marudhara Gramin Bank | 7.13 | 96.52% | 0.31% | 2.06% | 1.12% | |
| 47 | Saraswat Bank | 6.39 | 98.39% | 0.21% | 1.29% | 0.10% | |
| 48 | Andhra Pragathi Grameena Bank | 5.96 | 86.81% | 0.34% | 10.61% | 2.24% | |
| 49 | Sarva Haryana Gramin Bank | 5.53 | 96.49% | 0.47% | 0.79% | 2.25% | |
| 50 | Baroda Rajasthan Kshetriya Gramin Bank | 4.81 | 94.55% | 2.61% | 1.17% | 1.67% | |
| UPI Apps (Apr'23) | |||||||||||
|---|---|---|---|---|---|---|---|---|---|---|---|
| Sr.No. | Application Name | Customer Initiated Transactions | B2C Transactions | B2B Transactions | On-us Transactions | Total | |||||
| Volume (Mn) | Value (Cr) | Volume (Mn) | Value (Cr) | Volume (Mn) | Value (Cr) | Volume (Mn) | Value (Cr) | Volume (Mn) | Value (Cr) | ||
| 1 | Airtel Payments Bank Apps | 9.04 | 640.16 | 0.00 | 0.00 | 0.00 | 0.00 | 0.00 | 0.06 | 9.04 | 640.22 |
| 2 | Allahabad Bank Apps | 0.03 | 8.96 | 0.00 | 0.00 | 0.00 | 0.00 | 0.00 | 0.00 | 0.03 | 8.96 |
| 3 | Amazon Pay | 53.44 | 5,351.07 | 0.00 | 0.00 | 0.00 | 0.00 | 0.00 | 0.00 | 53.44 | 5,351.07 |
| 4 | AU Small Finance Bank Apps | 0.63 | 184.93 | 0.00 | 0.00 | 0.00 | 0.00 | 0.00 | 0.00 | 0.63 | 184.93 |
| 5 | Axis Bank Apps | 9.36 | 1,584.45 | 42.35 | 282.63 | 0.03 | 2.81 | 0.00 | 0.00 | 51.74 | 1,869.89 |
| 6 | Bajaj Finserv | 7.68 | 1,053.08 | 0.00 | 0.00 | 0.00 | 0.00 | 0.00 | 0.00 | 7.68 | 1,053.08 |
| 7 | Bandhan Bank Apps | 0.01 | 1.44 | 0.00 | 0.00 | 0.00 | 0.00 | 0.00 | 0.00 | 0.01 | 1.44 |
| 8 | Bank of Baroda Apps | 1.06 | 392.74 | 0.00 | 0.00 | 0.00 | 0.00 | 0.00 | 0.00 | 1.06 | 392.74 |
| 9 | Bank of India Apps | 0.22 | 66.93 | 0.00 | 0.00 | 0.00 | 0.00 | 0.00 | 0.00 | 0.22 | 66.93 |
| 10 | Bank of Maharashtra Apps | 0.06 | 19.83 | 0.00 | 0.00 | 0.00 | 0.00 | 0.00 | 0.00 | 0.06 | 19.83 |
| 11 | BHIM | 23.77 | 7,368.61 | 0.00 | 0.00 | 0.00 | 0.00 | 0.00 | 0.00 | 23.77 | 7,368.61 |
| 12 | BPAYWALLET | 0.05 | 9.91 | 0.00 | 0.00 | 0.00 | 0.00 | 0.00 | 0.00 | 0.05 | 9.91 |
| 13 | Canara Bank Apps | 1.40 | 383.46 | 0.00 | 0.00 | 0.00 | 0.00 | 0.00 | 0.00 | 1.40 | 383.46 |
| 14 | Central Bank of India Apps | 0.41 | 91.19 | 0.00 | 0.00 | 0.00 | 0.08 | 0.00 | 0.00 | 0.41 | 91.27 |
| 15 | Citi Bank Apps | 0.10 | 58.17 | 0.00 | 0.00 | 0.00 | 0.00 | 0.00 | 0.00 | 0.10 | 58.17 |
| 16 | City Union Bank Apps | 0.06 | 18.31 | 0.00 | 0.00 | 0.00 | 0.00 | 0.00 | 0.00 | 0.06 | 18.31 |
| 17 | Cointab | 0.02 | 10.61 | 0.00 | 0.00 | 0.00 | 0.00 | 0.00 | 0.00 | 0.02 | 10.61 |
| 18 | Cred | 45.70 | 20,729.56 | 0.00 | 0.00 | 0.00 | 0.00 | 0.00 | 0.00 | 45.70 | 20,729.56 |
| 19 | DBS Digibank Apps | 0.41 | 173.13 | 0.00 | 0.00 | 0.00 | 0.00 | 0.00 | 0.00 | 0.41 | 173.13 |
| 20 | Deutsche Bank Apps | 1.65 | 142.80 | 0.00 | 0.00 | 0.00 | 0.86 | 0.00 | 0.00 | 1.65 | 143.66 |
| 21 | DHANI | 0.08 | 9.21 | 0.00 | 0.00 | 0.00 | 0.00 | 0.00 | 0.00 | 0.08 | 9.21 |
| 22 | Dhanlaxmi Bank Apps | 0.01 | 2.80 | 0.00 | 0.00 | 0.00 | 0.00 | 0.00 | 0.00 | 0.01 | 2.80 |
| 23 | Equitas Small Finance Bank Apps | 0.02 | 13.86 | 0.00 | 0.00 | 0.00 | 0.00 | 0.00 | 0.00 | 0.02 | 13.86 |
| 24 | FAM | 11.78 | 146.58 | 0.00 | 0.00 | 0.00 | 0.00 | 0.00 | 0.00 | 11.78 | 146.58 |
| 25 | Fave | 0.03 | 3.27 | 0.00 | 0.00 | 0.00 | 0.00 | 0.00 | 0.00 | 0.03 | 3.27 |
| 26 | Federal Bank Apps | 5.18 | 624.64 | 0.00 | 0.00 | 0.00 | 0.00 | 0.00 | 0.00 | 5.18 | 624.64 |
| 27 | Fino Payments bank Apps | 0.08 | 5.67 | 0.00 | 0.00 | 0.00 | 0.00 | 0.00 | 0.00 | 0.08 | 5.67 |
| 28 | Google Pay | 3,109.24 | 474,049.90 | 0.00 | 0.00 | 0.00 | 0.00 | 0.00 | 0.00 | 3,109.24 | 474,049.90 |
| 29 | Groww | 0.11 | 80.85 | 0.00 | 0.00 | 0.00 | 0.00 | 0.00 | 0.00 | 0.11 | 80.85 |
| 30 | HDFC Bank Apps | 14.48 | 3,685.33 | 0.00 | 0.00 | 0.00 | 16.48 | 0.00 | 0.00 | 14.48 | 3,701.81 |
| 31 | HSBC Bank Apps | 0.14 | 90.10 | 0.00 | 0.03 | 0.00 | 0.00 | 0.00 | 0.00 | 0.14 | 90.13 |
| 32 | ICICI Bank Apps | 30.69 | 8,941.59 | 5.34 | 323.96 | 5.95 | 7,439.02 | 0.00 | 0.00 | 41.98 | 16,704.57 |
| 33 | IDBI Bank Apps | 0.07 | 32.02 | 0.00 | 0.00 | 0.00 | 0.00 | 0.00 | 0.00 | 0.07 | 32.02 |
| 34 | IDFC Bank Apps | 11.96 | 2,274.12 | 0.00 | 0.00 | 0.71 | 591.19 | 0.00 | 0.00 | 12.66 | 2,865.32 |
| 35 | India Post Payments Bank Apps | 5.24 | 746.48 | 0.00 | 0.00 | 0.00 | 0.00 | 0.00 | 0.00 | 5.24 | 746.48 |
| 36 | Indian Bank Apps | 0.27 | 75.66 | 0.00 | 0.00 | 0.00 | 10.71 | 0.00 | 0.00 | 0.27 | 86.37 |
| 37 | Indian Overseas Bank Apps | 0.03 | 7.76 | 0.00 | 0.00 | 0.00 | 0.00 | 0.00 | 0.00 | 0.03 | 7.76 |
| 38 | IndusInd Bank Apps | 0.80 | 877.27 | 0.00 | 0.00 | 0.00 | 0.00 | 0.00 | 0.00 | 0.80 | 877.27 |
| 39 | Jio Payments Bank Apps | 1.49 | 112.21 | 0.00 | 0.00 | 0.00 | 0.00 | 0.00 | 0.00 | 1.49 | 112.21 |
| 40 | Jupiter | 2.72 | 380.27 | 0.00 | 0.00 | 0.00 | 0.00 | 0.00 | 0.00 | 2.72 | 380.27 |
| 41 | Akudo & Muvin (Livquik) | 0.11 | 4.25 | 0.00 | 0.00 | 0.00 | 0.00 | 0.00 | 0.00 | 0.11 | 4.25 |
| 42 | Karnataka Bank Apps | 0.51 | 110.35 | 0.00 | 0.00 | 0.00 | 0.00 | 0.00 | 0.00 | 0.51 | 110.35 |
| 43 | Karur Vysya Bank Apps | 0.04 | 14.19 | 0.00 | 0.00 | 0.00 | 0.00 | 0.00 | 0.00 | 0.04 | 14.19 |
| 44 | Kotak Mahindra Bank Apps | 13.98 | 2,845.64 | 0.00 | 0.00 | 0.00 | 0.01 | 0.00 | 0.00 | 13.98 | 2,845.65 |
| 45 | MakeMyTrip | 0.02 | 12.91 | 0.00 | 0.00 | 0.00 | 0.00 | 0.00 | 0.00 | 0.02 | 12.91 |
| 46 | Mobikwik | 3.48 | 923.59 | 0.00 | 0.00 | 0.00 | 0.00 | 0.00 | 0.00 | 3.48 | 923.59 |
| 47 | NSDL Payments Bank Apps | 0.02 | 3.42 | 0.00 | 0.00 | 0.00 | 0.00 | 0.00 | 0.00 | 0.02 | 3.42 |
| 48 | OMNI | 0.26 | 6.74 | 0.00 | 0.00 | 0.00 | 0.00 | 0.00 | 0.00 | 0.26 | 6.74 |
| 49 | Paytm Payments Bank App | 1,184.38 | 135,343.96 | 8.83 | 14.25 | 0.53 | 793.27 | 105.52 | 19,560.25 | 1,299.25 | 155,711.73 |
| 50 | PhonePe | 4,216.99 | 710,178.44 | 0.00 | 0.00 | 0.00 | 0.00 | 0.00 | 0.00 | 4,216.99 | 710,178.44 |
| 51 | PINELABS | 0.02 | 1.31 | 0.00 | 0.00 | 0.00 | 0.00 | 0.00 | 0.00 | 0.02 | 1.31 |
| 52 | Punjab National Bank Apps | 1.03 | 148.27 | 0.00 | 0.00 | 0.00 | 0.01 | 0.00 | 0.00 | 1.03 | 148.28 |
| 53 | Punjab Sind Bank Apps | 0.04 | 14.04 | 0.00 | 0.00 | 0.00 | 0.00 | 0.00 | 0.00 | 0.04 | 14.04 |
| 54 | RBL Bank Apps | 1.56 | 489.63 | 0.00 | 0.00 | 0.10 | 2.70 | 0.00 | 0.00 | 1.66 | 492.33 |
| 55 | Samsung Pay | 5.67 | 511.04 | 0.00 | 0.00 | 0.00 | 0.00 | 0.00 | 0.00 | 5.67 | 511.04 |
| 56 | Slash | 0.01 | 0.32 | 0.00 | 0.00 | 0.00 | 0.00 | 0.00 | 0.00 | 0.01 | 0.32 |
| 57 | slice | 0.66 | 170.62 | 0.00 | 0.00 | 0.00 | 0.00 | 0.00 | 0.00 | 0.66 | 170.62 |
| 58 | South Indian Bank Apps | 0.22 | 63.81 | 0.00 | 0.00 | 0.00 | 0.00 | 0.00 | 0.00 | 0.22 | 63.81 |
| 59 | Standard Chartered Bank Apps | 0.16 | 94.21 | 0.00 | 0.00 | 0.00 | 0.00 | 0.00 | 0.00 | 0.16 | 94.22 |
| 60 | State Bank of India Apps | 4.09 | 1,910.04 | 0.00 | 0.00 | 0.00 | 0.11 | 0.00 | 0.00 | 4.09 | 1,910.15 |
| 61 | Tamilnad Mercantile Bank Apps | 0.06 | 13.15 | 0.00 | 0.00 | 0.00 | 0.00 | 0.00 | 0.00 | 0.06 | 13.15 |
| 62 | TataNeu | 0.15 | 16.46 | 0.00 | 0.00 | 0.00 | 0.00 | 0.00 | 0.00 | 0.15 | 16.46 |
| 63 | UCO Bank Apps | 0.34 | 111.87 | 0.00 | 0.00 | 0.00 | 0.00 | 0.00 | 0.00 | 0.34 | 111.87 |
| 64 | Ultracash | 0.03 | 2.10 | 0.00 | 0.00 | 0.00 | 0.00 | 0.00 | 0.00 | 0.03 | 2.10 |
| 65 | Union Bank Apps | 0.74 | 301.17 | 0.00 | 0.00 | 0.00 | 0.00 | 0.00 | 0.00 | 0.74 | 301.17 |
| 66 | Utkarsh Small Finance Bank Apps | 0.02 | 6.43 | 0.00 | 0.00 | 0.00 | 0.00 | 0.00 | 0.00 | 0.02 | 6.43 |
| 67 | 14.83 | 1,319.01 | 0.00 | 0.00 | 0.00 | 0.00 | 0.00 | 0.00 | 14.83 | 1,319.01 | |
| 68 | Yes Bank Apps | 34.45 | 12,151.00 | 0.00 | 0.00 | 0.88 | 303.98 | 0.00 | 0.00 | 35.33 | 12,454.98 |
| 69 | Others | 0.03 | 8.54 | 0.00 | 0.00 | 0.00 | 0.00 | 0.00 | 0.00 | 0.03 | 8.54 |
Note:-
| UPI P2P and P2M Transactions | ||||||
|---|---|---|---|---|---|---|
| Month | Total | P2P | P2M | |||
| Volume (Mn) | Value (Cr) | Volume (Mn) | Value (Cr) | Volume (Mn) | Value (Cr) | |
| Apr'23 | 8,903.76 | 14,07,837.61 | 3,870.58 | 10,86,509.94 | 5,033.19 | 3,21,327.66 |


| UPI Payer PSP Performance (Apr'23) | |||||
|---|---|---|---|---|---|
| Sr. No. | Payer PSP | Total Volume (In Mn) | Approved % | BD % | TD % |
| 1 | Yes Bank Ltd | 3,144.79 | 98.73% | 1.27% | 0.00% |
| 2 | ICICI Bank | 1,460.93 | 98.80% | 1.20% | 0.00% |
| 3 | Axis Bank Ltd | 1,443.01 | 98.63% | 1.37% | 0.00% |
| 4 | Paytm Payments Bank | 1,210.88 | 98.58% | 1.40% | 0.01% |
| 5 | State Bank Of India | 939.75 | 98.80% | 1.19% | 0.01% |
| 6 | HDFC Bank Ltd | 715.30 | 98.84% | 1.16% | 0.00% |
| 7 | Kotak Mahindra Bank | 14.24 | 98.15% | 1.85% | 0.00% |
| 8 | IDFC FIRST Bank | 12.84 | 99.06% | 0.94% | 0.00% |
| 9 | FamPay PPI | 11.99 | 98.21% | 1.79% | 0.00% |
| 10 | Airtel Payments Bank | 9.41 | 96.07% | 3.89% | 0.04% |
| 11 | India Post Payment Bank | 5.32 | 98.47% | 1.53% | 0.00% |
| 12 | Federal Bank | 5.30 | 98.08% | 1.92% | 0.00% |
| 13 | RBL Bank | 2.42 | 98.79% | 1.21% | 0.00% |
| 14 | Deutsche Bank | 1.65 | 99.95% | 0.05% | 0.00% |
| 15 | Jio Payments Bank | 1.56 | 95.10% | 4.22% | 0.68% |
| UPI Payee PSP Performance (Apr'23) | |||||
|---|---|---|---|---|---|
| Sr. No. | Payee PSP | Total Volume (In Mn) | Approved % | BD % | TD % |
| 1 | Yes Bank Ltd | 3,179.83 | 99.75% | 0.21% | 0.04% |
| 2 | Paytm Payments Bank | 2,097.58 | 99.44% | 0.26% | 0.31% |
| 3 | Axis Bank Ltd | 1,109.13 | 99.28% | 0.68% | 0.04% |
| 4 | ICICI Bank | 1,003.20 | 99.48% | 0.47% | 0.05% |
| 5 | HDFC Bank Ltd | 407.42 | 99.13% | 0.82% | 0.05% |
| 6 | State Bank Of India | 379.74 | 99.25% | 0.48% | 0.27% |
| 7 | Federal Bank | 143.53 | 98.63% | 1.07% | 0.31% |
| 8 | IndusInd Bank | 43.48 | 97.73% | 1.27% | 1.00% |
| 9 | Kotak Mahindra Bank | 40.35 | 99.56% | 0.32% | 0.12% |
| 10 | RBL Bank | 30.12 | 99.68% | 0.21% | 0.11% |
| 11 | Cosmos Bank | 21.91 | 97.60% | 2.36% | 0.04% |
| 12 | Airtel Payments Bank | 19.93 | 98.83% | 0.64% | 0.53% |
| 13 | IDFC FIRST Bank | 18.84 | 95.43% | 2.32% | 2.25% |
| 14 | Citibank | 13.13 | 94.90% | 3.14% | 1.96% |
| 15 | Bank of Baroda | 8.50 | 87.11% | 0.38% | 12.52% |
| UPI Merchant Category-wise Classification -April'23 (Arranged by Volume) | ||||
|---|---|---|---|---|
| Type | MCC | Description | Volume (in Mn) | Value (in Cr.) |
| High Transacting Categories | 5411 | Groceries and supermarkets | 949.92 | 27,967.29 |
| 5812 | Eating places and restaurants | 619.14 | 10,208.54 | |
| 4814 | Telecommunication services, including local and long distance calls, credit card calls, calls through use of magnetic stripe reading telephones and faxes | 497.22 | 9,818.36 | |
| 5816 | Digital Goods: Games | 340.88 | 8,086.72 | |
| 5814 | Fast food restaurants | 278.07 | 3,486.52 | |
| 5311 | Department stores | 240.70 | 5,174.80 | |
| 5541 | Service stations (with or without ancillary services) | 237.72 | 16,450.29 | |
| 5912 | Drug stores and pharmacies | 117.08 | 4,429.68 | |
| 5462 | Bakeries | 117.00 | 1,657.14 | |
| 6540 | Debit card to wallet credit (Wallet top up) | 79.45 | 4,722.89 | |
| Medium Transacting Categories | 5451 | Dairies | 79.16 | 1,552.40 |
| 4900 | Utilities electric, gas, water and sanitary | 64.00 | 7,380.44 | |
| 5813 | Drinking places (alcoholic beverages) bars, taverns, night-clubs, cocktail lounges and discothques | 62.87 | 2,584.51 | |
| 7299 | Miscellaneous personal services not elsewhere classified | 59.64 | 2,147.52 | |
| 7322 | Debt collection agencies | 58.04 | 44,817.78 | |
| 5399 | Miscellaneous general merchandise | 52.79 | 4,964.33 | |
| 5331 | Variety stores | 50.49 | 2,986.13 | |
| 5137 | Mens, womens and childrens uniforms and commercial clothing | 41.02 | 4,765.99 | |
| 5262 | Online Marketplaces | 40.17 | 3,337.30 | |
| 6012 | Financial institutions merchandise and services | 37.98 | 11,826.16 | |
| All Other Categories | 5732 | Electronics shops | 36.65 | 5,135.00 |
| 5422 | Freezer and locker meat provisioners | 36.38 | 1,182.80 | |
| 5441 | Candy, nut and confectionery shops | 30.88 | 553.46 | |
| 7230 | Beauty and barber shops | 30.33 | 969.90 | |
| 4899 | Cable and other pay television services | 28.25 | 1,175.79 | |
| 6211 | Securities brokers and dealers | 27.62 | 19,613.99 | |
| 4784 | Tolls and bridge fees | 24.07 | 1,858.33 | |
| 4121 | Taxi-cabs and limousines | 23.46 | 592.95 | |
| 9399 | Government services not elsewhere classified | 23.46 | 3,297.00 | |
| Others | 748.76 | 1,08,583.65 | ||
| Total | 5,033.19 | 3,21,327.66 | ||
| State-wise UPI Product Statistics* (Apr'23) | |||||
|---|---|---|---|---|---|
| Sr. No. | State / Union Territory | Volume (in Mn ) | Volume Contribution (%) | Value (in Cr.) | Value Contribution (%) |
| 1 | MAHARASHTRA | 1,859.79 | 20.98% | 2,60,344.80 | 18.39% |
| 2 | KARNATAKA | 772.62 | 8.72% | 1,14,007.15 | 8.05% |
| 3 | TELANGANA | 683.07 | 7.71% | 1,21,761.16 | 8.60% |
| 4 | UTTAR PRADESH | 569.78 | 6.43% | 87,585.09 | 6.19% |
| 5 | TAMIL NADU | 433.99 | 4.90% | 73,484.77 | 5.19% |
| 6 | RAJASTHAN | 391.83 | 4.42% | 64,347.76 | 4.55% |
| 7 | MADHYA PRADESH | 375.53 | 4.24% | 56,076.31 | 3.96% |
| 8 | DELHI | 330.04 | 3.72% | 46,799.01 | 3.31% |
| 9 | GUJARAT | 280.81 | 3.17% | 46,154.94 | 3.26% |
| 10 | ANDHRA PRADESH | 279.96 | 3.16% | 59,444.05 | 4.20% |
| 11 | BIHAR | 267.97 | 3.02% | 48,787.79 | 3.45% |
| 12 | WEST BENGAL | 233.46 | 2.63% | 43,922.05 | 3.10% |
| 13 | HARYANA | 225.35 | 2.54% | 35,256.24 | 2.49% |
| 14 | KERALA | 201.13 | 2.27% | 31,243.16 | 2.21% |
| 15 | ODISHA | 184.79 | 2.08% | 28,296.73 | 2.00% |
| 16 | PUNJAB | 123.33 | 1.39% | 21,576.93 | 1.52% |
| 17 | JHARKHAND | 93.42 | 1.05% | 14,905.34 | 1.05% |
| 18 | ASSAM | 81.02 | 0.91% | 14,333.08 | 1.01% |
| 19 | UTTARAKHAND | 79.24 | 0.89% | 11,091.58 | 0.78% |
| 20 | CHHATTISGARH | 78.23 | 0.88% | 11,254.99 | 0.80% |
| 21 | HIMACHAL PRADESH | 34.96 | 0.39% | 4,786.04 | 0.34% |
| 22 | JAMMU AND KASHMIR | 28.44 | 0.32% | 4,783.74 | 0.34% |
| 23 | GOA | 20.03 | 0.23% | 2,988.02 | 0.21% |
| 24 | CHANDIGARH | 18.64 | 0.21% | 2,531.42 | 0.18% |
| 25 | PUDUCHERRY | 9.52 | 0.11% | 1,432.15 | 0.10% |
| 26 | MANIPUR | 8.19 | 0.09% | 2,155.67 | 0.15% |
| 27 | ARUNACHAL PRADESH | 6.62 | 0.07% | 1,341.62 | 0.09% |
| 28 | DADRA & NAGAR HAVELI & DAMAN & DIU | 5.67 | 0.06% | 641.58 | 0.05% |
| 29 | TRIPURA | 5.52 | 0.06% | 993.56 | 0.07% |
| 30 | MEGHALAYA | 4.26 | 0.05% | 852.30 | 0.06% |
| 31 | NAGALAND | 3.64 | 0.04% | 982.40 | 0.07% |
| 32 | SIKKIM | 3.44 | 0.04% | 660.99 | 0.05% |
| 33 | MIZORAM | 3.25 | 0.04% | 774.43 | 0.05% |
| 34 | ANDAMAN & NICOBAR | 1.60 | 0.02% | 334.49 | 0.02% |
| 35 | LADAKH | 1.39 | 0.02% | 368.52 | 0.03% |
| 36 | LAKSHADWEEP | 0.09 | 0.00% | 23.34 | 0.00% |
| 37 | UNCLASSIFIED# | 1,162.65 | 13.12% | 1,99,181.50 | 14.07% |
| UPI Remitter Banks - Top 50 Banks (Mar'23) | |||||||
|---|---|---|---|---|---|---|---|
| Sr. No. | UPI Remitter Banks (Mar-2023) | Total Volume (In Mn) | Approved % | BD % | TD% | Total Debit Reversal Count (In Mn) | Debit Reversal Success % |
| 1 | State Bank Of India | 2260.05 | 92.46% | 5.09% | 2.45% | 15.95 | 89.61% |
| 2 | HDFC BANK LTD | 778.92 | 94.41% | 4.74% | 0.85% | 4.53 | 93.27% |
| 3 | Bank of Baroda | 572.31 | 93.72% | 5.89% | 0.39% | 2.06 | 96.77% |
| 4 | Union Bank of India | 538.68 | 94.84% | 4.65% | 0.51% | 2.60 | 75.60% |
| 5 | ICICI Bank | 444.82 | 96.09% | 3.11% | 0.80% | 2.72 | 95.14% |
| 6 | Axis Bank Ltd. | 413.87 | 95.79% | 4.14% | 0.07% | 1.29 | 89.86% |
| 7 | Punjab National Bank | 409.55 | 95.11% | 4.78% | 0.12% | 1.75 | 82.94% |
| 8 | Canara Bank | 405.45 | 93.97% | 5.81% | 0.22% | 1.68 | 93.20% |
| 9 | Paytm Payments Bank | 404.99 | 95.76% | 4.03% | 0.21% | 1.22 | 78.26% |
| 10 | Kotak Mahindra Bank | 404.38 | 93.76% | 5.35% | 0.89% | 1.77 | 65.63% |
| 11 | Bank of India | 293.39 | 95.42% | 4.06% | 0.53% | 1.32 | 76.80% |
| 12 | Indian Bank | 236.53 | 92.72% | 5.50% | 1.78% | 1.52 | 73.10% |
| 13 | Airtel Payments Bank | 193.35 | 86.62% | 13.09% | 0.30% | 0.82 | 93.66% |
| 14 | India Post Payment Bank | 158.88 | 75.27% | 20.47% | 4.26% | 1.16 | 53.49% |
| 15 | Federal Bank | 142.93 | 94.60% | 5.10% | 0.31% | 0.51 | 92.18% |
| 16 | Central Bank Of India | 141.31 | 90.23% | 8.68% | 1.09% | 1.26 | 77.95% |
| 17 | Indian Overseas Bank | 114.43 | 94.72% | 4.75% | 0.53% | 0.51 | 94.65% |
| 18 | IDBI Bank Limited | 111.97 | 89.17% | 3.67% | 7.16% | 1.44 | 76.20% |
| 19 | UCO Bank | 101.76 | 93.78% | 5.72% | 0.51% | 0.53 | 80.64% |
| 20 | Bank of Maharashtra | 100.81 | 91.86% | 4.40% | 3.74% | 0.58 | 57.63% |
| 21 | INDUSIND BANK | 83.58 | 94.08% | 5.59% | 0.32% | 0.37 | 92.66% |
| 22 | Yes Bank Ltd | 78.15 | 95.31% | 4.26% | 0.43% | 0.2 | 81.87% |
| 23 | Fino Payments Bank | 73.73 | 77.59% | 20.33% | 2.08% | 0.51 | 61.41% |
| 24 | Karnataka Bank | 72.22 | 92.20% | 6.53% | 1.28% | 0.24 | 78.84% |
| 25 | IDFC FIRST Bank | 65.54 | 92.41% | 6.39% | 1.20% | 0.3 | 67.52% |
| 26 | Karur Vysya Bank | 45.86 | 92.75% | 6.71% | 0.54% | 0.18 | 88.19% |
| 27 | Bandhan Bank | 37.63 | 88.08% | 8.84% | 3.07% | 0.42 | 79.98% |
| 28 | South Indian Bank | 37.12 | 94.83% | 4.89% | 0.28% | 0.12 | 93.61% |
| 29 | City Union Bank | 27.3 | 91.35% | 7.78% | 0.87% | 0.11 | 92.43% |
| 30 | Jammu and Kashmir Bank | 26.67 | 89.34% | 6.29% | 4.37% | 0.30 | 43.89% |
| 31 | Equitas Bank | 24.63 | 88.99% | 10.43% | 0.58% | 0.00 | 85.92% |
| 32 | Ujjivan Small Finance Bank | 24.53 | 93.31% | 6.33% | 0.35% | 0.12 | 75.52% |
| 33 | AU small Finance Bank | 24.37 | 94.50% | 5.19% | 0.30% | 0.11 | 95.90% |
| 34 | Tamilnad Mercantile Bank | 22.69 | 93.16% | 6.60% | 0.24% | 0.07 | 84.05% |
| 35 | DBS Bank India Limited | 22.51 | 95.46% | 4.06% | 0.47% | 0.00 | 88.13% |
| 36 | Punjab and Sind Bank | 21.53 | 89.29% | 9.82% | 0.90% | 0.14 | 82.00% |
| 37 | Standard Chartered | 20.28 | 96.72% | 2.42% | 0.85% | 0.09 | 88.92% |
| 38 | Andhra Pradesh Grameena Vikas Bank | 18.43 | 82.74% | 11.63% | 5.64% | 0.12 | 51.12% |
| 39 | Citibank | 18.42 | 95.76% | 3.42% | 0.83% | 0.06 | 97.94% |
| 40 | Maharashtra Gramin Bank | 17.65 | 79.68% | 15.49% | 4.83% | 0.14 | 42.17% |
| 41 | Pragathi Krishna Gramin Bank | 17.47 | 86.38% | 10.22% | 3.40% | 0.19 | 79.06% |
| 42 | Saraswat Bank | 17.1 | 96.72% | 3.12% | 0.16% | 0.04 | 94.48% |
| 43 | Kerala Gramin Bank | 16.26 | 89.80% | 9.10% | 1.11% | 0.08 | 87.82% |
| 44 | Rajasthan Marudhara Gramin Bank | 15.76 | 74.89% | 19.11% | 6.00% | 0.11 | 34.21% |
| 45 | ESAF Small Finance Bank Ltd. | 14.58 | 84.00% | 15.03% | 0.97% | 0.05 | 82.29% |
| 46 | RBL | 11.99 | 92.44% | 6.80% | 0.77% | 0.00 | 83.60% |
| 47 | Andhra Pragathi Grameena Bank | 11.75 | 77.24% | 16.27% | 6.48% | 0.12 | 16.47% |
| 48 | Sarva Haryana Gramin Bank | 11.26 | 89.92% | 7.80% | 2.28% | 0.13 | 37.49% |
| 49 | Baroda UP Gramin Bank | 10.54 | 84.29% | 13.20% | 2.51% | 0.12 | 38.16% |
| 50 | Fincare Small Finance Bank Ltd | 8.59 | 85.47% | 10.75% | 3.78% | 0.12 | 36.94% |
| UPI Beneficiary Banks - Top 50 Banks (Mar'23) | |||||||
|---|---|---|---|---|---|---|---|
| Sr.No. | UPI Beneficiary Banks (Mar-2023) | Total Volume (In Mn) | Approved % | BD% | TD% | Deemed Approved % | |
| 1 | Paytm Payments Bank | 1921.46 | 99.68% | 0.24% | 0.06% | 0.02% | |
| 2 | Yes Bank Ltd | 1590.23 | 99.88% | 0.00% | 0.00% | 0.03% | |
| 3 | State Bank Of India | 972.24 | 98.22% | 0.21% | 1.41% | 0.17% | |
| 4 | ICICI Bank | 601.02 | 98.26% | 0.24% | 1.06% | 0.44% | |
| 5 | Axis Bank Ltd | 599.56 | 99.42% | 0.23% | 0.23% | 0.12% | |
| 6 | HDFC BANK LTD | 443.88 | 98.86% | 0.53% | 0.42% | 0.19% | |
| 7 | Bank of Baroda | 267.27 | 99.48% | 0.17% | 0.26% | 0.10% | |
| 8 | Union Bank of India | 258.29 | 99.41% | 0.17% | 0.30% | 0.11% | |
| 9 | Canara Bank | 201.82 | 99.57% | 0.00% | 0.33% | 0.10% | |
| 10 | Punjab National Bank | 199.08 | 99.36% | 0.36% | 0.07% | 0.21% | |
| 11 | Federal Bank | 198.1 | 99.50% | 0.31% | 0.18% | 0.01% | |
| 12 | Kotak Mahindra Bank | 186.19 | 98.32% | 0.43% | 0.88% | 0.37% | |
| 13 | Bank of India | 146.91 | 99.25% | 0.23% | 0.42% | 0.10% | |
| 14 | Indian Bank | 114.41 | 97.90% | 0.21% | 1.16% | 0.73% | |
| 15 | Airtel Payments Bank | 114 | 99.03% | 0.23% | 0.63% | 0.11% | |
| 16 | INDUSIND BANK | 84.66 | 99.51% | 0.21% | 0.21% | 0.08% | |
| 17 | Central Bank Of India | 71.42 | 98.58% | 0.59% | 0.43% | 0.40% | |
| 18 | India Post Payment Bank | 66.53 | 97.67% | 0.60% | 1.64% | 0.09% | |
| 19 | Indian Overseas Bank | 57.99 | 99.15% | 0.51% | 0.14% | 0.20% | |
| 20 | IDBI Bank Limited | 54.35 | 92.67% | 0.36% | 6.24% | 0.74% | |
| 21 | UCO Bank | 51.56 | 98.95% | 0.67% | 0.35% | 0.03% | |
| 22 | Bank of Maharashtra | 42.71 | 94.93% | 0.23% | 4.45% | 0.39% | |
| 23 | IDFC FIRST Bank | 40.8 | 97.07% | 1.51% | 1.27% | 0.14% | |
| 24 | Karnataka Bank | 33.67 | 98.00% | 0.63% | 1.31% | 0.06% | |
| 25 | Karur Vysya Bank | 26.9 | 99.23% | 0.39% | 0.29% | 0.09% | |
| 26 | South Indian Bank | 24.73 | 99.45% | 0.37% | 0.17% | 0.02% | |
| 27 | Fino Payments Bank | 24.05 | 97.27% | 1.32% | 1.41% | 0.24% | |
| 28 | Bandhan Bank | 23.1 | 96.04% | 0.37% | 3.42% | 0.17% | |
| 29 | AU small Finance Bank | 18.01 | 98.65% | 1.07% | 0.22% | 0.06% | |
| 30 | City Union Bank | 14.84 | 98.25% | 1.05% | 0.59% | 0.11% | |
| 31 | Tamilnad Mercantile Bank | 14.13 | 99.54% | 0.25% | 0.17% | 0.04% | |
| 32 | CITI | 13.9 | 99.75% | 0.00% | 0.10% | 0.15% | |
| 33 | Ujjivan Small Finance Bank | 13.29 | 99.29% | 0.31% | 0.22% | 0.18% | |
| 34 | Equitas Bank | 12.24 | 96.03% | 3.45% | 0.45% | 0.08% | |
| 35 | Jammu and Kashmir Bank | 10.84 | 97.08% | 0.45% | 2.27% | 0.20% | |
| 36 | Punjab and Sind Bank | 10.28 | 99.09% | 0.20% | 0.63% | 0.08% | |
| 37 | Kerala Gramin Bank | 9.92 | 98.85% | 0.19% | 0.71% | 0.26% | |
| 38 | Pragathi Krishna Gramin Bank | 9.75 | 96.93% | 0.26% | 2.39% | 0.42% | |
| 39 | DBS Bank India Limited | 9.25 | 98.16% | 1.34% | 0.37% | 0.13% | |
| 40 | Andhra Pradesh Grameena Vikas Bank | 9.2 | 96.08% | 0.11% | 3.51% | 0.30% | |
| 41 | RBL | 8.54 | 98.80% | 0.75% | 0.36% | 0.09% | |
| 42 | Maharashtra Gramin Bank | 8.42 | 95.06% | 1.38% | 3.24% | 0.32% | |
| 43 | ESAF Small Finance Bank Ltd. | 7.54 | 99.23% | 0.13% | 0.58% | 0.06% | |
| 44 | Rajasthan Marudhara Gramin Bank | 7.39 | 95.85% | 0.38% | 3.45% | 0.32% | |
| 45 | Baroda UP Gramin Bank | 7.1 | 95.28% | 2.33% | 1.68% | 0.70% | |
| 46 | Saraswat Bank | 6.45 | 99.59% | 0.22% | 0.13% | 0.06% | |
| 47 | Andhra Pragathi Grameena Bank | 6.39 | 95.45% | 0.71% | 3.78% | 0.06% | |
| 48 | Cosmos Bank | 5.85 | 99.17% | 0.26% | 0.40% | 0.17% | |
| 49 | Sarva Haryana Gramin Bank | 5.36 | 97.65% | 0.62% | 1.45% | 0.28% | |
| 50 | Baroda Rajasthan Kshetriya Gramin Bank | 4.82 | 94.68% | 2.49% | 2.33% | 0.50% | |
| UPI Apps (Mar'23) | |||||||||||
|---|---|---|---|---|---|---|---|---|---|---|---|
| Sr.No. | Application Name | Customer Initiated Transactions | B2C Transactions | B2B Transactions | On-us Transactions | Total | |||||
| Volume (Mn) | Value (Cr) | Volume (Mn) | Value (Cr) | Volume (Mn) | Value (Cr) | Volume (Mn) | Value (Cr) | Volume (Mn) | Value (Cr) | ||
| 1 | Airtel Payments Bank Apps | 10.66 | 761.39 | - | - | 0.00 | 0.00 | 0.00 | 0.11 | 10.66 | 761.51 |
| 2 | Allahabad Bank Apps | 0.03 | 8.33 | - | - | - | - | - | - | 0.03 | 8.33 |
| 3 | Amazon Pay | 50.56 | 5,360.90 | - | - | - | - | - | - | 50.56 | 5,360.90 |
| 4 | AU Small Finance Bank Apps | 0.62 | 186.48 | - | - | - | - | - | - | 0.62 | 186.48 |
| 5 | Axis Bank Apps | 9.31 | 1,700.48 | 48.90 | 273.18 | 0.03 | 3.00 | - | - | 58.24 | 1,976.67 |
| 6 | Bajaj Finserv | 6.70 | 965.35 | - | - | - | - | - | - | 6.70 | 965.35 |
| 7 | Bajaj Finserv PPI | 0.05 | 12.22 | - | - | - | - | - | - | 0.05 | 12.22 |
| 8 | Bajaj Markets | 0.01 | 0.35 | - | - | - | - | - | - | 0.01 | 0.35 |
| 9 | Bandhan Bank Apps | 0.01 | 1.50 | - | - | - | - | - | - | 0.01 | 1.50 |
| 10 | Bank of America Apps | 0.01 | 2.06 | - | - | 0.00 | 0.00 | - | - | 0.01 | 2.07 |
| 11 | Bank of Baroda Apps | 1.16 | 446.84 | - | - | 0.00 | 0.42 | - | - | 1.16 | 447.25 |
| 12 | Bank of India Apps | 0.23 | 71.14 | - | - | - | - | - | - | 0.23 | 71.14 |
| 13 | Bank of Maharashtra Apps | 0.06 | 21.29 | - | - | - | - | - | - | 0.06 | 21.29 |
| 14 | BHIM | 23.68 | 7,498.24 | - | - | - | - | - | - | 23.68 | 7,498.24 |
| 15 | Canara Bank Apps | 1.39 | 374.43 | - | - | - | - | - | - | 1.39 | 374.43 |
| 16 | Central Bank of India Apps | 0.36 | 83.48 | - | - | 0.00 | 0.09 | - | - | 0.36 | 83.56 |
| 17 | Citi Bank Apps | 0.12 | 67.55 | - | - | 0.00 | 0.01 | - | - | 0.12 | 67.55 |
| 18 | City Union Bank Apps | 0.06 | 18.93 | - | - | - | - | - | - | 0.06 | 18.93 |
| 19 | Cointab | 0.04 | 19.07 | - | - | - | - | - | - | 0.04 | 19.07 |
| 20 | Cred | 42.84 | 21,056.31 | - | - | - | - | - | - | 42.84 | 21,056.31 |
| 21 | DBS Digibank Apps | 0.41 | 177.88 | - | - | - | - | - | - | 0.41 | 177.88 |
| 22 | Deutsche Bank Apps | 1.72 | 167.84 | - | - | 0.02 | 19.27 | - | - | 1.73 | 187.11 |
| 23 | Dhanlaxmi Bank Apps | 0.01 | 3.21 | - | - | - | - | - | - | 0.01 | 3.21 |
| 24 | Equitas Small Finance Bank Apps | 0.02 | 13.57 | - | - | - | - | - | - | 0.02 | 13.57 |
| 25 | Eroute | 0.27 | 19.25 | - | - | - | - | - | - | 0.27 | 19.25 |
| 26 | Fampay PPI | 9.49 | 124.59 | - | - | - | - | - | - | 9.49 | 124.59 |
| 27 | Fave | 0.08 | 6.40 | - | - | - | - | - | - | 0.08 | 6.40 |
| 28 | Federal Bank Apps | 5.25 | 648.50 | - | - | 0.00 | 0.00 | - | - | 5.25 | 648.51 |
| 29 | Fino Payments bank Apps | 0.13 | 8.18 | - | - | - | - | - | - | 0.13 | 8.18 |
| 30 | Google Pay | 3,054.44 | 482,896.69 | - | - | - | - | - | - | 3,054.44 | 482,896.69 |
| 31 | Groww | 0.18 | 137.64 | - | - | - | - | - | - | 0.18 | 137.64 |
| 32 | HDFC Bank Apps | 14.22 | 3,644.87 | - | - | 0.00 | 0.01 | - | - | 14.22 | 3,644.88 |
| 33 | HSBC Bank Apps | 0.14 | 89.69 | 0.00 | 0.03 | 0.00 | 0.00 | - | - | 0.14 | 89.71 |
| 34 | ICICI Bank Apps | 29.46 | 8,773.27 | 4.87 | 348.16 | 7.26 | 8,502.71 | - | - | 41.59 | 17,624.14 |
| 35 | IDBI Bank Apps | 0.07 | 32.38 | - | - | - | - | - | - | 0.07 | 32.38 |
| 36 | IDFC Bank Apps | 13.36 | 2,665.21 | - | - | 0.67 | 640.96 | - | - | 14.02 | 3,306.18 |
| 37 | India Post Payments Bank Apps | 4.44 | 667.69 | - | - | - | - | - | - | 4.44 | 667.69 |
| 38 | Indian Bank Apps | 0.26 | 75.85 | - | - | 0.00 | 16.56 | - | - | 0.26 | 92.41 |
| 39 | Indian Overseas Bank Apps | 0.02 | 4.47 | - | - | - | - | - | - | 0.02 | 4.47 |
| 40 | IndusInd Bank Apps | 0.93 | 950.35 | - | - | - | - | - | - | 0.93 | 950.35 |
| 41 | Janata Sahakari Bank Apps | 0.01 | 3.74 | - | - | - | - | - | - | 0.01 | 3.74 |
| 42 | Jio Payments Bank Apps | 1.68 | 118.72 | - | - | - | - | - | - | 1.68 | 118.72 |
| 43 | Jupiter | 2.66 | 358.12 | - | - | - | - | - | - | 2.66 | 358.12 |
| 44 | Karnataka Bank Apps | 0.42 | 91.53 | - | - | - | - | - | - | 0.42 | 91.53 |
| 45 | Karur Vysya Bank Apps | 0.04 | 15.84 | - | - | - | - | - | - | 0.04 | 15.84 |
| 46 | Kotak Mahindra Bank Apps | 13.77 | 2,854.64 | - | - | 0.00 | 0.01 | - | - | 13.77 | 2,854.65 |
| 47 | LivQuick PPI | 0.01 | 0.64 | - | - | - | - | - | - | 0.01 | 0.64 |
| 48 | MakeMyTrip | 0.05 | 23.50 | - | - | - | - | - | - | 0.05 | 23.50 |
| 49 | Mobikwik | 3.64 | 937.98 | - | - | - | - | - | - | 3.64 | 937.98 |
| 50 | NSDL Payments Bank Apps | 0.03 | 3.47 | - | - | - | - | - | - | 0.03 | 3.47 |
| 51 | Paytm Payments Bank App | 1,169.63 | 133,167.49 | 12.95 | 20.36 | 0.55 | 782.71 | 105.25 | 20,459.85 | 1,288.38 | 154,430.40 |
| 52 | PhonePe | 4,076.32 | 707,410.47 | - | - | - | - | - | - | 4,076.32 | 707,410.47 |
| 53 | Punjab National Bank Apps | 0.43 | 110.59 | - | - | - | - | - | - | 0.43 | 110.59 |
| 54 | Punjab Sind Bank Apps | 0.04 | 13.74 | - | - | - | - | - | - | 0.04 | 13.74 |
| 55 | RBL Bank Apps | 1.79 | 544.09 | 0.00 | 0.00 | 0.09 | 1.89 | - | - | 1.88 | 545.98 |
| 56 | Samsung Pay | 5.68 | 528.09 | - | - | - | - | - | - | 5.68 | 528.09 |
| 57 | South Indian Bank Apps | 0.22 | 66.08 | - | - | - | - | - | - | 0.22 | 66.08 |
| 58 | Standard Chartered Bank Apps | 0.15 | 94.14 | - | - | 0.00 | 0.00 | - | - | 0.15 | 94.14 |
| 59 | State Bank of India Apps | 4.36 | 2,011.57 | - | - | 0.00 | 0.08 | - | - | 4.36 | 2,011.65 |
| 60 | Tamilnad Mercantile Bank Apps | 0.07 | 12.42 | - | - | - | - | - | - | 0.07 | 12.42 |
| 61 | TataNeu | 0.12 | 15.00 | - | - | - | - | - | - | 0.12 | 15.00 |
| 62 | Transerv PPI | 0.06 | 8.11 | - | - | - | - | - | - | 0.06 | 8.11 |
| 63 | UCO Bank Apps | 0.36 | 116.66 | - | - | - | - | - | - | 0.36 | 116.66 |
| 64 | Ultracash | 0.04 | 2.61 | - | - | - | - | - | - | 0.04 | 2.61 |
| 65 | Union Bank Apps | 0.75 | 310.24 | - | - | - | - | - | - | 0.75 | 310.24 |
| 66 | Utkarsh Small Finance Bank Apps | 0.02 | 6.35 | - | - | - | - | - | - | 0.02 | 6.35 |
| 67 | 13.35 | 1,144.76 | - | - | - | - | - | - | 13.35 | 1,144.76 | |
| 68 | Yes Bank Apps | 30.78 | 10,038.78 | - | - | 0.68 | 55.12 | - | - | 31.47 | 10,093.90 |
| 69 | Others | 0.02 | 5.18 | - | - | - | - | - | - | 0.02 | 5.18 |
Note:-
| UPI P2P and P2M Transactions | ||||||
|---|---|---|---|---|---|---|
| Month | Total | P2P | P2M | |||
| Volume (Mn) | Value (Cr) | Volume (Mn) | Value (Cr) | Volume (Mn) | Value (Cr) | |
| Mar'23 | 8,685.30 | 14,10,443.01 | 3,859.05 | 10,88,096.36 | 4,826.25 | 3,22,346.66 |
| UPI Payer PSP Performance (Mar'23) | |||||
|---|---|---|---|---|---|
| Sr. No. | Payer PSP | Total Volume (In Mn) | Approved % | BD % | TD % |
| 1 | Yes Bank Ltd | 3,027.01 | 98.69% | 1.30% | 0.00% |
| 2 | Axis Bank Ltd | 1,563.99 | 98.72% | 1.28% | 0.00% |
| 3 | ICICI Bank | 1,331.47 | 98.77% | 1.23% | 0.00% |
| 4 | Paytm Payments Bank | 1,199.41 | 98.64% | 1.35% | 0.01% |
| 5 | State Bank Of India | 941.76 | 98.76% | 1.24% | 0.00% |
| 6 | HDFC Bank Ltd | 635.41 | 98.80% | 1.20% | 0.00% |
| 7 | IDFC FIRST Bank | 14.40 | 98.21% | 1.78% | 0.01% |
| 8 | Kotak Mahindra Bank | 14.04 | 98.09% | 1.90% | 0.02% |
| 9 | Airtel Payments Bank | 11.07 | 96.25% | 3.70% | 0.05% |
| 10 | Federal Bank | 5.40 | 98.09% | 1.89% | 0.01% |
| 11 | India Post Payment Bank | 4.52 | 98.28% | 1.72% | 0.00% |
| 12 | RBL Bank | 2.53 | 98.81% | 1.19% | 0.00% |
| 13 | Jio Payments Bank | 1.76 | 95.74% | 3.71% | 0.56% |
| 14 | Deutsche Bank | 1.73 | 99.94% | 0.06% | 0.00% |
| 15 | Canara Bank | 1.45 | 95.54% | 4.45% | 0.01% |
| UPI Payee PSP Performance (Mar'23) | |||||
|---|---|---|---|---|---|
| Sr. No. | Payee PSP | Total Volume (In Mn) | Approved % | BD % | TD % |
| 1 | Yes Bank Ltd | 3,113.51 | 99.31% | 0.59% | 0.09% |
| 2 | Paytm Payments Bank | 2,027.97 | 99.59% | 0.38% | 0.04% |
| 3 | Axis Bank Ltd | 1,055.15 | 99.18% | 0.77% | 0.05% |
| 4 | ICICI Bank | 1,012.61 | 99.25% | 0.71% | 0.04% |
| 5 | HDFC Bank Ltd | 406.61 | 99.04% | 0.94% | 0.03% |
| 6 | State Bank Of India | 393.82 | 99.21% | 0.67% | 0.12% |
| 7 | Federal Bank | 139.72 | 97.09% | 2.39% | 0.52% |
| 8 | IndusInd Bank | 44.06 | 98.15% | 1.42% | 0.44% |
| 9 | Kotak Mahindra Bank | 33.89 | 98.96% | 0.68% | 0.36% |
| 10 | Cosmos Bank | 25.21 | 97.39% | 2.41% | 0.20% |
| 11 | Airtel Payments Bank | 20.64 | 98.72% | 0.39% | 0.89% |
| 12 | IDFC FIRST Bank | 17.16 | 89.33% | 8.06% | 2.61% |
| 13 | Citibank | 14.03 | 99.07% | 0.77% | 0.16% |
| 14 | Bank of Baroda | 8.58 | 87.79% | 0.34% | 11.87% |
| 15 | Canara Bank | 8.03 | 99.61% | 0.35% | 0.04% |
| UPI Merchant Category-wise Classification -March'23 (Arranged by Volume) | ||||
|---|---|---|---|---|
| Type | MCC | Description | Volume (in Mn) | Value (in Cr.) |
| High Transacting Categories | 5411 | Groceries and supermarkets | 933.01 | 28,892.81 |
| 5812 | Eating places and restaurants | 584.82 | 9,583.79 | |
| 4814 | Telecommunication services, including local and long distance calls, credit card calls, calls through use of magnetic stripe reading telephones and faxes | 486.58 | 9,205.96 | |
| 5814 | Fast food restaurants | 273.73 | 3,296.79 | |
| 5816 | Digital Goods: Games | 237.74 | 7,613.77 | |
| 5311 | Department stores | 233.37 | 4,863.20 | |
| 5541 | Service stations (with or without ancillary services) | 230.83 | 15,673.32 | |
| 5912 | Drug stores and pharmacies | 121.20 | 4,604.47 | |
| 5462 | Bakeries | 115.19 | 1,639.71 | |
| 6540 | Debit card to wallet credit (Wallet top up) | 75.29 | 4,773.32 | |
| Medium Transacting Categories | 5451 | Dairies | 72.54 | 1,493.22 |
| 4900 | Utilities electric, gas, water and sanitary | 71.40 | 8,049.21 | |
| 7299 | Miscellaneous personal services not elsewhere classified | 67.98 | 2,858.58 | |
| 5813 | Drinking places (alcoholic beverages) bars, taverns, night-clubs, cocktail lounges and discothques | 60.80 | 2,549.35 | |
| 7322 | Debt collection agencies | 56.84 | 45,878.79 | |
| 5399 | Miscellaneous general merchandise | 55.06 | 4,345.14 | |
| 5331 | Variety stores | 46.78 | 2,807.09 | |
| 6012 | Financial institutions merchandise and services | 40.11 | 15,636.77 | |
| 5137 | Mens, womens and childrens uniforms and commercial clothing | 35.33 | 3,918.47 | |
| 5422 | Freezer and locker meat provisioners | 35.14 | 1,139.09 | |
| All Other Categories | 8999 | Professional services not elsewhere classified | 34.78 | 1,741.91 |
| 5732 | Electronics shops | 31.55 | 4,417.02 | |
| 5262 | Online Marketplaces | 30.75 | 2,668.59 | |
| 6211 | Securities brokers and dealers | 30.38 | 20,654.57 | |
| 4899 | Cable and other pay television services | 28.39 | 1,169.46 | |
| 5441 | Candy, nut and confectionery shops | 28.03 | 529.25 | |
| 7230 | Beauty and barber shops | 27.90 | 865.99 | |
| 9399 | Government services not elsewhere classified | 26.05 | 3,550.97 | |
| 4214 | Motor freight carriers and trucking local and long distance, moving and storage companies and local delivery | 22.71 | 1,684.32 | |
| Others | 731.94 | 1,06,241.75 | ||
| Total | 4,826.25 | 3,22,346.66 | ||
| UPI Remitter Banks - Top 50 Banks (Feb'23) | |||||||
|---|---|---|---|---|---|---|---|
| Sr. No. | UPI Remitter Banks (Feb-2023) | Total Volume (In Mn) | Approved % | BD % | TD% | Total Debit Reversal Count (In Mn) | Debit Reversal Success % |
| 1 | State Bank Of India | 1987.68 | 89.00% | 6.43% | 4.57% | 18.42 | 81.67% |
| 2 | HDFC BANK LTD | 681.04 | 95.96% | 3.76% | 0.28% | 2.93 | 93.36% |
| 3 | Bank of Baroda | 502.38 | 92.92% | 5.81% | 1.28% | 2.83 | 88.16% |
| 4 | Union Bank of India | 472.10 | 93.64% | 4.96% | 1.40% | 4.03 | 54.32% |
| 5 | ICICI Bank | 397.14 | 96.50% | 3.29% | 0.21% | 1.27 | 93.18% |
| 6 | Axis Bank Ltd | 367.84 | 95.47% | 4.50% | 0.04% | 1.26 | 89.52% |
| 7 | Paytm Payments Bank | 360.42 | 96.17% | 3.77% | 0.06% | 0.84 | 92.69% |
| 8 | Kotak Mahindra Bank | 358.40 | 93.36% | 5.26% | 1.38% | 1.70 | 66.32% |
| 9 | Canara Bank | 354.92 | 93.13% | 6.21% | 0.66% | 2.21 | 83.96% |
| 10 | Punjab National Bank | 351.60 | 94.68% | 4.98% | 0.33% | 1.70 | 96.95% |
| 11 | Bank of India | 258.24 | 95.35% | 4.34% | 0.32% | 1.23 | 84.48% |
| 12 | Indian Bank | 202.78 | 93.39% | 5.11% | 1.49% | 1.49 | 67.72% |
| 13 | Airtel Payments Bank | 162.94 | 86.21% | 13.11% | 0.67% | 0.91 | 93.03% |
| 14 | India Post Payment Bank | 154.66 | 57.40% | 23.33% | 19.26% | 6.49 | 31.89% |
| 15 | Federal Bank | 127.02 | 94.17% | 5.34% | 0.48% | 0.53 | 86.60% |
| 16 | Central Bank Of India | 123.73 | 90.05% | 8.78% | 1.18% | 1.16 | 74.98% |
| 17 | Indian Overseas Bank | 100.80 | 94.23% | 5.30% | 0.47% | 0.48 | 94.74% |
| 18 | IDBI Bank Limited | 97.58 | 94.77% | 4.02% | 1.20% | 0.57 | 86.98% |
| 19 | Bank of Maharashtra | 89.07 | 94.51% | 4.68% | 0.81% | 0.36 | 86.51% |
| 20 | UCO Bank | 87.90 | 93.47% | 5.87% | 0.66% | 0.50 | 79.26% |
| 21 | INDUSIND BANK | 72.18 | 93.90% | 5.89% | 0.21% | 0.33 | 96.05% |
| 22 | IDFC FIRST Bank | 67.51 | 91.83% | 4.93% | 3.24% | 0.64 | 35.14% |
| 23 | Yes Bank Ltd | 66.76 | 95.49% | 4.13% | 0.38% | 0.17 | 92.30% |
| 24 | Fino Payments Bank | 66.29 | 76.37% | 15.66% | 7.97% | 1.62 | 47.82% |
| 25 | Karnataka Bank | 62.94 | 90.29% | 7.59% | 2.11% | 0.34 | 53.91% |
| 26 | Karur Vysya Bank | 40.92 | 92.07% | 6.79% | 1.14% | 0.21 | 80.44% |
| 27 | Bandhan Bank | 33.89 | 85.65% | 11.75% | 2.60% | 0.40 | 77.08% |
| 28 | South Indian Bank | 32.46 | 93.93% | 5.15% | 0.92% | 0.16 | 67.41% |
| 29 | City Union Bank | 23.61 | 92.89% | 6.25% | 0.86% | 0.10 | 94.83% |
| 30 | Jammu and Kashmir Bank | 23.46 | 88.47% | 6.49% | 5.03% | 0.32 | 43.97% |
| 31 | Equitas Bank | 21.75 | 89.06% | 10.50% | 0.44% | 0.10 | 93.42% |
| 32 | Ujjivan Small Finance Bank | 21.17 | 92.25% | 6.71% | 1.05% | 0.14 | 63.25% |
| 33 | AU small Finance Bank | 20.98 | 94.57% | 5.36% | 0.07% | 0.10 | 96.90% |
| 34 | Tamilnad Mercantile Bank | 20.22 | 90.23% | 8.07% | 1.71% | 0.10 | 65.78% |
| 35 | DBS Bank India Limited | 20.16 | 95.38% | 4.21% | 0.41% | 0.08 | 87.64% |
| 36 | Punjab and Sind Bank | 19.12 | 86.81% | 12.41% | 0.78% | 0.13 | 78.29% |
| 37 | Standard Chartered | 18.03 | 96.88% | 2.54% | 0.58% | 0.07 | 91.16% |
| 38 | Citibank | 16.98 | 95.34% | 3.70% | 0.95% | 0.06 | 94.69% |
| 39 | Andhra Pradesh Grameena Vikas Bank | 16.28 | 80.56% | 12.46% | 6.98% | 0.17 | 32.54% |
| 40 | Saraswat Bank | 15.08 | 95.25% | 3.36% | 1.39% | 0.04 | 84.80% |
| 41 | Pragathi Krishna Gramin Bank | 15.04 | 87.61% | 10.88% | 1.50% | 0.14 | 81.24% |
| 42 | Maharashtra Gramin Bank | 14.93 | 82.05% | 15.61% | 2.34% | 0.12 | 48.33% |
| 43 | Kerala Gramin Bank | 14.21 | 89.20% | 10.23% | 0.57% | 0.07 | 91.07% |
| 44 | ESAF Small Finance Bank Ltd. | 13.60 | 77.06% | 21.90% | 1.04% | 0.06 | 85.84% |
| 45 | Rajasthan Marudhara Gramin Bank | 12.76 | 80.63% | 10.95% | 8.41% | 0.09 | 48.40% |
| 46 | RBL | 10.51 | 93.16% | 6.49% | 0.35% | 0.04 | 95.27% |
| 47 | Andhra Pragathi Grameena Bank | 10.06 | 77.17% | 14.54% | 8.29% | 0.11 | 23.55% |
| 48 | Sarva Haryana Gramin Bank | 10.03 | 83.21% | 7.66% | 9.13% | 0.25 | 17.54% |
| 49 | Baroda UP Gramin Bank | 8.91 | 85.45% | 12.15% | 2.39% | 0.06 | 75.51% |
| 50 | Baroda Rajasthan Kshetriya Gramin Bank | 7.42 | 82.62% | 11.38% | 6.00% | 0.07 | 45.77% |
| UPI Beneficiary Banks - Top 50 Banks (Feb'23) | |||||||
|---|---|---|---|---|---|---|---|
| Sr.No. | UPI Beneficiary Banks (Feb-2023) | Total Volume (In Mn) | Approved % | BD% | TD% | Deemed Approved % | |
| 1 | Paytm Payments Bank | 1657.41 | 99.76% | 0.21% | 0.02% | 0.01% | |
| 2 | Yes Bank Ltd | 1186.10 | 99.85% | 0.11% | 0.03% | 0.01% | |
| 3 | State Bank Of India | 855.15 | 96.01% | 0.26% | 3.40% | 0.33% | |
| 4 | ICICI Bank | 528.24 | 99.55% | 0.30% | 0.11% | 0.04% | |
| 5 | Axis Bank Ltd. | 516.94 | 99.83% | 0.14% | 0.01% | 0.02% | |
| 6 | HDFC BANK LTD | 379.92 | 99.19% | 0.63% | 0.09% | 0.09% | |
| 7 | Bank of Baroda | 236.71 | 98.48% | 0.41% | 0.95% | 0.16% | |
| 8 | Union Bank of India | 227.08 | 98.78% | 0.23% | 0.66% | 0.33% | |
| 9 | Canara Bank | 176.74 | 99.31% | 0.00% | 0.57% | 0.12% | |
| 10 | Punjab National Bank | 171.55 | 99.19% | 0.44% | 0.18% | 0.18% | |
| 11 | Federal Bank | 168.80 | 99.44% | 0.31% | 0.23% | 0.02% | |
| 12 | Kotak Mahindra Bank | 162.23 | 98.34% | 0.57% | 0.49% | 0.60% | |
| 13 | Bank of India | 129.73 | 99.45% | 0.29% | 0.18% | 0.08% | |
| 14 | Airtel Payments Bank | 100.18 | 98.73% | 0.27% | 0.76% | 0.25% | |
| 15 | Indian Bank | 99.83 | 98.27% | 0.39% | 1.06% | 0.28% | |
| 16 | INDUSIND BANK | 69.51 | 99.50% | 0.25% | 0.15% | 0.11% | |
| 17 | Central Bank Of India | 62.78 | 98.27% | 0.72% | 0.62% | 0.39% | |
| 18 | India Post Payment Bank | 58.50 | 84.59% | 1.48% | 11.82% | 2.11% | |
| 19 | Indian Overseas Bank | 50.96 | 99.49% | 0.25% | 0.10% | 0.16% | |
| 20 | IDBI Bank Limited | 47.42 | 98.37% | 0.45% | 1.04% | 0.14% | |
| 21 | IDFC FIRST Bank | 45.95 | 93.43% | 1.80% | 4.07% | 0.70% | |
| 22 | UCO Bank | 44.98 | 98.61% | 0.71% | 0.59% | 0.08% | |
| 23 | Bank of Maharashtra | 37.78 | 98.86% | 0.30% | 0.65% | 0.20% | |
| 24 | Karnataka Bank | 29.54 | 96.64% | 0.88% | 2.27% | 0.21% | |
| 25 | Karur Vysya Bank | 24.17 | 98.57% | 0.55% | 0.72% | 0.17% | |
| 26 | Fino Payments Bank | 21.97 | 92.06% | 1.98% | 4.49% | 1.47% | |
| 27 | South Indian Bank | 21.60 | 99.06% | 0.26% | 0.56% | 0.12% | |
| 28 | Bandhan Bank | 20.09 | 96.53% | 0.50% | 2.66% | 0.31% | |
| 29 | AU small Finance Bank | 15.82 | 98.24% | 1.71% | 0.05% | 0.01% | |
| 30 | City Union Bank | 13.11 | 98.56% | 0.82% | 0.53% | 0.09% | |
| 31 | Tamilnad Mercantile Bank | 12.46 | 98.29% | 0.36% | 1.24% | 0.10% | |
| 32 | Ujjivan Small Finance Bank | 11.51 | 98.64% | 0.40% | 0.74% | 0.23% | |
| 33 | Equitas Bank | 11.17 | 97.15% | 2.64% | 0.19% | 0.02% | |
| 34 | CITI | 11.09 | 99.67% | 0.00% | 0.15% | 0.18% | |
| 35 | Jammu and Kashmir Bank | 9.04 | 96.05% | 0.53% | 3.19% | 0.23% | |
| 36 | Punjab and Sind Bank | 9.03 | 99.18% | 0.23% | 0.50% | 0.10% | |
| 37 | Kerala Gramin Bank | 8.73 | 99.42% | 0.19% | 0.18% | 0.22% | |
| 38 | Pragathi Krishna Gramin Bank | 8.39 | 98.70% | 0.34% | 0.62% | 0.34% | |
| 39 | DBS Bank India Limited | 8.30 | 98.10% | 1.49% | 0.26% | 0.16% | |
| 40 | Andhra Pradesh Grameena Vikas Bank | 8.06 | 95.05% | 0.30% | 3.77% | 0.88% | |
| 41 | RBL | 7.24 | 98.78% | 1.12% | 0.09% | 0.02% | |
| 42 | Maharashtra Gramin Bank | 7.17 | 97.62% | 1.03% | 1.09% | 0.27% | |
| 43 | ESAF Small Finance Bank Ltd. | 6.66 | 99.15% | 0.18% | 0.56% | 0.11% | |
| 44 | Rajasthan Marudhara Gramin Bank | 6.66 | 93.33% | 0.43% | 5.95% | 0.29% | |
| 45 | Baroda UP Gramin Bank | 6.22 | 94.98% | 2.40% | 2.42% | 0.20% | |
| 46 | Saraswat Bank | 5.83 | 97.57% | 0.29% | 2.09% | 0.05% | |
| 47 | Andhra Pragathi Grameena Bank | 5.66 | 91.88% | 0.81% | 7.12% | 0.19% | |
| 48 | Sarva Haryana Gramin Bank | 4.75 | 92.46% | 0.67% | 5.81% | 1.06% | |
| 49 | Baroda Rajasthan Kshetriya Gramin Bank | 4.29 | 92.30% | 2.45% | 4.80% | 0.45% | |
| 50 | Karnataka Vikas Grameena Bank | 3.73 | 93.60% | 0.24% | 5.70% | 0.46% | |
| UPI Apps (Feb'23) | |||||||||||
|---|---|---|---|---|---|---|---|---|---|---|---|
| Sr.No. | Application Name | Customer Initiated Transactions | B2C Transactions | B2B Transactions | On-us Transactions | Total | |||||
| Volume (Mn) | Value (Cr) | Volume (Mn) | Value (Cr) | Volume (Mn) | Value (Cr) | Volume (Mn) | Value (Cr) | Volume (Mn) | Value (Cr) | ||
| 1 | Airtel Payments Bank Apps | 8.71 | 730.35 | - | - | 0.00 | 0.01 | 0.00 | 0.09 | 8.71 | 730.45 |
| 2 | Allahabad Bank Apps | 0.03 | 8.47 | - | - | - | - | - | - | 0.03 | 8.47 |
| 3 | Amazon Pay | 47.80 | 4,981.82 | - | - | - | - | - | - | 47.80 | 4,981.82 |
| 4 | AU Small Finance Bank Apps | 0.55 | 165.07 | - | - | - | - | - | - | 0.55 | 165.07 |
| 5 | Axis Bank Apps | 7.74 | 1,352.53 | 44.19 | 58.61 | 0.03 | 2.82 | - | - | 51.95 | 1,413.95 |
| 6 | Bajaj Finserv | 5.44 | 882.75 | - | - | - | - | - | - | 5.44 | 882.75 |
| 7 | Bandhan Bank Apps | 0.01 | 1.71 | - | - | - | - | - | - | 0.01 | 1.71 |
| 8 | Bank of Baroda Apps | 1.14 | 408.18 | - | - | 0.00 | 1.15 | - | - | 1.14 | 409.33 |
| 9 | Bank of India Apps | 0.24 | 68.69 | 0.00 | 0.00 | - | - | - | - | 0.24 | 68.69 |
| 10 | Bank of Maharashtra Apps | 0.07 | 19.02 | - | - | - | - | - | - | 0.07 | 19.02 |
| 11 | BHIM | 23.21 | 7,158.37 | - | - | - | - | - | - | 23.21 | 7,158.37 |
| 12 | Bajaj Finserv | 0.01 | 3.43 | - | - | - | - | - | - | 0.01 | 3.43 |
| 13 | Canara Bank Apps | 1.09 | 284.23 | - | - | - | - | - | - | 1.09 | 284.23 |
| 14 | Central Bank of India Apps | 0.32 | 72.05 | - | - | 0.00 | 0.10 | - | - | 0.32 | 72.15 |
| 15 | Citi Bank Apps | 0.08 | 59.37 | - | - | 0.00 | 0.00 | - | - | 0.08 | 59.37 |
| 16 | City Union Bank Apps | 0.06 | 15.94 | - | - | - | - | - | - | 0.06 | 15.94 |
| 17 | Cointab | 0.04 | 16.40 | - | - | - | - | - | - | 0.04 | 16.40 |
| 18 | Cred | 36.57 | 17,902.20 | - | - | - | - | - | - | 36.57 | 17,902.20 |
| 19 | DBS Digibank Apps | 0.39 | 161.51 | - | - | - | - | - | - | 0.39 | 161.51 |
| 20 | Deutsche Bank Apps | 1.31 | 112.45 | - | - | 0.01 | 5.90 | - | - | 1.32 | 118.35 |
| 21 | Transerv | 0.02 | 3.13 | - | - | - | - | - | - | 0.02 | 3.13 |
| 22 | Dhanlaxmi Bank Apps | 0.01 | 2.67 | - | - | - | - | - | - | 0.01 | 2.67 |
| 23 | Equitas Small Finance Bank Apps | 0.02 | 11.41 | - | - | - | - | - | - | 0.02 | 11.41 |
| 24 | EROUTE | 0.17 | 6.08 | - | - | - | - | - | - | 0.17 | 6.08 |
| 25 | FamPay PPI | 1.60 | 21.73 | - | - | - | - | - | - | 1.60 | 21.73 |
| 26 | Fave | 0.11 | 7.08 | - | - | - | - | - | - | 0.11 | 7.08 |
| 27 | Federal Bank Apps | 4.76 | 590.97 | - | - | 0.00 | 0.00 | - | - | 4.76 | 590.97 |
| 28 | Fino Payments bank Apps | 0.10 | 6.50 | - | - | - | - | - | - | 0.10 | 6.50 |
| 29 | Google Pay | 2,639.55 | 424,442.48 | - | - | - | - | - | - | 2,639.55 | 424,442.48 |
| 30 | Groww | 0.21 | 158.90 | - | - | - | - | - | - | 0.21 | 158.90 |
| 31 | HDFC Bank Apps | 11.87 | 3,116.03 | - | - | 0.00 | 0.14 | - | - | 11.87 | 3,116.17 |
| 32 | HSBC Bank Apps | 0.12 | 73.02 | 0.00 | 0.02 | 0.00 | 0.00 | - | - | 0.12 | 73.04 |
| 33 | ICICI Bank Apps | 28.99 | 8,054.44 | 5.68 | 390.60 | 5.84 | 6,386.36 | - | - | 40.52 | 14,831.40 |
| 34 | IDBI Bank Apps | 0.07 | 29.25 | - | - | - | - | - | - | 0.07 | 29.25 |
| 35 | IDFC Bank Apps | 21.31 | 2,176.07 | - | - | 0.98 | 868.14 | - | - | 22.28 | 3,044.21 |
| 36 | India Post Payments Bank Apps | 4.05 | 609.49 | - | - | - | - | - | - | 4.05 | 609.49 |
| 37 | Indian Bank Apps | 0.24 | 68.44 | - | - | 0.00 | 0.13 | - | - | 0.24 | 68.57 |
| 38 | Indian Overseas Bank Apps | 0.01 | 2.31 | - | - | - | - | - | - | 0.01 | 2.31 |
| 39 | IndusInd Bank Apps | 0.78 | 848.43 | - | - | - | - | - | - | 0.78 | 848.43 |
| 40 | Jio Payments Bank Apps | 1.50 | 104.03 | - | - | - | - | - | - | 1.50 | 104.03 |
| 41 | Jupiter | 2.39 | 314.07 | - | - | - | - | - | - | 2.39 | 314.07 |
| 42 | Karnataka Bank Apps | 0.39 | 88.38 | - | - | - | - | - | - | 0.39 | 88.38 |
| 43 | Karur Vysya Bank Apps | 0.04 | 14.78 | - | - | - | - | - | - | 0.04 | 14.78 |
| 44 | Kotak Mahindra Bank Apps | 12.09 | 2,521.61 | - | - | 0.00 | 0.03 | - | - | 12.09 | 2,521.65 |
| 45 | MakeMyTrip | 0.05 | 22.70 | - | - | - | - | - | - | 0.05 | 22.70 |
| 46 | Mobikwik | 3.39 | 804.92 | - | - | - | - | - | - | 3.39 | 804.92 |
| 47 | NSDL Payments Bank Apps | 0.02 | 3.00 | - | - | - | - | - | - | 0.02 | 3.00 |
| 48 | Paytm Payments Bank App | 1,027.97 | 116,864.36 | 10.52 | 17.08 | 0.43 | 621.78 | 98.61 | 19,025.03 | 1,137.53 | 136,528.25 |
| 49 | PhonePe | 3,519.12 | 620,121.97 | - | - | - | - | - | - | 3,519.12 | 620,121.97 |
| 50 | Punjab National Bank Apps | 0.33 | 90.01 | - | - | - | - | - | - | 0.33 | 90.01 |
| 51 | Punjab Sind Bank Apps | 0.04 | 12.34 | - | - | - | - | - | - | 0.04 | 12.34 |
| 52 | RBL Bank Apps | 1.65 | 487.72 | 0.00 | 0.00 | 0.10 | 1.72 | - | - | 1.74 | 489.45 |
| 53 | Samsung Pay | 5.24 | 488.33 | - | - | - | - | - | - | 5.24 | 488.33 |
| 54 | Slash | 0.01 | 0.49 | - | - | - | - | - | - | 0.01 | 0.49 |
| 55 | slice | 0.47 | 117.78 | - | - | - | - | - | - | 0.47 | 117.78 |
| 56 | South Indian Bank Apps | 0.20 | 54.81 | - | - | - | - | - | - | 0.20 | 54.81 |
| 57 | Standard Chartered Bank Apps | 0.14 | 82.79 | 0.00 | 0.00 | - | - | - | - | 0.14 | 82.79 |
| 58 | State Bank of India Apps | 3.72 | 1,753.88 | - | - | 0.00 | 0.05 | - | - | 3.72 | 1,753.93 |
| 59 | Tamilnad Mercantile Bank Apps | 0.06 | 10.21 | - | - | - | - | - | - | 0.06 | 10.21 |
| 60 | TataNeu | 0.13 | 14.54 | - | - | - | - | - | - | 0.13 | 14.54 |
| 61 | UCO Bank Apps | 0.31 | 97.44 | - | - | - | - | - | - | 0.31 | 97.44 |
| 62 | Ultracash | 0.03 | 1.67 | - | - | - | - | - | - | 0.03 | 1.67 |
| 63 | Union Bank Apps | 0.71 | 280.27 | - | - | - | - | - | - | 0.71 | 280.27 |
| 64 | Utkarsh Small Finance Bank Apps | 0.02 | 9.01 | - | - | - | - | - | - | 0.02 | 9.01 |
| 65 | 11.63 | 970.67 | - | - | - | - | - | - | 11.63 | 970.67 | |
| 66 | Yes Bank Apps | 25.89 | 7,481.18 | - | - | 0.66 | 37.06 | - | - | 26.55 | 7,518.24 |
| 67 | Others | 0.03 | 9.01 | 0.00 | - | 0.00 | 0.00 | 0.00 | - | 0.03 | 9.01 |
Note:-
| UPI P2P and P2M Transactions | ||||||
|---|---|---|---|---|---|---|
| Month | Total | P2P | P2M | |||
| Volume (Mn) | Value (Cr) | Volume (Mn) | Value (Cr) | Volume (Mn) | Value (Cr) | |
| Feb'23 | 7,534.76 | 12,35,846.62 | 3,381.56 | 9,56,834.37 | 4,153.20 | 2,79,012.26 |
| UPI Payer PSP Performance (Feb'23) | |||||
|---|---|---|---|---|---|
| Sr. No. | Payer PSP | Total Volume (In Mn) | Approved % | BD % | TD % |
| 1 | Yes Bank Ltd | 2,647.71 | 98.19% | 1.56% | 0.26% |
| 2 | Axis Bank Ltd | 1,406.78 | 98.26% | 1.53% | 0.21% |
| 3 | ICICI Bank | 1,195.11 | 98.31% | 1.46% | 0.23% |
| 4 | Paytm Payments Bank | 1,058.33 | 98.17% | 1.59% | 0.24% |
| 5 | State Bank Of India | 672.74 | 98.17% | 1.59% | 0.24% |
| 6 | HDFC Bank Ltd | 596.39 | 98.47% | 1.33% | 0.20% |
| 7 | IDFC FIRST Bank | 23.00 | 97.51% | 2.47% | 0.02% |
| 8 | Kotak Mahindra Bank | 12.37 | 97.76% | 2.24% | 0.00% |
| 9 | Airtel Payments Bank | 9.11 | 95.63% | 4.26% | 0.11% |
| 10 | Federal Bank | 4.92 | 97.44% | 2.40% | 0.16% |
| 11 | India Post Payment Bank | 4.14 | 97.76% | 2.22% | 0.01% |
| 12 | RBL Bank | 2.29 | 98.88% | 1.07% | 0.05% |
| 13 | Jio Payments Bank | 1.58 | 94.85% | 4.50% | 0.64% |
| 14 | Deutsche Bank | 1.32 | 99.94% | 0.06% | 0.00% |
| 15 | Bank of Baroda | 1.28 | 89.14% | 10.52% | 0.34% |
| UPI Payee PSP Performance (Feb'23) | |||||
|---|---|---|---|---|---|
| Sr. No. | Payee PSP | Total Volume (In Mn) | Approved % | BD % | TD % |
| 1 | Yes Bank Ltd | 2,728.98 | 99.45% | 0.54% | 0.01% |
| 2 | Paytm Payments Bank | 1,734.74 | 99.56% | 0.43% | 0.00% |
| 3 | Axis Bank Ltd | 915.58 | 98.99% | 1.00% | 0.00% |
| 4 | ICICI Bank | 882.18 | 99.55% | 0.43% | 0.02% |
| 5 | HDFC Bank Ltd | 351.19 | 98.99% | 0.99% | 0.02% |
| 6 | State Bank Of India | 333.55 | 98.94% | 0.86% | 0.20% |
| 7 | Federal Bank | 115.80 | 97.62% | 1.94% | 0.44% |
| 8 | IndusInd Bank | 34.53 | 98.29% | 1.58% | 0.12% |
| 9 | Kotak Mahindra Bank | 28.51 | 99.17% | 0.82% | 0.01% |
| 10 | IDFC FIRST Bank | 22.78 | 89.05% | 10.24% | 0.70% |
| 11 | Airtel Payments Bank | 21.85 | 97.65% | 1.39% | 0.96% |
| 12 | Cosmos Bank | 21.77 | 77.80% | 19.86% | 2.34% |
| 13 | Citibank | 11.24 | 98.68% | 1.00% | 0.32% |
| 14 | Bank of Baroda | 7.51 | 86.93% | 12.49% | 0.58% |
| 15 | Canara Bank | 6.68 | 99.19% | 0.79% | 0.03% |
| UPI Merchant Category-wise Classification -February'23 (Arranged by Volume) | ||||
|---|---|---|---|---|
| Type | MCC | Description | Volume (in Mn) | Value (in Cr.) |
| High Transacting Categories | 5411 | Groceries and supermarkets | 756.86 | 24,910.12 |
| 5812 | Eating places and restaurants | 502.38 | 8,243.93 | |
| 4814 | Telecommunication services, including local and long distance calls, credit card calls, calls through use of magnetic stripe reading telephones and faxes | 412.16 | 7,977.27 | |
| 5814 | Fast food restaurants | 249.19 | 3,153.60 | |
| 5816 | Digital Goods: Games | 201.01 | 6,424.79 | |
| 5541 | Service stations (with or without ancillary services) | 198.65 | 13,745.04 | |
| 5311 | Department stores | 184.98 | 4,107.39 | |
| 5912 | Drug stores and pharmacies | 108.39 | 4,047.60 | |
| 5462 | Bakeries | 99.62 | 1,481.92 | |
| 7299 | Miscellaneous personal services not elsewhere classified | 89.88 | 5,189.7 | |
| Medium Transacting Categories | 6540 | Debit card to wallet credit (Wallet top up) | 68.22 | 4,473.96 |
| 4900 | Utilities electric, gas, water and sanitary | 63.74 | 7,164.98 | |
| 5451 | Dairies | 58.75 | 1,329.79 | |
| 5813 | Drinking places (alcoholic beverages) bars, taverns, night-clubs, cocktail lounges and discothques | 52.45 | 2,154.73 | |
| 7322 | Debt collection agencies | 48.52 | 38,625.00 | |
| 5399 | Miscellaneous general merchandise | 37.50 | 2,768.73 | |
| 5331 | Variety stores | 36.09 | 2,111.95 | |
| 6012 | Financial institutions merchandise and services | 34.87 | 14,083.38 | |
| 8999 | Professional services not elsewhere classified | 30.59 | 1,489.55 | |
| 5999 | Miscellaneous and speciality retail outlets | 30.19 | 2,218.25 | |
| All Other Categories | 5422 | Freezer and locker meat provisioners | 30.12 | 964.33 |
| 6211 | Securities brokers and dealers | 28.90 | 19,082.24 | |
| 5499 | Miscellaneous food shops convenience and speciality retail outlets | 27.64 | 612.71 | |
| 9399 | Government services not elsewhere classified | 26.43 | 2,608.63 | |
| 5732 | Electronics shops | 26.32 | 3,714.55 | |
| 7230 | Beauty and barber shops | 26.00 | 896.91 | |
| 5137 | Mens, womens and childrens uniforms and commercial clothing | 25.85 | 2,980.07 | |
| 4899 | Cable and other pay television services | 25.61 | 1,093.76 | |
| 5441 | Candy, nut and confectionery shops | 22.39 | 434.62 | |
| Others | 649.87 | 90,922.70 | ||
| Total | 4,153.20 | 2,79,012.26 | ||
| UPI Remitter Banks - Top 50 Banks (Jan'23) | |||||||
|---|---|---|---|---|---|---|---|
| Sr. No. | UPI Remitter Banks (Jan-2023) | Total Volume (In Mn) | Approved % | BD % | TD% | Total Debit Reversal Count (In Mn) | Debit Reversal Success % |
| 1 | State Bank Of India | 2153.20 | 91.62% | 6.19% | 2.20% | 12.00 | 96.00% |
| 2 | HDFC BANK LTD | 708.14 | 95.29% | 4.37% | 0.35% | 2.61 | 97.71% |
| 3 | Bank of Baroda | 522.75 | 93.00% | 6.12% | 0.87% | 2.83 | 82.99% |
| 4 | Union Bank of India | 500.43 | 93.00% | 6.60% | 0.40% | 2.31 | 81.66% |
| 5 | ICICI Bank | 421.23 | 95.62% | 3.34% | 1.04% | 2.22 | 91.47% |
| 6 | Axis Bank Ltd. | 390.33 | 95.64% | 3.88% | 0.48% | 1.24 | 90.07% |
| 7 | Paytm Payments Bank | 389.61 | 96.32% | 3.61% | 0.07% | 0.90 | 89.58% |
| 8 | Kotak Mahindra Bank | 371.30 | 94.43% | 4.72% | 0.85% | 2.26 | 15.20% |
| 9 | Canara Bank | 369.95 | 93.21% | 6.32% | 0.47% | 1.78 | 86.22% |
| 10 | Punjab National Bank | 364.04 | 92.81% | 5.57% | 1.62% | 3.46 | 53.26% |
| 11 | Bank of India | 273.77 | 94.88% | 4.50% | 0.62% | 1.33 | 75.07% |
| 12 | Indian Bank | 213.14 | 93.64% | 5.59% | 0.77% | 1.04 | 84.56% |
| 13 | Airtel Payments Bank | 173.73 | 83.53% | 15.88% | 0.59% | 0.83 | 97.11% |
| 14 | India Post Payment Bank | 159.78 | 68.12% | 18.91% | 12.96% | 2.75 | 70.58% |
| 15 | Federal Bank | 133.32 | 94.54% | 5.40% | 0.06% | 0.44 | 98.41% |
| 16 | Central Bank Of India | 130.32 | 89.97% | 8.88% | 1.15% | 1.24 | 78.08% |
| 17 | Indian Overseas Bank | 104.67 | 94.07% | 5.14% | 0.79% | 0.48 | 95.90% |
| 18 | IDBI Bank Limited | 104.40 | 93.90% | 3.97% | 2.13% | 0.72 | 86.08% |
| 19 | Bank of Maharashtra | 94.74 | 94.02% | 4.69% | 1.29% | 0.38 | 85.25% |
| 20 | UCO Bank | 92.46 | 93.03% | 6.03% | 0.94% | 0.61 | 68.02% |
| 21 | Yes Bank Ltd | 75.46 | 95.40% | 3.91% | 0.69% | 0.18 | 91.05% |
| 22 | INDUSIND BANK | 74.98 | 93.48% | 6.05% | 0.47% | 0.35 | 90.69% |
| 23 | IDFC FIRST Bank | 72.81 | 94.38% | 4.82% | 0.79% | 0.34 | 58.42% |
| 24 | Karnataka Bank | 68.47 | 89.40% | 9.21% | 1.39% | 0.25 | 77.61% |
| 25 | Fino Payments Bank | 68.27 | 79.03% | 15.53% | 5.44% | 1.13 | 50.39% |
| 26 | Karur Vysya Bank | 43.55 | 92.38% | 6.94% | 0.68% | 0.19 | 79.74% |
| 27 | Bandhan Bank | 35.86 | 85.78% | 8.82% | 5.40% | 0.54 | 69.17% |
| 28 | South Indian Bank | 33.93 | 94.46% | 5.26% | 0.28% | 0.11 | 87.34% |
| 29 | City Union Bank | 24.81 | 92.78% | 6.38% | 0.84% | 0.11 | 97.29% |
| 30 | Jammu and Kashmir Bank | 24.02 | 91.59% | 7.25% | 1.16% | 0.13 | 83.03% |
| 31 | Equitas Bank | 23.44 | 84.67% | 13.00% | 2.33% | 0.14 | 64.32% |
| 32 | Ujjivan Small Finance Bank | 22.65 | 88.59% | 6.97% | 4.44% | 0.21 | 49.41% |
| 33 | AU small Finance Bank | 21.95 | 93.85% | 6.01% | 0.14% | 0.10 | 97.88% |
| 34 | DBS Bank India Limited | 21.51 | 95.60% | 4.31% | 0.09% | 0.07 | 93.93% |
| 35 | Tamilnad Mercantile Bank | 21.15 | 90.07% | 8.34% | 1.59% | 0.11 | 54.00% |
| 36 | Punjab and Sind Bank | 20.36 | 82.29% | 16.78% | 0.94% | 0.15 | 69.58% |
| 37 | Standard Chartered | 19.02 | 96.35% | 2.67% | 0.98% | 0.10 | 84.74% |
| 38 | Citibank | 18.45 | 95.06% | 4.04% | 0.90% | 0.07 | 93.43% |
| 39 | Andhra Pradesh Grameena Vikas Bank | 17.28 | 84.81% | 11.32% | 3.87% | 0.11 | 44.79% |
| 40 | Pragathi Krishna Gramin Bank | 16.31 | 86.54% | 12.68% | 0.78% | 0.09 | 92.02% |
| 41 | Maharashtra Gramin Bank | 16.24 | 79.69% | 14.63% | 5.68% | 0.15 | 36.27% |
| 42 | Saraswat Bank | 16.14 | 95.60% | 3.84% | 0.55% | 0.05 | 74.67% |
| 43 | Kerala Gramin Bank | 14.62 | 88.71% | 10.47% | 0.82% | 0.08 | 86.36% |
| 44 | ESAF Small Finance Bank Ltd. | 13.53 | 82.67% | 16.20% | 1.12% | 0.05 | 84.62% |
| 45 | Rajasthan Marudhara Gramin Bank | 13.29 | 80.76% | 11.92% | 7.32% | 0.13 | 29.85% |
| 46 | Sarva Haryana Gramin Bank | 10.72 | 79.36% | 11.31% | 9.33% | 0.10 | 49.73% |
| 47 | RBL | 10.64 | 90.93% | 7.44% | 1.63% | 0.07 | 72.58% |
| 48 | Andhra Pragathi Grameena Bank | 9.99 | 83.50% | 13.64% | 2.86% | 0.13 | 14.05% |
| 49 | Baroda UP Gramin Bank | 9.71 | 79.21% | 11.93% | 8.86% | 0.15 | 35.44% |
| 50 | Baroda Rajasthan Kshetriya Gramin Bank | 8.11 | 81.15% | 9.94% | 8.91% | 0.12 | 29.79% |
| UPI Beneficiary Banks - Top 50 Banks (Jan'23) | |||||||
|---|---|---|---|---|---|---|---|
| Sr.No. | UPI Beneficiary Banks (Jan-2023) | Total Volume (In Mn) | Approved % | BD% | TD% | Deemed Approved % | |
| 1 | Paytm Payments Bank | 1,765.87 | 99.73% | 0.24% | 0.02% | 0.01% | |
| 2 | Yes Bank Ltd | 1,463.71 | 99.81% | 0.08% | 0.11% | 0.02% | |
| 3 | State Bank Of India | 931.08 | 98.52% | 0.22% | 1.09% | 0.17% | |
| 4 | Axis Bank Ltd. | 557.09 | 99.82% | 0.11% | 0.05% | 0.02% | |
| 5 | ICICI Bank | 554.66 | 98.92% | 0.34% | 0.68% | 0.05% | |
| 6 | HDFC BANK LTD | 401.11 | 99.15% | 0.59% | 0.20% | 0.06% | |
| 7 | Bank of Baroda | 247.34 | 98.89% | 0.28% | 0.45% | 0.37% | |
| 8 | Union Bank of India | 241.58 | 99.47% | 0.24% | 0.20% | 0.09% | |
| 9 | Canara Bank | 186.89 | 99.37% | 0.32% | 0.22% | 0.09% | |
| 10 | Federal Bank | 178.23 | 99.72% | 0.27% | 0.01% | 0.00% | |
| 11 | Punjab National Bank | 176.63 | 98.41% | 0.47% | 0.93% | 0.20% | |
| 12 | Kotak Mahindra Bank | 170.88 | 98.84% | 0.50% | 0.36% | 0.30% | |
| 13 | Bank of India | 138.67 | 99.22% | 0.25% | 0.41% | 0.11% | |
| 14 | Airtel Payments Bank | 108.80 | 98.80% | 0.45% | 0.45% | 0.30% | |
| 15 | Indian Bank | 104.40 | 99.10% | 0.29% | 0.45% | 0.17% | |
| 16 | INDUSIND BANK | 69.86 | 99.21% | 0.31% | 0.42% | 0.06% | |
| 17 | India Post Payment Bank | 67.23 | 88.28% | 1.39% | 9.93% | 0.40% | |
| 18 | Central Bank Of India | 65.86 | 98.48% | 0.59% | 0.48% | 0.45% | |
| 19 | Indian Overseas Bank | 53.55 | 99.27% | 0.24% | 0.28% | 0.21% | |
| 20 | IDBI Bank Limited | 50.98 | 98.37% | 0.39% | 0.98% | 0.27% | |
| 21 | IDFC FIRST Bank | 49.12 | 97.50% | 1.28% | 0.95% | 0.27% | |
| 22 | UCO Bank | 47.69 | 98.37% | 0.76% | 0.72% | 0.15% | |
| 23 | Bank of Maharashtra | 40.78 | 97.54% | 0.31% | 1.96% | 0.19% | |
| 24 | Karnataka Bank | 32.13 | 97.12% | 0.72% | 2.09% | 0.07% | |
| 25 | Karur Vysya Bank | 25.90 | 99.00% | 0.47% | 0.43% | 0.10% | |
| 26 | Fino Payments Bank | 23.15 | 93.70% | 1.96% | 3.42% | 0.92% | |
| 27 | South Indian Bank | 22.95 | 99.31% | 0.47% | 0.19% | 0.03% | |
| 28 | Bandhan Bank | 21.74 | 94.22% | 0.48% | 4.97% | 0.33% | |
| 29 | AU small Finance Bank | 16.74 | 98.23% | 1.67% | 0.10% | 0.01% | |
| 30 | City Union Bank | 13.81 | 98.68% | 0.72% | 0.52% | 0.08% | |
| 31 | Tamilnad Mercantile Bank | 13.05 | 97.42% | 0.84% | 1.56% | 0.18% | |
| 32 | CITI | 12.32 | 99.80% | 0.00% | 0.06% | 0.14% | |
| 33 | Ujjivan Small Finance Bank | 12.16 | 95.24% | 0.30% | 4.01% | 0.45% | |
| 34 | Equitas Bank | 11.81 | 95.43% | 2.40% | 1.97% | 0.20% | |
| 35 | Punjab and Sind Bank | 9.20 | 99.06% | 0.21% | 0.57% | 0.16% | |
| 36 | Kerala Gramin Bank | 9.19 | 98.94% | 0.47% | 0.30% | 0.28% | |
| 37 | Pragathi Krishna Gramin Bank | 9.08 | 99.04% | 0.40% | 0.29% | 0.28% | |
| 38 | Jammu and Kashmir Bank | 8.93 | 98.78% | 0.52% | 0.66% | 0.04% | |
| 39 | DBS Bank India Limited | 8.93 | 98.35% | 1.49% | 0.03% | 0.13% | |
| 40 | Andhra Pradesh Grameena Vikas Bank | 8.77 | 97.47% | 0.12% | 1.97% | 0.43% | |
| 41 | Maharashtra Gramin Bank | 7.54 | 97.16% | 0.64% | 1.79% | 0.40% | |
| 42 | ESAF Small Finance Bank Ltd. | 7.13 | 99.08% | 0.19% | 0.69% | 0.04% | |
| 43 | RBL | 6.98 | 97.73% | 1.33% | 0.78% | 0.16% | |
| 44 | Rajasthan Marudhara Gramin Bank | 6.82 | 95.99% | 0.39% | 3.23% | 0.40% | |
| 45 | Baroda UP Gramin Bank | 6.53 | 88.73% | 2.25% | 8.17% | 0.84% | |
| 46 | Saraswat Bank | 6.22 | 99.31% | 0.23% | 0.39% | 0.08% | |
| 47 | Andhra Pragathi Grameena Bank | 5.78 | 97.24% | 0.56% | 2.12% | 0.08% | |
| 48 | Sarva Haryana Gramin Bank | 5.07 | 90.27% | 0.67% | 8.79% | 0.27% | |
| 49 | Baroda Rajasthan Kshetriya Gramin Bank | 4.64 | 90.05% | 2.30% | 6.84% | 0.81% | |
| 50 | Karnataka Vikas Grameena Bank | 3.98 | 98.50% | 0.24% | 1.10% | 0.15% | |
| UPI Apps (Jan'23) | |||||||||||
|---|---|---|---|---|---|---|---|---|---|---|---|
| Sr.No. | Application Name | Customer Initiated Transactions | B2C Transactions | B2B Transactions | On-us Transactions | Total | |||||
| Volume (Mn) | Value (Cr) | Volume (Mn) | Value (Cr) | Volume (Mn) | Value (Cr) | Volume (Mn) | Value (Cr) | Volume (Mn) | Value (Cr) | ||
| 1 | Airtel Payments Bank Apps | 9.77 | 834.52 | - | - | 0.00 | 0.02 | 0.00 | 0.10 | 9.77 | 834.63 |
| 2 | Allahabad Bank Apps | 0.03 | 9.17 | - | - | - | - | - | - | 0.03 | 9.17 |
| 3 | Amazon Pay | 57.75 | 5,797.03 | - | - | - | - | - | - | 57.75 | 5,797.03 |
| 4 | AU Small Finance Bank Apps | 0.58 | 181.45 | - | - | - | - | - | - | 0.58 | 181.45 |
| 5 | Axis Bank Apps | 8.24 | 1,419.65 | 48.00 | 43.47 | 0.03 | 4.51 | - | - | 56.28 | 1,467.64 |
| 6 | Bajaj Finserv | 5.01 | 812.40 | - | - | - | - | - | - | 5.01 | 812.40 |
| 7 | Bajaj Markets | 0.01 | 0.50 | - | - | - | - | - | - | 0.01 | 0.50 |
| 8 | Bandhan Bank Apps | 0.01 | 1.47 | - | - | - | - | - | - | 0.01 | 1.47 |
| 9 | Bank of Baroda Apps | 1.10 | 423.46 | - | - | 0.00 | 0.00 | - | - | 1.10 | 423.46 |
| 10 | Bank of India Apps | 0.24 | 70.34 | - | - | - | - | - | - | 0.24 | 70.34 |
| 11 | Bank of Maharashtra Apps | 0.08 | 20.39 | - | - | - | - | - | - | 0.08 | 20.39 |
| 12 | BHIM | 24.96 | 8,164.65 | - | - | - | - | - | - | 24.96 | 8,164.65 |
| 13 | Canara Bank Apps | 1.08 | 289.29 | - | - | - | - | - | - | 1.08 | 289.29 |
| 14 | Central Bank of India Apps | 0.31 | 68.65 | - | - | 0.00 | 0.02 | - | - | 0.31 | 68.68 |
| 15 | Citi Bank Apps | 0.12 | 71.81 | - | - | 0.00 | 0.00 | - | - | 0.12 | 71.81 |
| 16 | City Union Bank Apps | 0.05 | 15.51 | - | - | - | - | - | - | 0.05 | 15.51 |
| 17 | Cointab | 0.05 | 21.16 | - | - | - | - | - | - | 0.05 | 21.16 |
| 18 | Cred | 35.18 | 19,106.82 | - | - | - | - | - | - | 35.18 | 19,106.82 |
| 19 | DBS Digibank Apps | 0.41 | 174.02 | - | - | - | - | - | - | 0.41 | 174.02 |
| 20 | Deutsche Bank Apps | 1.30 | 131.72 | - | - | 0.02 | 18.58 | - | - | 1.31 | 150.29 |
| 21 | Dhanlaxmi Bank Apps | 0.01 | 2.76 | - | - | - | - | - | - | 0.01 | 2.76 |
| 22 | Equitas Small Finance Bank Apps | 0.02 | 13.02 | - | - | - | - | - | - | 0.02 | 13.02 |
| 23 | Eroute | 0.08 | 2.29 | - | - | - | - | - | - | 0.08 | 2.29 |
| 24 | Fampay PPI | 12.80 | 175.63 | - | - | 0.00 | 0.01 | - | - | 12.80 | 175.64 |
| 25 | Fave | 0.11 | 7.87 | - | - | - | - | - | - | 0.11 | 7.87 |
| 26 | Federal Bank Apps | 4.72 | 604.60 | - | - | 0.00 | 0.00 | - | - | 4.72 | 604.61 |
| 27 | Fino Payments bank Apps | 0.11 | 7.51 | - | - | - | - | - | - | 0.11 | 7.51 |
| 28 | GoIbibo | 0.01 | 1.60 | - | - | - | - | - | - | 0.01 | 1.60 |
| 29 | Google Pay | 2,782.42 | 443,725.01 | - | - | - | - | - | - | 2,782.42 | 443,725.01 |
| 30 | Groww | 0.19 | 152.17 | - | - | - | - | - | - | 0.19 | 152.17 |
| 31 | HDFC Bank Apps | 12.30 | 3,324.64 | - | - | 0.00 | 0.16 | - | - | 12.30 | 3,324.81 |
| 32 | HSBC Bank Apps | 0.13 | 75.54 | 0.00 | 0.04 | 0.00 | 0.00 | - | - | 0.13 | 75.58 |
| 33 | ICICI Bank Apps | 32.96 | 8,950.32 | 5.27 | 376.42 | 6.90 | 7,761.41 | - | - | 45.14 | 17,088.16 |
| 34 | IDBI Bank Apps | 0.07 | 30.81 | - | - | - | - | - | - | 0.07 | 30.81 |
| 35 | IDFC Bank Apps | 10.82 | 1,635.62 | - | - | 0.66 | 586.58 | - | - | 11.47 | 2,222.20 |
| 36 | India Post Payments Bank Apps | 5.43 | 707.37 | - | - | - | - | - | - | 5.43 | 707.37 |
| 37 | Indian Bank Apps | 0.26 | 73.38 | - | - | - | - | - | - | 0.26 | 73.38 |
| 38 | Indian Overseas Bank Apps | 0.01 | 2.31 | - | - | - | - | - | - | 0.01 | 2.31 |
| 39 | IndusInd Bank Apps | 0.84 | 962.09 | - | - | - | - | - | - | 0.84 | 962.09 |
| 40 | Janata Sahakari Bank Apps | 0.01 | 3.98 | - | - | - | - | - | - | 0.01 | 3.98 |
| 41 | Jio Payments Bank Apps | 1.59 | 108.84 | - | - | - | - | - | - | 1.59 | 108.84 |
| 42 | Jupiter | 2.49 | 323.88 | - | - | - | - | - | - | 2.49 | 323.88 |
| 43 | Karnataka Bank Apps | 0.40 | 85.81 | - | - | - | - | - | - | 0.40 | 85.81 |
| 44 | Karur Vysya Bank Apps | 0.04 | 15.27 | - | - | - | - | - | - | 0.04 | 15.27 |
| 45 | Kotak Mahindra Bank Apps | 12.14 | 2,612.59 | - | - | 0.00 | 0.01 | - | - | 12.14 | 2,612.60 |
| 46 | MakeMyTrip | 0.08 | 35.59 | - | - | - | - | - | - | 0.08 | 35.59 |
| 47 | Mobikwik | 3.49 | 785.48 | - | - | - | - | - | - | 3.49 | 785.48 |
| 48 | NSDL Payments Bank Apps | 0.02 | 3.00 | - | - | - | - | - | - | 0.02 | 3.00 |
| 50 | Paytm Payments Bank App | 1,076.75 | 119,647.31 | 7.75 | 18.10 | 0.46 | 638.22 | 105.94 | 19,369.36 | 1,190.89 | 139,673.00 |
| 51 | PhonePe | 3,802.67 | 651,108.51 | - | - | - | - | - | - | 3,802.67 | 651,108.51 |
| 52 | Punjab National Bank Apps | 0.25 | 82.15 | - | - | 0.00 | 0.00 | - | - | 0.25 | 82.15 |
| 53 | Punjab Sind Bank Apps | 0.04 | 13.08 | - | - | - | - | - | - | 0.04 | 13.08 |
| 54 | RBL Bank Apps | 1.22 | 241.36 | 0.00 | 0.00 | 0.09 | 1.52 | - | - | 1.32 | 242.88 |
| 55 | Samsung Pay | 5.52 | 523.73 | - | - | - | - | - | - | 5.52 | 523.73 |
| 56 | Slash | 0.01 | 0.68 | - | - | - | - | - | - | 0.01 | 0.68 |
| 57 | slice | 0.22 | 45.82 | - | - | - | - | - | - | 0.22 | 45.82 |
| 58 | South Indian Bank Apps | 0.19 | 56.75 | - | - | - | - | - | - | 0.19 | 56.75 |
| 59 | Standard Chartered Bank Apps | 0.15 | 85.16 | 0.00 | 0.00 | - | - | - | - | 0.15 | 85.16 |
| 60 | State Bank of India Apps | 4.06 | 1,901.92 | - | - | 0.00 | 0.00 | - | - | 4.06 | 1,901.92 |
| 61 | Tamilnad Mercantile Bank Apps | 0.07 | 11.67 | - | - | - | - | - | - | 0.07 | 11.67 |
| 62 | TataNeu | 0.11 | 14.79 | - | - | - | - | - | - | 0.11 | 14.79 |
| 63 | Transerv | 0.01 | 0.71 | - | - | - | - | - | - | 0.01 | 0.71 |
| 64 | UCO Bank Apps | 0.32 | 101.06 | - | - | - | - | - | - | 0.32 | 101.06 |
| 65 | Ultracash | 0.04 | 2.25 | - | - | - | - | - | - | 0.04 | 2.25 |
| 66 | Union Bank Apps | 0.80 | 303.93 | - | - | - | - | - | - | 0.80 | 303.93 |
| 67 | Utkarsh Small Finance Bank Apps | 0.02 | 8.35 | - | - | - | - | - | - | 0.02 | 8.35 |
| 68 | 11.47 | 963.12 | - | - | - | - | - | - | 11.47 | 963.12 | |
| 69 | Yes Bank Apps | 33.37 | 12,047.35 | - | - | 0.59 | 69.27 | - | - | 33.96 | 12,116.61 |
| 70 | Others | 0.02 | 5.57 | 0.00 | 0.00 | 0.00 | 0.00 | 0.00 | 0.00 | 0.02 | 5.57 |
Note:-
| UPI P2P and P2M Transactions | ||||||
|---|---|---|---|---|---|---|
| Month | Total | P2P | P2M | |||
| Volume (Mn) | Value (Cr) | Volume (Mn) | Value (Cr) | Volume (Mn) | Value (Cr) | |
| Jan'23 | 8,036.89 | 12,98,726.62 | 3,625.95 | 9,97,781.02 | 4,410.94 | 3,00,945.60 |


| UPI Payer PSP Performance (Jan'23) | |||||
|---|---|---|---|---|---|
| Sr. No. | Payer PSP | Total Volume (In Mn) | Approved % | BD % | TD % |
| 1 | Yes Bank Ltd | 2,824.37 | 98.58% | 1.41% | 0.02% |
| 2 | Axis Bank Ltd | 1,479.23 | 98.59% | 1.40% | 0.01% |
| 3 | ICICI Bank | 1,252.34 | 98.66% | 1.30% | 0.03% |
| 4 | Paytm Payments Bank | 1,100.84 | 98.56% | 1.43% | 0.02% |
| 5 | State Bank Of India | 710.82 | 98.41% | 1.57% | 0.01% |
| 6 | HDFC Bank Ltd | 686.19 | 98.93% | 1.06% | 0.01% |
| 7 | IDFC FIRST Bank | 24.84 | 98.21% | 1.78% | 0.01% |
| 8 | Kotak Mahindra Bank | 12.41 | 97.80% | 2.19% | 0.01% |
| 9 | Airtel Payments Bank | 10.12 | 96.48% | 3.48% | 0.05% |
| 10 | India Post Payment Bank | 5.53 | 98.15% | 1.84% | 0.01% |
| 11 | Federal Bank | 4.88 | 97.60% | 2.35% | 0.05% |
| 12 | RBL Bank | 1.85 | 98.56% | 1.44% | 0.01% |
| 13 | Jio Payments Bank | 1.67 | 95.20% | 4.47% | 0.33% |
| 14 | Deutsche Bank | 1.32 | 99.94% | 0.06% | 0.00% |
| 15 | Bank of Baroda | 1.22 | 90.02% | 9.97% | 0.01% |
| UPI Payee PSP Performance (Jan'23) | |||||
|---|---|---|---|---|---|
| Sr. No. | Payee PSP | Total Volume (In Mn) | Approved % | BD % | TD % |
| 1 | Yes Bank Ltd | 2,932.04 | 99.58% | 0.38% | 0.04% |
| 2 | Paytm Payments Bank | 1,822.61 | 99.76% | 0.23% | 0.00% |
| 3 | Axis Bank Ltd | 973.07 | 99.12% | 0.79% | 0.09% |
| 4 | ICICI Bank | 920.02 | 99.06% | 0.92% | 0.02% |
| 5 | HDFC Bank Ltd | 377.04 | 99.14% | 0.85% | 0.01% |
| 6 | State Bank Of India | 372.77 | 99.08% | 0.78% | 0.13% |
| 7 | Federal Bank | 119.24 | 99.75% | 0.23% | 0.01% |
| 8 | IndusInd Bank | 33.06 | 97.45% | 1.53% | 1.03% |
| 9 | Kotak Mahindra Bank | 30.26 | 99.06% | 0.78% | 0.16% |
| 10 | Airtel Payments Bank | 27.65 | 97.58% | 1.53% | 0.89% |
| 11 | IDFC FIRST Bank | 21.55 | 97.12% | 1.82% | 1.06% |
| 12 | Cosmos Bank | 15.89 | 93.33% | 5.09% | 1.58% |
| 13 | Citibank | 12.49 | 98.76% | 0.92% | 0.32% |
| 14 | Bank of Baroda | 7.17 | 98.48% | 1.13% | 0.39% |
| 15 | Canara Bank | 6.84 | 99.33% | 0.58% | 0.09% |
| UPI Merchant Category-wise Classification -January'23 (Arranged by Volume) | ||||
|---|---|---|---|---|
| Type | MCC | Description | Volume (in Mn) | Value (in Cr.) |
| High Transacting Categories | 5411 | Groceries and supermarkets | 564.02 | 22,344.42 |
| 5812 | Eating places and restaurants | 491.54 | 8,375.30 | |
| 4814 | Telecommunication services, including local and long distance calls, credit card calls, calls through use of magnetic stripe reading telephones and faxes | 482.44 | 9,363.92 | |
| 7299 | Miscellaneous personal services not elsewhere classified | 368.30 | 15,308.25 | |
| 5816 | Digital Goods: Games | 234.75 | 7,131.77 | |
| 5814 | Fast food restaurants | 220.82 | 2,762.12 | |
| 5541 | Service stations (with or without ancillary services) | 204.78 | 14,051.71 | |
| 5499 | Miscellaneous food shops convenience and speciality retail outlets | 149.34 | 2,226.71 | |
| 5311 | Department stores | 126.90 | 3,872.16 | |
| 5912 | Drug stores and pharmacies | 102.56 | 3,884.30 | |
| Medium Transacting Categories | 5999 | Miscellaneous and speciality retail outlets | 96.64 | 2,801.27 |
| 5399 | Miscellaneous general merchandise | 92.96 | 5,439.95 | |
| 5462 | Bakeries | 90.90 | 1,373.38 | |
| 4900 | Utilities electric, gas, water and sanitary | 69.43 | 8,019.98 | |
| 7322 | Debt collection agencies | 64.89 | 56,682.85 | |
| 5813 | Drinking places (alcoholic beverages) bars, taverns, night-clubs, cocktail lounges and discothques | 52.11 | 2,181.07 | |
| 5451 | Dairies | 49.95 | 1,136.82 | |
| 6540 | Debit card to wallet credit (Wallet top up) | 45.32 | 3,864.38 | |
| 6012 | Financial institutions merchandise and services | 36.38 | 14,999.00 | |
| 5699 | Miscellaneous apparel and accessory shops | 32.43 | 4,462.01 | |
| All Other Categories | 8999 | Professional services not elsewhere classified | 30.30 | 1,505.95 |
| 6211 | Securities brokers and dealers | 29.28 | 23,874.16 | |
| 5422 | Freezer and locker meat provisioners | 28.39 | 947.61 | |
| 9399 | Government services not elsewhere classified | 27.39 | 3,057.44 | |
| 4899 | Cable and other pay television services | 27.29 | 1,125.39 | |
| 7399 | Business services not elsewhere classified | 26.61 | 2,874.68 | |
| 5732 | Electronics shops | 25.97 | 3,524.14 | |
| 4214 | Motor freight carriers and trucking local and long distance, moving and storage companies and local delivery | 22.70 | 1,583.58 | |
| 7230 | Beauty and barber shops | 22.39 | 754.48 | |
| Others | 594.15 | 71,416.81 | ||
| Total | 4,410.94 | 3,00,945.60 | ||